You are not logged in.
This means you
CAN ONLY VIEW reports that were published prior to Tuesday, April 15, 2025.
You
MUST UPGRADE YOUR MEMBERSHIP if you want to see any current reports.
AFTER MARKET UPDATE - TUESDAY, AUGUST 9TH, 2011
Previous After Market Report Next After Market Report >>>
|
|
|
|
DOW |
+429.62 |
11,239.47 |
+3.97% |
|
Volume |
2,406,412,200 |
-5% |
|
Volume |
3,723,668,000 |
-5% |
|
NASDAQ |
+124.83 |
2,482.52 |
+5.29% |
|
Advancers |
2,889 |
91% |
|
Advancers |
2,214 |
81% |
|
S&P 500 |
+53.09 |
1,172.55 |
+4.74% |
|
Decliners |
261 |
8% |
|
Decliners |
456 |
17% |
|
Russell 2000 |
+45.20 |
696.16 |
+6.94% |
|
52 Wk Highs |
3 |
|
|
52 Wk Highs |
16 |
|
|
S&P 600 |
+22.35 |
379.18 |
+6.26% |
|
52 Wk Lows |
702 |
|
|
52 Wk Lows |
484 |
|
|
 |
Strong Finish After Choppy Session on Fed Announcement
Kenneth J. Gruneisen - Passed the CAN SLIM® Master's Exam
The Dow traded in a huge range of over 600 points as investors digested the Federal Reserve's latest take on the economy. The major indices tallied large early gains that held up well into the afternoon, then they slumped into the red near the Fed's announcement, yet they finished Tuesday by rallying to new session highs at the close. Volume totals remained well above average on both exchanges, but cooled from the prior session totals on the NYSE and on the Nasdaq exchange. Advancing issues beat decliners by 11-1 on the NYSE and by nearly 5-1 on the Nasdaq. exchange. New 52-week lows substantially outnumbered new 52-week highs on the NYSE and on the Nasdaq exchange. There were 2 high-ranked companies from the CANSLIM.net Leaders List that made new 52-week highs and appeared on the CANSLIM.net BreakOuts Page, up from the prior total of 1 stock. All of the high-ranked leaders currently included on the Featured Stocks Page posted gains, however the number of most ideal stocks included on that page has been cut considerably due to the poor market action of late.
The Federal Reserve Board acknowledged that economic growth has been considerably slower than anticipated, and promised to keep interest rates at a record low at least until mid-2013. The Dow hit its low for the day following the announcement, then exploded higher as investors climbed on board. The 10-year Treasury yields plummeted after the Fed announcement. The 10-year Treasury note was up more than a point and the yield fell at one point to a record 2.03% before moving up to 2.27%. A wild ride kept the market dizzy before ending with a head-spinning rally.
Financial stocks were among the leaders on some bargain hunting after the damaging sell-off. Bank of America Corp (BAC +16.7%) rallied back considerably from the prior session's -20% loss. Energy stocks ended on an up note even though oil closed below $80 per barrel, the lowest close since last October. Exxon Mobil Corp (XOM +2.1%) overcame a big loss to post a solid gain. Apple Inc (AAPL +5.3%) briefly became the biggest U.S. company by market capitalization before Exxon Mobil Corp recovered for a strong close.
The current market correction leaves disciplined investors in a defensive stance, looking toward protecting capital rather than adding more market exposure. A new rally confirmed by a solid follow-through day (FTD) would be an important reassurance worth waiting for before new buying efforts may be justified. Meanwhile, the indices remain below their respective 200-day moving average (DMA) lines after a well-noted and damaging streak of losses. Fans of the fact-based investment system may recognize the major indices below their 200 DMA lines as a worrisome sign of an "unhealthy" market environment (M criteria).
The August 2011 issue of CANSLIM.net News will be published soon! Links to all prior reports are available on the Premium Member Homepage.
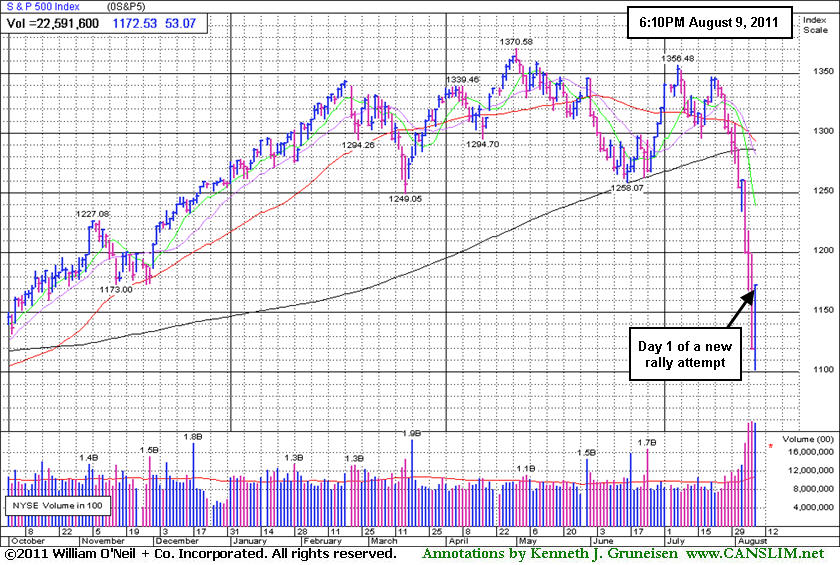
PICTURED: The S&P 500 Index rebounded after slumping into the red Tuesday afternoon, ultimately posting a solid gain that can be considered Day 1 of a new rally attempt. Disciplined investors will watch for a considerable higher-volume gain between Day 4 and Day 7 to provide a confirmation that institutional buying demand has returned in a meaningful way.
|
 Kenneth J. Gruneisen started out as a licensed stockbroker in August 1987, a couple of months prior to the historic stock market crash that took the Dow Jones Industrial Average down -22.6% in a single day. He has published daily fact-based fundamental and technical analysis on high-ranked stocks online for two decades. Through FACTBASEDINVESTING.COM, Kenneth provides educational articles, news, market commentary, and other information regarding proven investment systems that work in good times and bad.
Comments contained in the body of this report are technical opinions only and are not necessarily those of Gruneisen Growth Corp. The material herein has been obtained from sources believed to be reliable and accurate, however, its accuracy and completeness cannot be guaranteed. Our firm, employees, and customers may effect transactions, including transactions contrary to any recommendation herein, or have positions in the securities mentioned herein or options with respect thereto. Any recommendation contained in this report may not be suitable for all investors and it is not to be deemed an offer or solicitation on our part with respect to the purchase or sale of any securities. |
|
 |
Rebound Gave All Groups a Solid Boost
Kenneth J. Gruneisen - Passed the CAN SLIM® Master's Exam
The Healthcare Index ($HMO +7.85%) and Gold & Silver Index ($XAU +4.40%) tallied solid gains, but the defensive groups were not the only beneficiaries during Tuesday's rebound. Energy-related shares rebounded from their big losses on the prior session as the Oil Services Index ($OSX +6.38%) and Integrated Oil Index ($XOI +4.87%) came spurting back. The Networking Index ($NWX +6.73%), Semiconductor Index ($SOX +4.64%), Internet Index ($IIX +5.22%), and Biotechnology Index ($BTK +5.31%) posted large and unanimous gains. Financial shares were a positive influence as the Broker/Dealer Index ($XBD +5.99%) and Bank Index ($BKX +7.00%) posted big gains, and the Retail Index ($RLX +4.77%) also helped underpin the major averages while they rebounded from Monday's large losses.
Charts courtesy www.stockcharts.com
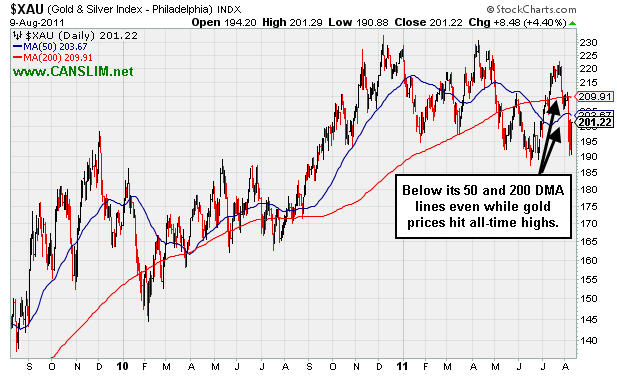
PICTURED: The Gold & Silver Index ($XAU +4.40%) has been struggling below its 50-day and 200-day moving average (DMA) lines even while gold prices hit all-time highs.
| Oil Services |
$OSX |
227.00 |
+13.61 |
+6.38% |
-7.39% |
| Healthcare |
$HMO |
1,892.09 |
+137.71 |
+7.85% |
+11.83% |
| Integrated Oil |
$XOI |
1,102.00 |
+51.21 |
+4.87% |
-9.16% |
| Semiconductor |
$SOX |
346.69 |
+15.36 |
+4.64% |
-15.82% |
| Networking |
$NWX |
231.51 |
+14.60 |
+6.73% |
-17.48% |
| Internet |
$IIX |
275.85 |
+13.68 |
+5.22% |
-10.36% |
| Broker/Dealer |
$XBD |
91.79 |
+5.19 |
+5.99% |
-24.46% |
| Retail |
$RLX |
487.56 |
+22.20 |
+4.77% |
-4.10% |
| Gold & Silver |
$XAU |
201.22 |
+8.48 |
+4.40% |
-11.19% |
| Bank |
$BKX |
39.58 |
+2.59 |
+7.00% |
-24.19% |
| Biotech |
$BTK |
1,122.24 |
+56.57 |
+5.31% |
-13.52% |
|
|
|
 |
Rallying Back Near Important Support at 50-Day Average
Kenneth J. Gruneisen - Passed the CAN SLIM® Master's Exam
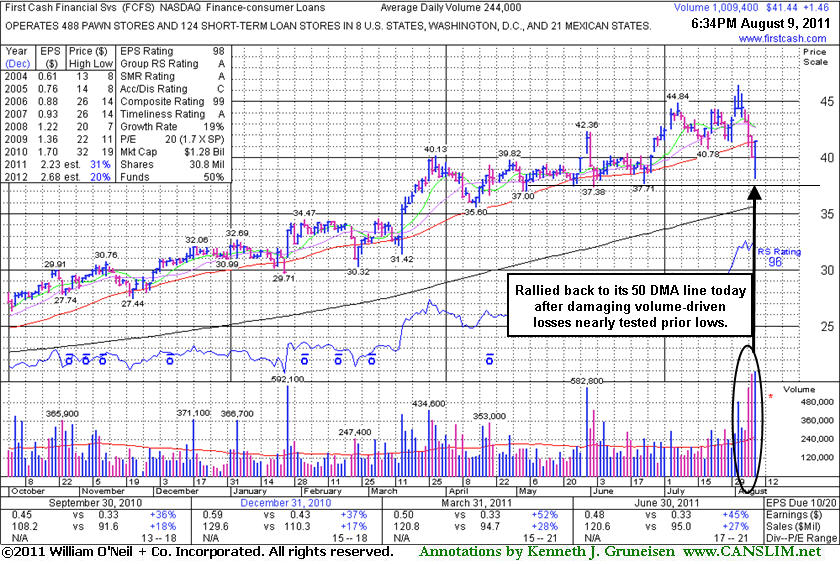
First Cash Financial Services Inc. (FCFS +$1.46 or +3.65% to $41.44) finished near the session high today with a volume-driven gain as it rallied back promptly to a close near its 50-day moving average (DMA) line after 2 damaging losses. The session low and prior chart lows near $37-38 define important support to watch above its 200 DMA line now. After its last appearance in this FSU section on 7/18/11 with an annotated graph under the headline, "Financial Services Firm Consolidating in Healthy Manner", it managed to reach a new high, but the broader market environment (M criteria) has weighed on it of late.
FCFS reported earnings +47% on +27% sales revenues for the quarter ended June 30, 2011 versus the year ago period. Its annual earnings (A criteria) history has been steady and strong. The number of top-rated funds owning its shares fell slightly from 352 in Mar '11 to 348 in Jun '11, whereas prior to that the ownership from institutional investors (I criteria) had been increasing. The M criteria (market direction) is an overriding concern arguing against all buying efforts until the nascent rally attempt is confirmed with a follow-through day of solid gains from one or more of the major averages on higher volume coupled with an expansion in leadership (new 52-week highs). Remember that 3 out of 4 stocks tend to follow along with the broader market averages' direction, so even if a stock has solid fundamentals there is no excuse to hold it if it falls more than -7% from your buy point.
|
|
|
Color Codes Explained :
Y - Better candidates highlighted by our
staff of experts.
G - Previously featured
in past reports as yellow but may no longer be buyable under the
guidelines.
***Last / Change / Volume data in this table is the closing quote data***
Symbol/Exchange
Company Name
Industry Group |
PRICE |
CHANGE
(%Change) |
Day High |
Volume
(% DAV)
(% 50 day avg vol) |
52 Wk Hi
% From Hi |
Featured
Date |
Price
Featured |
Pivot Featured |
|
Max Buy |
EXLS
-
NASDAQ
Exlservice Holdings Inc
DIVERSIFIED SERVICES - Business/Management Services
|
$25.75
|
+0.47
1.86% |
$25.91
|
163,315
217.46% of 50 DAV
50 DAV is 75,100
|
$26.46
-2.68%
|
8/2/2011
|
$24.85
|
PP = $24.85
|
|
MB = $26.09
|
 Most Recent Note - 8/9/2011 4:44:58 PM
Y - Finished near the session high today with a volume-driven gain, a sign of great support above prior highs since its 8/03/11 gain triggered a technical buy signal.
>>> The latest Featured Stock Update with an annotated graph appeared on 8/2/2011. Click here.
View all notes |
Alert me of new notes |
CANSLIM.net Company Profile |
SEC |
Zacks Reports |
StockTalk |
News |
Chart |
Request a new note
C
A N
S L
I M


|
FCFS
-
NASDAQ
First Cash Financial Svs
SPECIALTY RETAIL - Specialty Retail, Other
|
$41.44
|
+1.46
3.65% |
$41.44
|
1,009,432
413.70% of 50 DAV
50 DAV is 244,000
|
$46.42
-10.73%
|
5/31/2011
|
$42.00
|
PP = $40.23
|
|
MB = $42.24
|
Most Recent Note - 8/9/2011 4:50:52 PM
G - Finished near the session high today with a volume-driven gain as it rallied back promptly to its 50 DMA line after 2 damaging losses. The session low and prior chart lows near $37-38 define support to watch now above its 200 DMA line.
>>> The latest Featured Stock Update with an annotated graph appeared on 8/9/2011. Click here.
View all notes |
Alert me of new notes |
CANSLIM.net Company Profile |
SEC |
Zacks Reports |
StockTalk |
News |
Chart |
Request a new note
C
A N
S L
I M
|
JCOM
-
NASDAQ
J 2 Global Communication
INTERNET - Internet Software and Services
|
$29.34
|
+0.76
2.66% |
$29.43
|
706,595
236.48% of 50 DAV
50 DAV is 298,800
|
$31.72
-7.50%
|
8/8/2011
|
$30.38
|
PP = $29.31
|
|
MB = $30.78
|
Most Recent Note - 8/9/2011 4:59:48 PM
Y - Strength in the final hour today helped it rebound from a loss that took it below its 50 and 200 DMA lines and it managed to post a solid gain with more than 2 times average volume. The weakness in the market (M criteria) contributed to a negative reversal on 8/08/11 when it was featured in the mid-day report with an annotated daily graph (read here) with pivot point based on its 7/07/11 high after a double bottom type base. Technically it has been enduring distributional pressure near previously stubborn resistance in the $30 area since gapping up on 8/03/11 from below its 50 and 200 DMA lines. The 3 latest quarterly comparisons through June '11 show sales revenues and earnings acceleration and has a strong annual earnings, satisfying the C and A criteria.
>>> The latest Featured Stock Update with an annotated graph appeared on 8/8/2011. Click here.
View all notes |
Alert me of new notes |
CANSLIM.net Company Profile |
SEC |
Zacks Reports |
StockTalk |
News |
Chart |
Request a new note
C
A N
S L
I M
|
MA
-
NYSE
Mastercard Inc Cl A
DIVERSIFIED SERVICES - Business/Management Services
|
$322.81
|
+30.85
10.57% |
$322.81
|
2,571,281
191.54% of 50 DAV
50 DAV is 1,342,400
|
$340.42
-5.17%
|
8/3/2011
|
$324.82
|
PP = $322.38
|
|
MB = $338.50
|
Most Recent Note - 8/9/2011 5:14:24 PM
Y - Considerable gain down today with volume conviction helped it rally back to a close above its previously cited pivot point. Wider than usual intra-day price swings indicate uncertainty, plus the M criteria remains a concern until a new confirmed rally is noted. Color code is changed to yellow based on its prompt resilience after negating the powerful technical breakout.
>>> The latest Featured Stock Update with an annotated graph appeared on 8/3/2011. Click here.
View all notes |
Alert me of new notes |
CANSLIM.net Company Profile |
SEC |
Zacks Reports |
StockTalk |
News |
Chart |
Request a new note
C
A N
S L
I M
|
MKTX
-
NASDAQ
Marketaxess Holdings Inc
FINANCIAL SERVICES - Investment Brokerage - Nationa
|
$24.86
|
+1.54
6.60% |
$25.23
|
288,667
163.55% of 50 DAV
50 DAV is 176,500
|
$27.21
-8.64%
|
7/29/2011
|
$25.87
|
PP = $26.35
|
|
MB = $27.67
|
Most Recent Note - 8/9/2011 5:22:57 PM
Y - Promptly repaired the prior 50 DMA line violation with a considerable gain today backed by above average volume. Color code is changed to yellow after showing great support, however healthy stocks do not often dip -7% below their pivot point. The M criteria also argues against new buying efforts for now.
>>> The latest Featured Stock Update with an annotated graph appeared on 7/29/2011. Click here.
View all notes |
Alert me of new notes |
CANSLIM.net Company Profile |
SEC |
Zacks Reports |
StockTalk |
News |
Chart |
Request a new note
C
A N
S L
I M
|
Symbol/Exchange
Company Name
Industry Group |
PRICE |
CHANGE
(%Change) |
Day High |
Volume
(% DAV)
(% 50 day avg vol) |
52 Wk Hi
% From Hi |
Featured
Date |
Price
Featured |
Pivot Featured |
|
Max Buy |
PCLN
-
NASDAQ
Priceline.Com Inc
INTERNET - Internet Software and Services
|
$517.42
|
+12.42
2.46% |
$525.10
|
2,451,291
226.68% of 50 DAV
50 DAV is 1,081,400
|
$561.88
-7.91%
|
7/29/2011
|
$539.46
|
PP = $552.15
|
|
MB = $579.76
|
Most Recent Note - 8/9/2011 5:25:02 PM
G - Posted a solid gain today with above average volume and closed above its 50 DMA line. The M criteria overrides all other promising criteria, since 3 out of 4 stocks follow the direction of the major averages.
>>> The latest Featured Stock Update with an annotated graph appeared on 8/1/2011. Click here.
View all notes |
Alert me of new notes |
CANSLIM.net Company Profile |
SEC |
Zacks Reports |
StockTalk |
News |
Chart |
Request a new note
C
A N
S L
I M
|
|
|
|
THESE ARE NOT BUY RECOMMENDATIONS!
Comments contained in the body of this report are technical
opinions only. The material herein has been obtained
from sources believed to be reliable and accurate, however,
its accuracy and completeness cannot be guaranteed.
This site is not an investment advisor, hence it does
not endorse or recommend any securities or other investments.
Any recommendation contained in this report may not
be suitable for all investors and it is not to be deemed
an offer or solicitation on our part with respect to
the purchase or sale of any securities. All trademarks,
service marks and trade names appearing in this report
are the property of their respective owners, and are
likewise used for identification purposes only.
This report is a service available
only to active Paid Premium Members.
You may opt-out of receiving report notifications
at any time. Questions or comments may be submitted
by writing to Premium Membership Services 665 S.E. 10 Street, Suite 201 Deerfield Beach, FL 33441-5634 or by calling 1-800-965-8307
or 954-785-1121.
|
|
|

