You are not logged in.
This means you
CAN ONLY VIEW reports that were published prior to Tuesday, April 15, 2025.
You
MUST UPGRADE YOUR MEMBERSHIP if you want to see any current reports.
AFTER MARKET UPDATE - THURSDAY, AUGUST 11TH, 2011
Previous After Market Report Next After Market Report >>>
|
|
|
|
DOW |
+422.84 |
11,142.78 |
+3.94% |
|
Volume |
1,884,548,390 |
-12% |
|
Volume |
3,077,547,500 |
-7% |
|
NASDAQ |
+111.63 |
2,492.68 |
+4.69% |
|
Advancers |
2,760 |
88% |
|
Advancers |
2,206 |
82% |
|
S&P 500 |
+51.87 |
1,172.63 |
+4.63% |
|
Decliners |
326 |
10% |
|
Decliners |
443 |
16% |
|
Russell 2000 |
+35.68 |
695.89 |
+5.40% |
|
52 Wk Highs |
7 |
|
|
52 Wk Highs |
6 |
|
|
S&P 600 |
+19.02 |
379.45 |
+5.28% |
|
52 Wk Lows |
127 |
|
|
52 Wk Lows |
137 |
|
|
 |
Major Averages Post Solid Gains Up From 11-Month Lows
Kenneth J. Gruneisen - Passed the CAN SLIM® Master's Exam
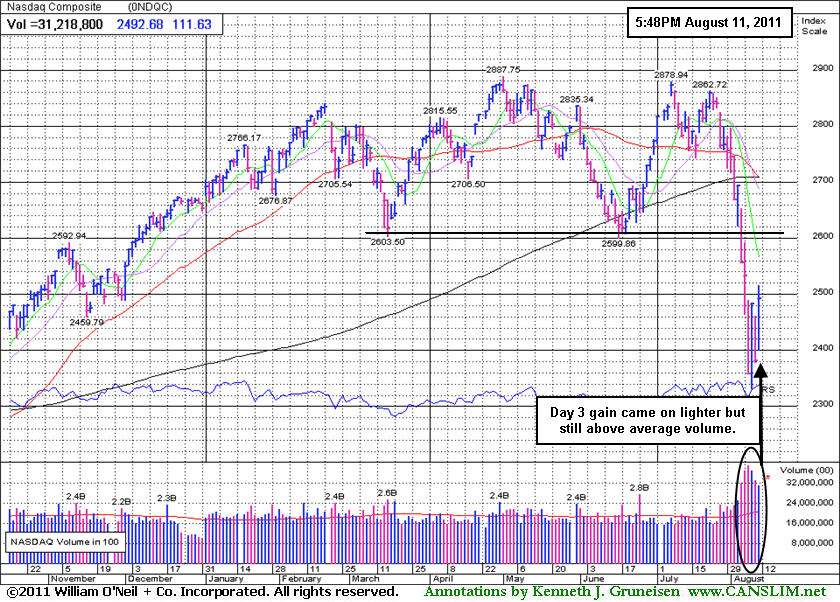
Stocks surged to the upside, extending a string of super-sized gains and losses for the major averages. A surprise report on jobs and positive corporate results set the stage. Initial jobless claims fell to a four-month low below 400,000. Thursday's volume totals were lighter on the NYSE and on the Nasdaq exchange versus the prior session while the major averages closed with big gains, completing Day 3 of a new rally effort after the Dow and S&P 500 hit 11-month lows on Wednesday. Advancing issues led decliners by 8-1 on the NYSE and by 5-1 on the Nasdaq exchange. New 52-week lows substantially outnumbered new 52-week highs on the NYSE and on the Nasdaq exchange, and the new highs totals remained in the single digits on both exchanges. Only 3 high-ranked companies from the CANSLIM.net Leaders List made new 52-week highs and appeared on the CANSLIM.net BreakOuts Page, matching the prior session's total of 3 stocks. Gains were posted by 6 of the 7 high-ranked leaders currently included on the Featured Stocks Page.
Cisco Systems Inc (CSCO +15.95) reported sales revenues and earnings that beat estimates. Kohl’s Corp (KSS +7.25%) hiked its earnings outlook and the shares advanced. Financial shares also powered up as Morgan Stanley (MS +10.7%) JP Morgan Chase & Co. (JPM +6.75%) and Citigroup, Inc. (C +6.32%) tallied big gains. None of the familiar names listed above is a worthy candidate for the investors using the fact-based investment system, even if the market environment was healthier. The best candidates which have recently been noted are included on the Featured Stocks Page. As we have repeated, the number of high-ranked stocks included on that page has been cut considerably in recent weeks due to the poor market (M criteria) action.
Gold's three day record rally ended as CME Group Inc (CME +7.4%) raised the amount investors must put up to buy a gold futures contract. European debt concerns eased somewhat. Leaders from Germany and France said they will meet next week to discuss the region's financial troubles. Italian bond yields dipped below 5% for the first time since July 5. US Treasuries extended their decline after a government auction of 30-year bonds resulted in the lowest demand since 2009. The 10-year Treasury note fell over a full point to yield 2.33%.
The current market correction leaves disciplined investors in a defensive stance, looking toward protecting capital rather than adding more market exposure. A new rally confirmed by a solid follow-through day (FTD) would be an important reassurance worth waiting for before new buying efforts may be justified. Disciplined investors will watch for a considerable higher-volume gain between Day 4 and Day 7 to provide a confirmation that institutional buying demand has returned in a meaningful way concerning the market environment (M criteria).
The August 2011 issue of CANSLIM.net News will be published soon! Links to all prior reports are available on the Premium Member Homepage.
PICTURED: The S&P 500 Index posted a gain with above average volume on Day 3 of its rally attempt.
|
 Kenneth J. Gruneisen started out as a licensed stockbroker in August 1987, a couple of months prior to the historic stock market crash that took the Dow Jones Industrial Average down -22.6% in a single day. He has published daily fact-based fundamental and technical analysis on high-ranked stocks online for two decades. Through FACTBASEDINVESTING.COM, Kenneth provides educational articles, news, market commentary, and other information regarding proven investment systems that work in good times and bad.
Comments contained in the body of this report are technical opinions only and are not necessarily those of Gruneisen Growth Corp. The material herein has been obtained from sources believed to be reliable and accurate, however, its accuracy and completeness cannot be guaranteed. Our firm, employees, and customers may effect transactions, including transactions contrary to any recommendation herein, or have positions in the securities mentioned herein or options with respect thereto. Any recommendation contained in this report may not be suitable for all investors and it is not to be deemed an offer or solicitation on our part with respect to the purchase or sale of any securities. |
|
 |
Networking Group Fell -36.9% From 2011 High
Kenneth J. Gruneisen - Passed the CAN SLIM® Master's Exam
The Networking Index ($NWX +9.32%) was a standout gainer on Thursday after Cisco's news, meanwhile the Internet Index ($IIX +5.36%), Semiconductor Index ($SOX +5.18%), and Biotechnology Index ($BTK +3.79%) posted gains in the tech sector. The Retail Index ($RLX +3.75%) posted a sold gain, and the influential Bank Index ($BKX +6.14%) and Broker/Dealer Index ($XBD +7.01%) posted even larger gains, helping underpin the major averages' rally effort. Energy-related shares rallied as the Integrated Oil Index ($XOI +5.34%) and Oil Services Index ($OSX +5.40%) notched big gains. The Healthcare Index ($HMO +5.57%) was also on the rebound, meanwhile, the Gold & Silver Index ($XAU +1.51%) lagged.
Charts courtesy www.stockcharts.com
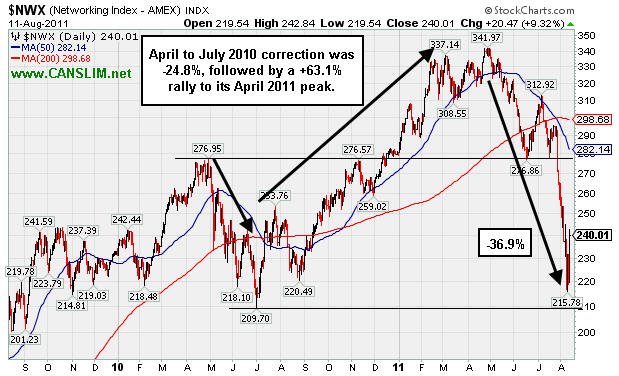
PICTURED: The Networking Index ($NWX +9.32%) had lost -24.5% during the April to July 2010 correction, followed by a +63.1% rally to its April 2011 peak. It has recently slumped as much as -26.9% from this year's high.
| Oil Services |
$OSX |
230.97 |
+11.84 |
+5.40% |
-5.77% |
| Healthcare |
$HMO |
1,916.45 |
+101.16 |
+5.57% |
+13.27% |
| Integrated Oil |
$XOI |
1,119.51 |
+56.76 |
+5.34% |
-7.72% |
| Semiconductor |
$SOX |
357.12 |
+17.58 |
+5.18% |
-13.28% |
| Networking |
$NWX |
240.01 |
+20.47 |
+9.32% |
-14.45% |
| Internet |
$IIX |
278.57 |
+14.08 |
+5.32% |
-9.47% |
| Broker/Dealer |
$XBD |
90.93 |
+5.96 |
+7.01% |
-25.17% |
| Retail |
$RLX |
483.36 |
+17.46 |
+3.75% |
-4.92% |
| Gold & Silver |
$XAU |
208.65 |
+3.11 |
+1.51% |
-7.91% |
| Bank |
$BKX |
38.56 |
+2.23 |
+6.14% |
-26.14% |
| Biotech |
$BTK |
1,103.18 |
+40.25 |
+3.79% |
-14.99% |
|
|
|
 |
Management Motivated, But Market Remains Concern
Kenneth J. Gruneisen - Passed the CAN SLIM® Master's Exam
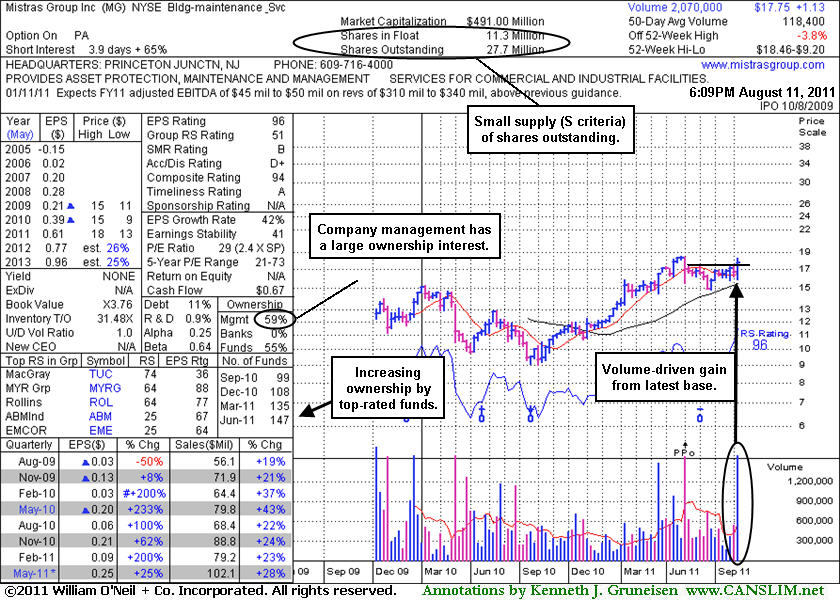
Mistras Group Inc (MG +$0.06 or +0.34% to $17.75) held its ground today. The 8/10/11 mid-day report (read here) included an annotated daily graph that showed its considerable gain driven by heavy volume, rallying from a base formed since the previously noted Public Offering on 5/05/11. It found support well above its 200 DMA line after it was dropped from the Featured Stocks list on 6/14/11. It maintained it solid earnings history concerning the C and A criteria. faces very little resistance due to overhead supply up to its 52-week high. Keep in mind, the M criteria still argues against new buying efforts, and disciplined investors know that 3 out of 4 stocks follow the direction of the major averages.
Its Accumulation/Distribution rating recently improved to a D+ but still is a concern. The Building - Maintenance Services group has a Group Relative Strength Rating (51) that is also mediocre, whereas the L criteria calls for leadership in the industry group. However, the number of top-rated funds owning its shares rose from 99 in Sep '10 to 147 in Jun '11, a very reassuring sign concerning the I criteria. Management's large 59% ownership interest keeps them very motivated to look after and build shareholder value. The small supply (S criteria) of only 27.7 million shares outstanding and 11.3 million in the public float can contribute to greater price volatility in the event of institutional buying or selling. Disciplined investors avoid chasing extended stocks more than +5% above their pivot point, and always limit losses at 7-8% if ever a stock falls that much after purchased. That is the only way to remove the chance of a small loss growing to become a much more painful and damaging loss.
|
|
|
Color Codes Explained :
Y - Better candidates highlighted by our
staff of experts.
G - Previously featured
in past reports as yellow but may no longer be buyable under the
guidelines.
***Last / Change / Volume data in this table is the closing quote data***
Symbol/Exchange
Company Name
Industry Group |
PRICE |
CHANGE
(%Change) |
Day High |
Volume
(% DAV)
(% 50 day avg vol) |
52 Wk Hi
% From Hi |
Featured
Date |
Price
Featured |
Pivot Featured |
|
Max Buy |
EXLS
-
NASDAQ
Exlservice Holdings Inc
DIVERSIFIED SERVICES - Business/Management Services
|
$24.31
|
-0.17
-0.69% |
$25.10
|
195,381
248.26% of 50 DAV
50 DAV is 78,700
|
$26.46
-8.13%
|
8/2/2011
|
$24.85
|
PP = $24.85
|
|
MB = $26.09
|
 Most Recent Note - 8/11/2011 4:15:01 PM
Y - Down for its 4th loss with above average volume in the span of 5 sessions. Its retreat below its pivot point since its 8/03/11 breakout raises some concerns. Its 50 DMA line (now $23.22) defines important support to watch.
>>> The latest Featured Stock Update with an annotated graph appeared on 8/2/2011. Click here.
View all notes |
Alert me of new notes |
CANSLIM.net Company Profile |
SEC |
Zacks Reports |
StockTalk |
News |
Chart |
Request a new note
C
A N
S L
I M


|
FCFS
-
NASDAQ
First Cash Financial Svs
SPECIALTY RETAIL - Specialty Retail, Other
|
$44.97
|
+2.59
6.11% |
$45.46
|
727,545
272.49% of 50 DAV
50 DAV is 267,000
|
$46.42
-3.12%
|
5/31/2011
|
$42.00
|
PP = $40.23
|
|
MB = $42.24
|
Most Recent Note - 8/11/2011 4:17:06 PM
G - Up today for a 3rd consecutive volume-driven gain and a best-ever close. Prior chart lows near $37-38 define support to watch above its 200 DMA line.
>>> The latest Featured Stock Update with an annotated graph appeared on 8/9/2011. Click here.
View all notes |
Alert me of new notes |
CANSLIM.net Company Profile |
SEC |
Zacks Reports |
StockTalk |
News |
Chart |
Request a new note
C
A N
S L
I M
|
JCOM
-
NASDAQ
J 2 Global Communication
INTERNET - Internet Software and Services
|
$28.68
|
+0.73
2.61% |
$28.99
|
669,746
213.36% of 50 DAV
50 DAV is 313,900
|
$31.72
-9.58%
|
8/8/2011
|
$30.38
|
PP = $29.31
|
|
MB = $30.78
|
Most Recent Note - 8/11/2011 4:19:21 PM
G - Consolidating near its 50 and 200 DMA lines, churning a lot of volume without making progress since its 8/03/11 gap up.
>>> The latest Featured Stock Update with an annotated graph appeared on 8/8/2011. Click here.
View all notes |
Alert me of new notes |
CANSLIM.net Company Profile |
SEC |
Zacks Reports |
StockTalk |
News |
Chart |
Request a new note
C
A N
S L
I M
|
MA
-
NYSE
Mastercard Inc Cl A
DIVERSIFIED SERVICES - Business/Management Services
|
$327.39
|
+23.68
7.80% |
$330.00
|
2,549,433
180.39% of 50 DAV
50 DAV is 1,413,300
|
$340.42
-3.83%
|
8/3/2011
|
$324.82
|
PP = $322.38
|
|
MB = $338.50
|
Most Recent Note - 8/11/2011 4:24:02 PM
G - Considerable gain today with above average volume, rallying back above the previously cited pivot point to its second-best close. Color code was changed to green after it negated a powerful 8/03/11 technical breakout. Wider than usual intra-day price swings indicate uncertainty, plus the M criteria remains a concern until a new confirmed rally is noted.
>>> The latest Featured Stock Update with an annotated graph appeared on 8/3/2011. Click here.
View all notes |
Alert me of new notes |
CANSLIM.net Company Profile |
SEC |
Zacks Reports |
StockTalk |
News |
Chart |
Request a new note
C
A N
S L
I M
|
MG
-
NYSE
Mistras Group Inc
DIVERSIFIED SERVICES - Bulding and Faci;ity Management Services
|
$17.75
|
+0.06
0.34% |
$17.99
|
247,772
209.27% of 50 DAV
50 DAV is 118,400
|
$18.46
-3.85%
|
8/10/2011
|
$17.89
|
PP = $17.58
|
|
MB = $18.46
|
Most Recent Note - 8/11/2011 4:27:35 PM
Y - Held its ground today. The 8/10/11 mid-day report showed its considerable gain driven by heavy volume, rallying from a base formed since the previously noted Public Offering on 5/05/11. It found support well above its 200 DMA line after it was dropped from the Featured Stocks list on 6/14/11. It faces very little resistance due to overhead supply up to its 52-week high. Its Accumulation/Distribution rating of E (see red circle) is a concern, however the number of top-rated funds owning its shares rose from 99 in Sep '10 to 147 in Jun '11, a reassuring sign concerning the I criteria. The M criteria still argues against new buying efforts, and disciplined investors know that.

>>> The latest Featured Stock Update with an annotated graph appeared on 8/11/2011. Click here.
View all notes |
Alert me of new notes |
CANSLIM.net Company Profile |
SEC |
Zacks Reports |
StockTalk |
News |
Chart |
Request a new note
C
A N
S L
I M
|
Symbol/Exchange
Company Name
Industry Group |
PRICE |
CHANGE
(%Change) |
Day High |
Volume
(% DAV)
(% 50 day avg vol) |
52 Wk Hi
% From Hi |
Featured
Date |
Price
Featured |
Pivot Featured |
|
Max Buy |
MKTX
-
NASDAQ
Marketaxess Holdings Inc
FINANCIAL SERVICES - Investment Brokerage - Nationa
|
$24.66
|
+1.18
5.03% |
$25.16
|
204,901
130.26% of 50 DAV
50 DAV is 157,300
|
$27.21
-9.37%
|
7/29/2011
|
$25.87
|
PP = $26.35
|
|
MB = $27.67
|
Most Recent Note - 8/11/2011 4:29:48 PM
G - Rebounded back above its 50 DMA line today with slightly higher volume, and it would be most encouraging for it to find support above that short-term average. Color code was changed to green, and as previously noted, healthy stocks do not often dip -7% below their pivot point. The M criteria also argues against new buying efforts for now. See the latest FSU analysis for more details and a new annotated graph.
>>> The latest Featured Stock Update with an annotated graph appeared on 8/10/2011. Click here.
View all notes |
Alert me of new notes |
CANSLIM.net Company Profile |
SEC |
Zacks Reports |
StockTalk |
News |
Chart |
Request a new note
C
A N
S L
I M
|
PCLN
-
NASDAQ
Priceline.Com Inc
INTERNET - Internet Software and Services
|
$500.16
|
+1.36
0.27% |
$508.06
|
1,851,905
161.84% of 50 DAV
50 DAV is 1,144,300
|
$561.88
-10.98%
|
7/29/2011
|
$539.46
|
PP = $552.15
|
|
MB = $579.76
|
Most Recent Note - 8/11/2011 4:32:13 PM
G - Churned above average volume today but remained under its 50 DMA line while making little headway. The 200 DMA line and recent chart lows define the next important support to watch.
>>> The latest Featured Stock Update with an annotated graph appeared on 8/1/2011. Click here.
View all notes |
Alert me of new notes |
CANSLIM.net Company Profile |
SEC |
Zacks Reports |
StockTalk |
News |
Chart |
Request a new note
C
A N
S L
I M
|
|
|
|
THESE ARE NOT BUY RECOMMENDATIONS!
Comments contained in the body of this report are technical
opinions only. The material herein has been obtained
from sources believed to be reliable and accurate, however,
its accuracy and completeness cannot be guaranteed.
This site is not an investment advisor, hence it does
not endorse or recommend any securities or other investments.
Any recommendation contained in this report may not
be suitable for all investors and it is not to be deemed
an offer or solicitation on our part with respect to
the purchase or sale of any securities. All trademarks,
service marks and trade names appearing in this report
are the property of their respective owners, and are
likewise used for identification purposes only.
This report is a service available
only to active Paid Premium Members.
You may opt-out of receiving report notifications
at any time. Questions or comments may be submitted
by writing to Premium Membership Services 665 S.E. 10 Street, Suite 201 Deerfield Beach, FL 33441-5634 or by calling 1-800-965-8307
or 954-785-1121.
|
|
|

