You are not logged in.
This means you
CAN ONLY VIEW reports that were published prior to Monday, April 14, 2025.
You
MUST UPGRADE YOUR MEMBERSHIP if you want to see any current reports.
AFTER MARKET UPDATE - WEDNESDAY, AUGUST 6TH, 2014
Previous After Market Report Next After Market Report >>>
|
|
|
|
DOW |
+13.87 |
16,443.34 |
+0.08% |
|
Volume |
677,984,360 |
-1% |
|
Volume |
1,695,362,240 |
-3% |
|
NASDAQ |
+2.21 |
4,355.05 |
+0.05% |
|
Advancers |
1,814 |
58% |
|
Advancers |
1,697 |
58% |
|
S&P 500 |
+0.03 |
1,920.24 |
+0.00% |
|
Decliners |
1,229 |
39% |
|
Decliners |
1,098 |
38% |
|
Russell 2000 |
+3.99 |
1,125.55 |
+0.36% |
|
52 Wk Highs |
28 |
|
|
52 Wk Highs |
20 |
|
|
S&P 600 |
+1.62 |
649.48 |
+0.25% |
|
52 Wk Lows |
68 |
|
|
52 Wk Lows |
73 |
|
|
 |
Major Averages Rose With Less Volume Conviction
Kenneth J. Gruneisen - Passed the CAN SLIM® Master's Exam
On Wednesday the major averages reversed early losses and closed little changed as investors digested failed M&A deals. The volume totals were lighter than the prior session volume totals on the NYSE and on the Nasdaq exchange. Advancers led decliners by a 3-2 margin on the NYSE and on the Nasdaq exchange. There were 9 high-ranked companies from the CANSLIM.net Leaders List that made new 52-week highs and appeared on the CANSLIM.net BreakOuts Page, down from the prior session total of 11 stocks. A healthy level of leadership (stocks hitting new 52-week highs) is necessary for any sustained rally. New 52-week lows outnumbered new 52-week highs on the NYSE and on the Nasdaq exchange. There were gains for 4 of the 11 of the high-ranked companies currently included on the Featured Stocks Page. The market (M criteria) deterioration of late appeared to earn the label of a "correction" as the technical damage became even more significant to chart readers. Disciplined investors limit losses and reduce market exposure during rough market periods by selling any stocks which fall more than -7% from their purchase price.
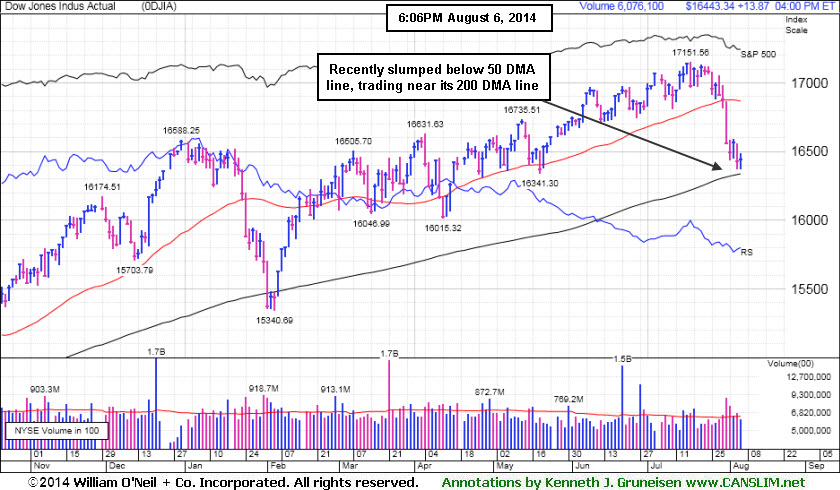
PICTURED: The Dow Jones Industrial Average gained 13 points to 16,443. Volume totals were above average as it recently slumped below its 50-day moving average (DMA) line toward its 200 DMA line.
The S&P 500 closed virtually unchanged as it rose less than a point to 1,920. The NASDAQ climbed 2 points to 4,355. Four of the 10 S&P 500 sectors advanced. Exxon Mobil (XOM +0.79%) rose while materials and energy were notable outperformers. Dow Chemical (DOW +0.76%) and Monsanto (MON +1.05%) gained as the USDA inched closer to approving genetically modified crops developed by both companies.
Consumer stocks were mixed. 21st Century Fox (FOX +2.06%) rallied after its CEO Rupert Murdoch announced he would no longer pursue a takeover bid for Time Warner, (TWX -12.85%) which saw its shares fall. Walgreens (WAG -14.34%) fell following its announcement that it will no longer pursue a tax inversion through its acquisition of Alliance Boots. The more defensive sectors of telecom and utilities finished lower. Sprint (S -18.96%) dropped after ending talks to acquire T-Mobile (TMUS -8.40%). Shares of Duke Energy (DUK -1.61%) declined.
Treasuries closed marginally higher. The 10-year note rose 3/32 to yield 2.47%. The 30-year bond pared an earlier gain of nearly a full point and finished with an advance of 5/32 to yield 3.27%.
|
 Kenneth J. Gruneisen started out as a licensed stockbroker in August 1987, a couple of months prior to the historic stock market crash that took the Dow Jones Industrial Average down -22.6% in a single day. He has published daily fact-based fundamental and technical analysis on high-ranked stocks online for two decades. Through FACTBASEDINVESTING.COM, Kenneth provides educational articles, news, market commentary, and other information regarding proven investment systems that work in good times and bad.
Comments contained in the body of this report are technical opinions only and are not necessarily those of Gruneisen Growth Corp. The material herein has been obtained from sources believed to be reliable and accurate, however, its accuracy and completeness cannot be guaranteed. Our firm, employees, and customers may effect transactions, including transactions contrary to any recommendation herein, or have positions in the securities mentioned herein or options with respect thereto. Any recommendation contained in this report may not be suitable for all investors and it is not to be deemed an offer or solicitation on our part with respect to the purchase or sale of any securities. |
|
 |
Gold & Silver, Retail, Tech, and Financial Groups Rose
Kenneth J. Gruneisen - Passed the CAN SLIM® Master's Exam
The Gold & Silver Index ($XAU +2.08%) was a standout gainer on Wednesday. The Networking Index ($NWX +0.53%), Semiconductor Index ($SOX +0.40%), and the Biotechnology Index ($BTK +0.31%) each posted a modest gain. The Retail Index ($RLX +0.53%) was a positive influence on the major averages while the Bank Index ($BKX +0.19%) and the Broker/Dealer Index ($XBD +0.40%) also helped with modest gains. The Integrated Oil Index ($XOI +0.52%) rose while the Oil Services Index ($OSX -0.05%) finished flat.
Charts courtesy www.stockcharts.com
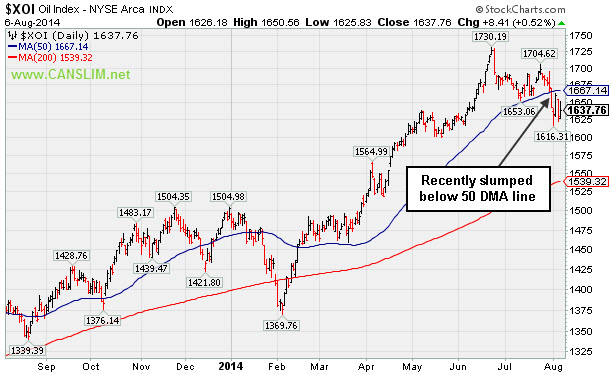
PICTURED: The Integrated Oil Index ($XOI +0.52%) recently slumped below its 50-day moving average (DMA) line.
| Oil Services |
$OSX |
286.89 |
-0.14 |
-0.05% |
+2.09% |
| Integrated Oil |
$XOI |
1,637.76 |
+8.41 |
+0.52% |
+8.96% |
| Semiconductor |
$SOX |
607.71 |
+2.40 |
+0.40% |
+13.58% |
| Networking |
$NWX |
323.44 |
+1.72 |
+0.53% |
-0.16% |
| Broker/Dealer |
$XBD |
161.69 |
+0.65 |
+0.40% |
+0.70% |
| Retail |
$RLX |
888.38 |
+4.69 |
+0.53% |
-5.47% |
| Gold & Silver |
$XAU |
101.13 |
+2.06 |
+2.08% |
+20.18% |
| Bank |
$BKX |
68.90 |
+0.13 |
+0.19% |
-0.52% |
| Biotech |
$BTK |
2,782.04 |
+8.69 |
+0.31% |
+19.38% |
|
|
|
 |
Still Building on an Advanced Base Pattern
Kenneth J. Gruneisen - Passed the CAN SLIM® Master's Exam
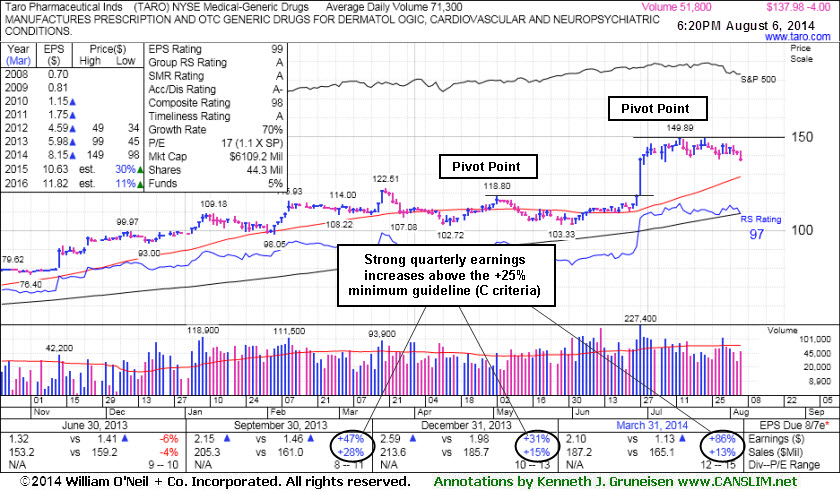
Taro Pharmaceutical Inds (TARO -$4.00 or -2.82% to $137.98) is still consolidating in a tight range since forming an advanced "3-weeks tight" base. Subsequent volume-driven gains to new highs may trigger a new (or add-on) buy signal. It was last shown in this FSU section on 7/18/14 with annotated graphs under the headline,"Big Gains in First 2-3 Weeks After Breakout an Encouraging Sign". It traded up as much as +27.7% since first featured in yellow in the 6/26/14 mid-day report at $117.31. The investment system rules say a stock should be held a minimum of 8 weeks after rising more than +20% in the first 2-3 weeks from being bought. Disciplined investors avoid chasing stocks more than +5% above prior highs.
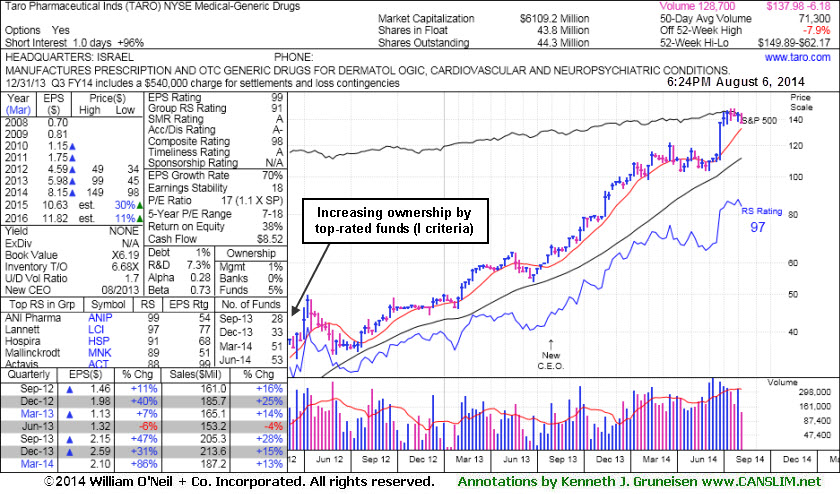
It reported earnings +86% on +13% sales revenues for the Mar '14 quarter, a 3rd consecutive quarterly comparison above the +25% minimum guideline (C criteria). The Israel-based Medical - Generic Drugs firm has seen the number of top-rated funds owning its shares rise from 2 in Mar '12 to 53 as of Jun '14, a reassuring sign concerning the I criteria.
TARO has a small supply (S criteria) of only 44.3 million shares outstanding, which is favorable, and any institutional buying or selling could lead to great price volatility. Disciplined investors always limit losses by selling any properly bought stock if it falls more than -7% from their purchase price.
|
|
|
Color Codes Explained :
Y - Better candidates highlighted by our
staff of experts.
G - Previously featured
in past reports as yellow but may no longer be buyable under the
guidelines.
***Last / Change / Volume data in this table is the closing quote data***
Symbol/Exchange
Company Name
Industry Group |
PRICE |
CHANGE
(%Change) |
Day High |
Volume
(% DAV)
(% 50 day avg vol) |
52 Wk Hi
% From Hi |
Featured
Date |
Price
Featured |
Pivot Featured |
|
Max Buy |
ACT
-
NYSE
Actavis plc
Medical-Generic Drugs
|
$206.51
|
-8.16
-3.80% |
$212.18
|
5,589,692
232.13% of 50 DAV
50 DAV is 2,408,000
|
$230.77
-10.51%
|
6/20/2014
|
$216.53
|
PP = $230.87
|
|
MB = $242.41
|
 Most Recent Note - 8/6/2014 12:03:39 PM
G - Small gap down today and its color code is changed to green while slumping below its 50 DMA line and enduring distributional pressure. A rebound above the 50 DMA line is needed for its outlook to improve. Reported earnings +70% on +34% sales revenues for the Jun '14 quarter. See the latest FSU analysis for more details and new annotated graphs.
>>> FEATURED STOCK ARTICLE : Enduring Distributional Pressure While Sputtering Near 50-Day Average - 8/5/2014
View all notes |
Set NEW NOTE alert |
CANSLIM.net Company Profile |
SEC
News |
Chart |
Request a new note
C
A N
S L
I M


|
AFSI
-
NASDAQ
Amtrust Financial Svcs
INSURANCE - Property and; Casualty Insurance
|
$43.18
|
+0.39
0.91% |
$43.26
|
534,868
97.78% of 50 DAV
50 DAV is 547,000
|
$47.10
-8.32%
|
5/21/2014
|
$44.85
|
PP = $44.85
|
|
MB = $47.09
|
Most Recent Note - 8/4/2014 5:34:37 PM
G - Consolidating just above its 50 DMA line, still facing resistance due to overhead supply up through the $47 level.
>>> FEATURED STOCK ARTICLE : 50-Day Moving Average Line Acted as Recent Resistance - 7/23/2014
View all notes |
Set NEW NOTE alert |
CANSLIM.net Company Profile |
SEC
News |
Chart |
Request a new note
C
A N
S L
I M
|
BITA
-
NYSE
Bitauto Hldgs Ltd Ads
Internet-Content
|
$60.94
|
+1.89
3.20% |
$62.23
|
1,153,888
125.83% of 50 DAV
50 DAV is 917,000
|
$60.56
0.63%
|
6/26/2014
|
$46.20
|
PP = $47.03
|
|
MB = $49.38
|
Most Recent Note - 8/4/2014 12:10:19 PM
G - Hitting a new 52-week high with today's volume-driven gain, getting more extended from its prior base. Its 50 DMA line ($47.63) defines important near-term support to watch on pullbacks.
>>> FEATURED STOCK ARTICLE : Strength Returned After Shake-Out and Positive Reversal - 7/21/2014
View all notes |
Set NEW NOTE alert |
CANSLIM.net Company Profile |
SEC
News |
Chart |
Request a new note
C
A N
S L
I M
|
EQM
-
NYSE
E Q T Midstream Partners
ENERGY - Oil and Gas Pipelines
|
$84.00
|
-0.12
-0.14% |
$84.91
|
293,829
85.17% of 50 DAV
50 DAV is 345,000
|
$102.51
-18.06%
|
12/12/2013
|
$53.17
|
PP = $56.51
|
|
MB = $59.34
|
Most Recent Note - 8/4/2014 5:33:00 PM
G - Gain today with light volume halted a streak of 4 losses after violating its 50 DMA line. Reported earnings +37% on +21% sales revenues for the Jun '14 quarter, an improvement after 2 sub par quarterly earnings comparisons.
>>> FEATURED STOCK ARTICLE : Volume Totals Cooling While Consolidating Near Highs - 7/17/2014
View all notes |
Set NEW NOTE alert |
CANSLIM.net Company Profile |
SEC
News |
Chart |
Request a new note
C
A N
S L
I M
|
FB
-
NASDAQ
Facebook Inc Cl A
INTERNET
|
$72.47
|
-0.22
-0.30% |
$73.72
|
30,902,340
70.47% of 50 DAV
50 DAV is 43,854,000
|
$76.74
-5.56%
|
7/24/2014
|
$76.00
|
PP = $72.69
|
|
MB = $76.32
|
Most Recent Note - 8/5/2014 5:42:30 PM
Y - Consolidating today near its pivot point, stubbornly holding its ground after gapping up on 7/24/14 to a new 52-week high following strong earnings news for the Jun '14 quarter.
>>> FEATURED STOCK ARTICLE : Breakaway Gap May Signal Beginning of Meaningful Rally - 7/24/2014
View all notes |
Set NEW NOTE alert |
CANSLIM.net Company Profile |
SEC
News |
Chart |
Request a new note
C
A N
S L
I M
|
Symbol/Exchange
Company Name
Industry Group |
PRICE |
CHANGE
(%Change) |
Day High |
Volume
(% DAV)
(% 50 day avg vol) |
52 Wk Hi
% From Hi |
Featured
Date |
Price
Featured |
Pivot Featured |
|
Max Buy |
ICON
-
NASDAQ
Iconix Brand Group Inc
CONSUMER NON-DURABLES - Textile - Apparel Footwear
|
$42.01
|
+0.02
0.05% |
$42.42
|
517,793
113.13% of 50 DAV
50 DAV is 457,700
|
$44.81
-6.25%
|
6/5/2014
|
$43.54
|
PP = $43.44
|
|
MB = $45.61
|
Most Recent Note - 8/6/2014 6:44:43 PM
G - Reported earnings +4% on +3% sales revenues for the Jun '14 quarter, below the +25% minimum earnings guideline (C criteria) raising fundamental concerns. There was a "negative reversal" on 7/29/14 as its 50 DMA line acted as resistance and it Relative Strength rating fell below 80+ minimum guideline.
>>> FEATURED STOCK ARTICLE : Fundamental and Technical Deterioration Hurts Outlook - 7/31/2014
View all notes |
Set NEW NOTE alert |
CANSLIM.net Company Profile |
SEC
News |
Chart |
Request a new note
C
A N
S L
I M
|
PANW
-
NYSE
Palo Alto Networks
Computer Sftwr-Security
|
$79.33
|
-0.43
-0.54% |
$80.10
|
492,971
27.74% of 50 DAV
50 DAV is 1,777,000
|
$85.78
-7.52%
|
7/30/2014
|
$84.21
|
PP = $85.88
|
|
MB = $90.17
|
Most Recent Note - 8/6/2014 6:46:52 PM
Y - Subsequent volume-driven gains to new high territory may trigger a new (or add-on) technical buy signal. Its 50 DMA line ($78.98) and recent low ($76.86 on 8/01/14) define important near-term support where subsequent violations would raise serious concerns and trigger technical sell signals.
>>> FEATURED STOCK ARTICLE : Found Support Above 50-Day Average Near Prior Highs - 7/22/2014
View all notes |
Set NEW NOTE alert |
CANSLIM.net Company Profile |
SEC
News |
Chart |
Request a new note
C
A N
S L
I M
|
TARO
-
NYSE
Taro Pharmaceutical Inds
DRUGS - Drug Manufacturers - Other
|
$137.98
|
-4.00
-2.82% |
$142.56
|
51,871
73.06% of 50 DAV
50 DAV is 71,000
|
$149.89
-7.95%
|
7/30/2014
|
$144.24
|
PP = $149.99
|
|
MB = $157.49
|
Most Recent Note - 8/6/2014 6:41:14 PM
Y - Still building on an advanced base pattern. Subsequent volume-driven gains to new highs may trigger a new (or add-on) buy signal. See the latest FSU analysis for more details and new annotated graphs.
>>> FEATURED STOCK ARTICLE : Still Building on an Advanced Base Pattern - 8/6/2014
View all notes |
Set NEW NOTE alert |
CANSLIM.net Company Profile |
SEC
News |
Chart |
Request a new note
C
A N
S L
I M
|
TRN
-
NYSE
Trinity Industries Inc
TRANSPORTATION - Railroads
|
$41.75
|
-1.59
-3.67% |
$42.59
|
3,496,036
113.32% of 50 DAV
50 DAV is 3,085,000
|
$47.83
-12.71%
|
4/30/2014
|
$37.79
|
PP = $38.03
|
|
MB = $39.93
|
Most Recent Note - 8/6/2014 6:42:45 PM
G - Gapped down and violated its 50 DMA line ($43.26) raising concerns and triggering a technical sell signal. Only a prompt rebound above the 50 DMA line would help its outlook improve. Reported earnings +91% on +39% sales for the Jun '14 quarter.
>>> FEATURED STOCK ARTICLE : Earnings News Due Following Tuesday's Close - 7/28/2014
View all notes |
Set NEW NOTE alert |
CANSLIM.net Company Profile |
SEC
News |
Chart |
Request a new note
C
A N
S L
I M
|
UA
-
NYSE
Under Armour Inc Cl A
CONSUMER NON-DURABLES - Textile - Apparel Clothing
|
$68.24
|
-0.11
-0.16% |
$68.92
|
1,829,577
64.90% of 50 DAV
50 DAV is 2,819,000
|
$70.94
-3.81%
|
7/10/2014
|
$58.50
|
PP = $60.79
|
|
MB = $63.83
|
Most Recent Note - 8/6/2014 6:48:24 PM
G - Recently reported earnings +0% on +34% sales revenues for the Jun '14 quarter, below the +25% minimum earnings guideline (C criteria), yet the company raised its guidance. Hold its ground stubbornly near all-time highs with no resistance remaining due to overhead supply.
>>> FEATURED STOCK ARTICLE : Bullish Action Despite Latest Earnings Below +25% Minimum Guideline - 7/30/2014
View all notes |
Set NEW NOTE alert |
CANSLIM.net Company Profile |
SEC
News |
Chart |
Request a new note
C
A N
S L
I M
|
Symbol/Exchange
Company Name
Industry Group |
PRICE |
CHANGE
(%Change) |
Day High |
Volume
(% DAV)
(% 50 day avg vol) |
52 Wk Hi
% From Hi |
Featured
Date |
Price
Featured |
Pivot Featured |
|
Max Buy |
WLK
-
NYSE
Westlake Chemical Corp
CHEMICALS - Specialty Chemicals
|
$87.53
|
+2.00
2.34% |
$88.16
|
575,394
97.03% of 50 DAV
50 DAV is 593,000
|
$91.97
-4.83%
|
4/29/2014
|
$72.79
|
PP = $69.31
|
|
MB = $72.78
|
Most Recent Note - 8/5/2014 12:15:10 PM
G - Reported earnings +11% on +6% sales revenues for the Jun '14 quarter, below the +25% minimum earnings guideline (C criteria), raising fundamental concerns. Gapped down today for a loss with above average volume, testing support at its 50 DMA line ($84.56).
>>> FEATURED STOCK ARTICLE : Extended From Prior Base After Streak of 8 Consecutive Gains - 7/25/2014
View all notes |
Set NEW NOTE alert |
CANSLIM.net Company Profile |
SEC
News |
Chart |
Request a new note
C
A N
S L
I M
|
|
|
|
THESE ARE NOT BUY RECOMMENDATIONS!
Comments contained in the body of this report are technical
opinions only. The material herein has been obtained
from sources believed to be reliable and accurate, however,
its accuracy and completeness cannot be guaranteed.
This site is not an investment advisor, hence it does
not endorse or recommend any securities or other investments.
Any recommendation contained in this report may not
be suitable for all investors and it is not to be deemed
an offer or solicitation on our part with respect to
the purchase or sale of any securities. All trademarks,
service marks and trade names appearing in this report
are the property of their respective owners, and are
likewise used for identification purposes only.
This report is a service available
only to active Paid Premium Members.
You may opt-out of receiving report notifications
at any time. Questions or comments may be submitted
by writing to Premium Membership Services 665 S.E. 10 Street, Suite 201 Deerfield Beach, FL 33441-5634 or by calling 1-800-965-8307
or 954-785-1121.
|
|
|

