You are not logged in.
This means you
CAN ONLY VIEW reports that were published prior to Tuesday, February 18, 2025.
You
MUST UPGRADE YOUR MEMBERSHIP if you want to see any current reports.
AFTER MARKET UPDATE - TUESDAY, AUGUST 5TH, 2014
Previous After Market Report Next After Market Report >>>
|
|
|
|
DOW |
-139.81 |
16,429.47 |
-0.84% |
|
Volume |
688,273,610 |
+4% |
|
Volume |
1,746,205,710 |
+13% |
|
NASDAQ |
-31.05 |
4,352.84 |
-0.71% |
|
Advancers |
859 |
27% |
|
Advancers |
1,128 |
39% |
|
S&P 500 |
-18.78 |
1,920.21 |
-0.97% |
|
Decliners |
2,199 |
69% |
|
Decliners |
1,676 |
58% |
|
Russell 2000 |
-3.26 |
1,121.56 |
-0.29% |
|
52 Wk Highs |
22 |
|
|
52 Wk Highs |
26 |
|
|
S&P 600 |
-1.02 |
647.86 |
-0.16% |
|
52 Wk Lows |
78 |
|
|
52 Wk Lows |
77 |
|
|
 |
Major Indices Faced More Damaging Distributional Pressure
Kenneth J. Gruneisen - Passed the CAN SLIM® Master's Exam
Stocks declined on Tuesday. The Dow fell 139 points to 16,429. The S&P 500 lost 18 points to 1,920. The NASDAQ was down 31 points to 4,352. The volume totals were higher than the prior session volume totals on the NYSE and on the Nasdaq exchange, a sign of more worrisome distributional pressure from large institutional investors. Decliners led advancers by an 11-4 margin on the NYSE and 3-2 on the Nasdaq exchange. There were 11 high-ranked companies from the CANSLIM.net Leaders List that made new 52-week highs and appeared on the CANSLIM.net BreakOuts Page, matching the prior session total of 11 stocks. A healthy level of leadership (stocks hitting new 52-week highs) is necessary for any sustained rally. New 52-week lows outnumbered new 52-week highs on the NYSE and on the Nasdaq exchange. There were losses for 11 of the 12 of the high-ranked companies currently included on the Featured Stocks Page. The market (M criteria) deterioration appeared to earn the label of a "correction" as the technical damage became even more significant to chart readers. Disciplined investors limit losses and reduce market exposure during rough market periods by selling any stocks which fall more than -7% from their purchase price.
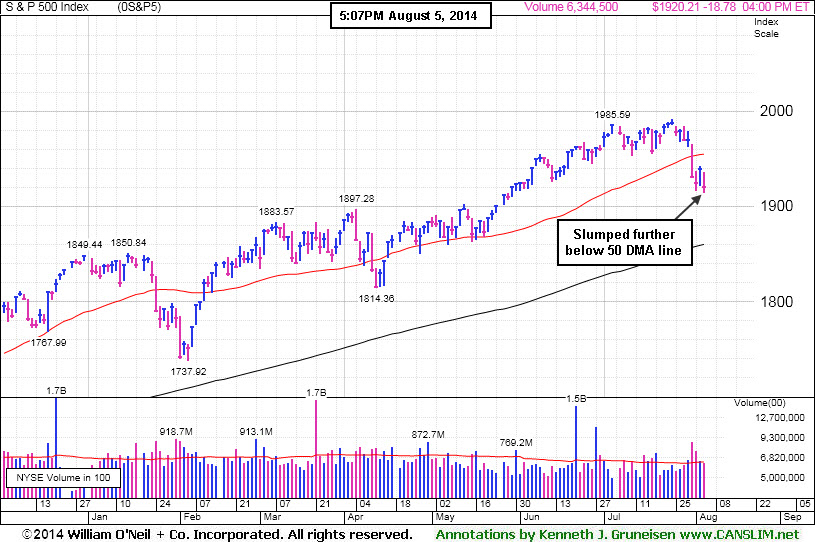
PICTURED: The S&P 500 Index fell further below its 50-day moving average (DMA) line. A rebound above that important short-term average is needed for its outlook to improve.
Equities finished lower as investors weighed geopolitical tensions and economic data. In Europe, Poland's foreign minister said Russian troops are poised to pressure or invade Ukraine and President Putin ordered the government to prepare a response to economic sanctions. On the economic front, an ISM report showed U.S. service industries expanded in July at the fastest pace since December 2005. A separate report revealed factory orders unexpectedly increased in June by the most since March.
Overall, every sector in the S&P 500 closed in negative territory. Energy paced the retreat as WTI crude fell for the sixth time in seven days as Chevron (CVX -2.5%) lost ground. Technology and consumer discretionary stocks also weighed on the market. Motorola Solutions (MSI -4.24%) fell after the company reported weak earnings results and a disappointing current-quarter outlook. Shares of Target (TGT -4.4%) fell after the retailer cut its second-quarter profit forecast. Profit tallies will stay in focus after the close with reports due out from Walt Disney (DIS -0.56%) and EOG Resources (EOG -2.84%).
Treasuries erased early losses and finished little changed. The 10-year note was flat to yield 2.48%. The 30-year bond rose 2/32 to yield 3.28%.
|
 Kenneth J. Gruneisen started out as a licensed stockbroker in August 1987, a couple of months prior to the historic stock market crash that took the Dow Jones Industrial Average down -22.6% in a single day. He has published daily fact-based fundamental and technical analysis on high-ranked stocks online for two decades. Through FACTBASEDINVESTING.COM, Kenneth provides educational articles, news, market commentary, and other information regarding proven investment systems that work in good times and bad.
Comments contained in the body of this report are technical opinions only and are not necessarily those of Gruneisen Growth Corp. The material herein has been obtained from sources believed to be reliable and accurate, however, its accuracy and completeness cannot be guaranteed. Our firm, employees, and customers may effect transactions, including transactions contrary to any recommendation herein, or have positions in the securities mentioned herein or options with respect thereto. Any recommendation contained in this report may not be suitable for all investors and it is not to be deemed an offer or solicitation on our part with respect to the purchase or sale of any securities. |
|
 |
Financial, Retail, and Energy-Linked Groups Fell
Kenneth J. Gruneisen - Passed the CAN SLIM® Master's Exam
Energy-related shares faced pressure as the Integrated Oil Index ($XOI -1.80%) and the Oil Services Index ($OSX -1.59%) sank. The Semiconductor Index ($SOX -1.14%) led the tech sector lower while the Networking Index ($NWX -0.42%) suffered a smaller loss and the Biotechnology Index ($BTK +0.12%) eked out a tiny gain. The Retail Index ($RLX -0.66%) added pressure to the major averages along with weaker financial shares as the Bank Index ($BKX -0.88%) and the Broker/Dealer Index ($XBD -0.53%) fell. The Gold & Silver Index ($XAU +0.77%) was a standout gainer.
Charts courtesy www.stockcharts.com
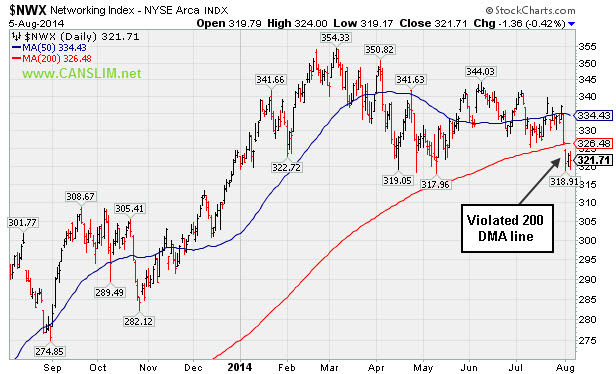
PICTURED: The Networking Index ($NWX -0.42%) recently violated its 200-day moving average (DMA) line.
| Oil Services |
$OSX |
287.03 |
-4.65 |
-1.59% |
+2.14% |
| Integrated Oil |
$XOI |
1,629.35 |
-29.88 |
-1.80% |
+8.40% |
| Semiconductor |
$SOX |
605.31 |
-6.98 |
-1.14% |
+13.14% |
| Networking |
$NWX |
321.71 |
-1.36 |
-0.42% |
-0.69% |
| Broker/Dealer |
$XBD |
161.04 |
-0.86 |
-0.53% |
+0.30% |
| Retail |
$RLX |
883.69 |
-5.91 |
-0.66% |
-5.97% |
| Gold & Silver |
$XAU |
99.07 |
+0.76 |
+0.77% |
+17.73% |
| Bank |
$BKX |
68.77 |
-0.61 |
-0.88% |
-0.71% |
| Biotech |
$BTK |
2,773.03 |
+3.43 |
+0.12% |
+18.99% |
|
|
|
 |
Enduring Distributional Pressure While Sputtering Near 50-Day Average
Kenneth J. Gruneisen - Passed the CAN SLIM® Master's Exam
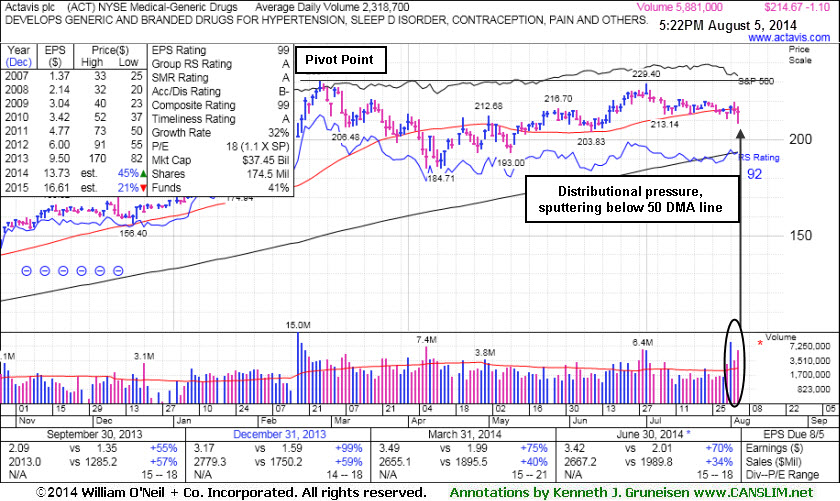
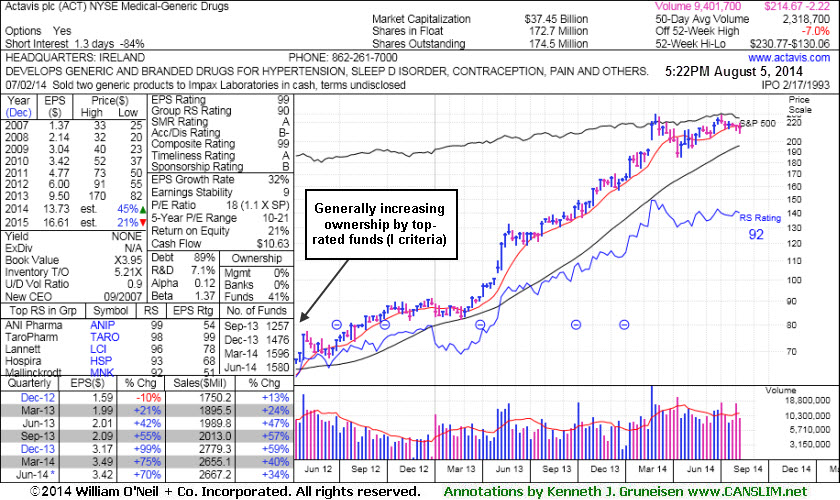
Atavis plc (ACT -$1.10 or -0.51% to $214.67) is sputtering just below its 50-day moving average (DMA) line this week with volume-driven losses indicative of distributional pressure. It is still perched only -7% off its 52-week high. It was last shown in this FSU section on 7/16/14 with annotated graphs under the headline, "Disciplined Investors Still Awaiting Technical Breakout", It was highlighted in yellow in the 6/20/14 mid-day report (read here) with a pivot point based on its 2/26/14 high plus 10 cents. Subsequent volume-driven gains should be backed by at least +40% above average volume as it hits new highs to trigger a proper technical buy signal.
The Medical - Generic Drugs industry group currently has a 90 Group Relative Strength Rating and leadership from other issues is a reassuring sign concerning the L criteria. It reported earnings +70% on +34% sales revenues for the Jun '14 quarter, and its strong record satisfies the C criteria. Its annual earnings (A criteria) history has also been strong. The number of top-rated funds owning its shares rose from 1,236 in Jun '13 to 1,580 in Jun '14, a reassuring sign concerning the I criteria.
|
|
|
Color Codes Explained :
Y - Better candidates highlighted by our
staff of experts.
G - Previously featured
in past reports as yellow but may no longer be buyable under the
guidelines.
***Last / Change / Volume data in this table is the closing quote data***
Symbol/Exchange
Company Name
Industry Group |
PRICE |
CHANGE
(%Change) |
Day High |
Volume
(% DAV)
(% 50 day avg vol) |
52 Wk Hi
% From Hi |
Featured
Date |
Price
Featured |
Pivot Featured |
|
Max Buy |
ACT
-
NYSE
Actavis plc
Medical-Generic Drugs
|
$214.67
|
-1.10
-0.51% |
$217.55
|
5,881,399
253.73% of 50 DAV
50 DAV is 2,318,000
|
$230.77
-6.98%
|
6/20/2014
|
$216.53
|
PP = $230.87
|
|
MB = $242.41
|
 Most Recent Note - 8/5/2014 5:37:11 PM
Y - Sputtering just below its 50 DMA line this week with volume-driven losses, enduring distributional pressure. Still perched -7% off its 52-week high. See the latest FSU analysis for more details and new annotated graphs.
>>> FEATURED STOCK ARTICLE : Enduring Distributional Pressure While Sputtering Near 50-Day Average - 8/5/2014
View all notes |
Set NEW NOTE alert |
CANSLIM.net Company Profile |
SEC
News |
Chart |
Request a new note
C
A N
S L
I M


|
AFSI
-
NASDAQ
Amtrust Financial Svcs
INSURANCE - Property and; Casualty Insurance
|
$42.79
|
-0.46
-1.06% |
$43.64
|
388,391
70.62% of 50 DAV
50 DAV is 550,000
|
$47.10
-9.15%
|
5/21/2014
|
$44.85
|
PP = $44.85
|
|
MB = $47.09
|
Most Recent Note - 8/4/2014 5:34:37 PM
G - Consolidating just above its 50 DMA line, still facing resistance due to overhead supply up through the $47 level.
>>> FEATURED STOCK ARTICLE : 50-Day Moving Average Line Acted as Recent Resistance - 7/23/2014
View all notes |
Set NEW NOTE alert |
CANSLIM.net Company Profile |
SEC
News |
Chart |
Request a new note
C
A N
S L
I M
|
BITA
-
NYSE
Bitauto Hldgs Ltd Ads
Internet-Content
|
$59.05
|
-0.82
-1.37% |
$60.00
|
851,065
93.32% of 50 DAV
50 DAV is 912,000
|
$60.56
-2.49%
|
6/26/2014
|
$46.20
|
PP = $47.03
|
|
MB = $49.38
|
Most Recent Note - 8/4/2014 12:10:19 PM
G - Hitting a new 52-week high with today's volume-driven gain, getting more extended from its prior base. Its 50 DMA line ($47.63) defines important near-term support to watch on pullbacks.
>>> FEATURED STOCK ARTICLE : Strength Returned After Shake-Out and Positive Reversal - 7/21/2014
View all notes |
Set NEW NOTE alert |
CANSLIM.net Company Profile |
SEC
News |
Chart |
Request a new note
C
A N
S L
I M
|
EQM
-
NYSE
E Q T Midstream Partners
ENERGY - Oil and Gas Pipelines
|
$84.12
|
-3.29
-3.76% |
$88.75
|
306,378
89.85% of 50 DAV
50 DAV is 341,000
|
$102.51
-17.94%
|
12/12/2013
|
$53.17
|
PP = $56.51
|
|
MB = $59.34
|
Most Recent Note - 8/4/2014 5:33:00 PM
G - Gain today with light volume halted a streak of 4 losses after violating its 50 DMA line. Reported earnings +37% on +21% sales revenues for the Jun '14 quarter, an improvement after 2 sub par quarterly earnings comparisons.
>>> FEATURED STOCK ARTICLE : Volume Totals Cooling While Consolidating Near Highs - 7/17/2014
View all notes |
Set NEW NOTE alert |
CANSLIM.net Company Profile |
SEC
News |
Chart |
Request a new note
C
A N
S L
I M
|
FB
-
NASDAQ
Facebook Inc Cl A
INTERNET
|
$72.69
|
-0.82
-1.12% |
$73.59
|
34,865,881
79.38% of 50 DAV
50 DAV is 43,921,000
|
$76.74
-5.28%
|
7/24/2014
|
$76.00
|
PP = $72.69
|
|
MB = $76.32
|
Most Recent Note - 8/5/2014 5:42:30 PM
Y - Consolidating today near its pivot point, stubbornly holding its ground after gapping up on 7/24/14 to a new 52-week high following strong earnings news for the Jun '14 quarter.
>>> FEATURED STOCK ARTICLE : Breakaway Gap May Signal Beginning of Meaningful Rally - 7/24/2014
View all notes |
Set NEW NOTE alert |
CANSLIM.net Company Profile |
SEC
News |
Chart |
Request a new note
C
A N
S L
I M
|
Symbol/Exchange
Company Name
Industry Group |
PRICE |
CHANGE
(%Change) |
Day High |
Volume
(% DAV)
(% 50 day avg vol) |
52 Wk Hi
% From Hi |
Featured
Date |
Price
Featured |
Pivot Featured |
|
Max Buy |
ICON
-
NASDAQ
Iconix Brand Group Inc
CONSUMER NON-DURABLES - Textile - Apparel Footwear
|
$41.99
|
-0.09
-0.21% |
$42.21
|
309,718
67.43% of 50 DAV
50 DAV is 459,300
|
$44.81
-6.29%
|
6/5/2014
|
$43.54
|
PP = $43.44
|
|
MB = $45.61
|
Most Recent Note - 7/31/2014 6:37:19 PM
G - Reported earnings +4% on +3% sales revenues for the Jun '14 quarter, below the +25% minimum earnings guideline (C criteria) raising fundamental concerns. Recent "negative reversal" as 50 DMA line acted as resistance and Relative Strength rating fell below 80+ minimum guideline. See latest FSU analysis for more details and new annotated graphs.
>>> FEATURED STOCK ARTICLE : Fundamental and Technical Deterioration Hurts Outlook - 7/31/2014
View all notes |
Set NEW NOTE alert |
CANSLIM.net Company Profile |
SEC
News |
Chart |
Request a new note
C
A N
S L
I M
|
PANW
-
NYSE
Palo Alto Networks
Computer Sftwr-Security
|
$79.76
|
-0.48
-0.60% |
$80.97
|
746,354
41.86% of 50 DAV
50 DAV is 1,783,000
|
$85.78
-7.02%
|
7/30/2014
|
$84.21
|
PP = $85.88
|
|
MB = $90.17
|
Most Recent Note - 7/31/2014 3:57:54 PM
Y - Pulling back from its 52-week high with a loss today on below average volume. Color code was changed to yellow with new pivot point cited based on its 6/30/14 high plus 10 cents while building on a short flat base. Subsequent volume-driven gains to new high territory may trigger a new (or add-on) technical buy signal. Its 50 DMA line and prior highs define important support where subsequent violations would raise serious concerns and trigger technical sell signals.
>>> FEATURED STOCK ARTICLE : Found Support Above 50-Day Average Near Prior Highs - 7/22/2014
View all notes |
Set NEW NOTE alert |
CANSLIM.net Company Profile |
SEC
News |
Chart |
Request a new note
C
A N
S L
I M
|
TARO
-
NYSE
Taro Pharmaceutical Inds
DRUGS - Drug Manufacturers - Other
|
$141.98
|
-0.55
-0.39% |
$142.53
|
29,318
41.29% of 50 DAV
50 DAV is 71,000
|
$149.89
-5.28%
|
7/30/2014
|
$144.24
|
PP = $149.99
|
|
MB = $157.49
|
Most Recent Note - 8/5/2014 5:44:03 PM
Y - Stubbornly holding its ground in a tight range since forming an advanced "3-weeks tight" base. Subsequent volume-driven gains to new highs may trigger a new (or add-on) buy signal.
>>> FEATURED STOCK ARTICLE : Big Gains in First 2-3 Weeks After Breakout an Encouraging Sign - 7/18/2014
View all notes |
Set NEW NOTE alert |
CANSLIM.net Company Profile |
SEC
News |
Chart |
Request a new note
C
A N
S L
I M
|
TRN
-
NYSE
Trinity Industries Inc
TRANSPORTATION - Railroads
|
$43.34
|
-0.49
-1.12% |
$43.73
|
2,732,870
88.67% of 50 DAV
50 DAV is 3,082,000
|
$47.83
-9.39%
|
4/30/2014
|
$37.79
|
PP = $38.03
|
|
MB = $39.93
|
Most Recent Note - 7/31/2014 3:54:48 PM
G - Gapped down today for a volume-driven loss, retreating from its 52-week high and testing its 50 DMA line ($43.19) which defines important near-term support. A damaging violation would raise concerns and trigger a technical sell signal. Reported earnings +91% on +39% sales for the Jun '14 quarter.
>>> FEATURED STOCK ARTICLE : Earnings News Due Following Tuesday's Close - 7/28/2014
View all notes |
Set NEW NOTE alert |
CANSLIM.net Company Profile |
SEC
News |
Chart |
Request a new note
C
A N
S L
I M
|
UA
-
NYSE
Under Armour Inc Cl A
CONSUMER NON-DURABLES - Textile - Apparel Clothing
|
$68.35
|
+0.07
0.10% |
$68.91
|
2,037,330
72.66% of 50 DAV
50 DAV is 2,804,000
|
$70.94
-3.65%
|
7/10/2014
|
$58.50
|
PP = $60.79
|
|
MB = $63.83
|
Most Recent Note - 7/31/2014 3:56:28 PM
G - Pulling back today with higher volume, enduring distributional pressure. Recently reported earnings +0% on +34% sales revenues for the Jun '14 quarter, below the +25% minimum earnings guideline (C criteria), yet the company raised its guidance.
>>> FEATURED STOCK ARTICLE : Bullish Action Despite Latest Earnings Below +25% Minimum Guideline - 7/30/2014
View all notes |
Set NEW NOTE alert |
CANSLIM.net Company Profile |
SEC
News |
Chart |
Request a new note
C
A N
S L
I M
|
Symbol/Exchange
Company Name
Industry Group |
PRICE |
CHANGE
(%Change) |
Day High |
Volume
(% DAV)
(% 50 day avg vol) |
52 Wk Hi
% From Hi |
Featured
Date |
Price
Featured |
Pivot Featured |
|
Max Buy |
WLK
-
NYSE
Westlake Chemical Corp
CHEMICALS - Specialty Chemicals
|
$85.53
|
-3.74
-4.19% |
$87.00
|
1,731,722
305.42% of 50 DAV
50 DAV is 567,000
|
$91.97
-7.00%
|
4/29/2014
|
$72.79
|
PP = $69.31
|
|
MB = $72.78
|
Most Recent Note - 8/5/2014 12:15:10 PM
G - Reported earnings +11% on +6% sales revenues for the Jun '14 quarter, below the +25% minimum earnings guideline (C criteria), raising fundamental concerns. Gapped down today for a loss with above average volume, testing support at its 50 DMA line ($84.56).
>>> FEATURED STOCK ARTICLE : Extended From Prior Base After Streak of 8 Consecutive Gains - 7/25/2014
View all notes |
Set NEW NOTE alert |
CANSLIM.net Company Profile |
SEC
News |
Chart |
Request a new note
C
A N
S L
I M
|
|
|
|
THESE ARE NOT BUY RECOMMENDATIONS!
Comments contained in the body of this report are technical
opinions only. The material herein has been obtained
from sources believed to be reliable and accurate, however,
its accuracy and completeness cannot be guaranteed.
This site is not an investment advisor, hence it does
not endorse or recommend any securities or other investments.
Any recommendation contained in this report may not
be suitable for all investors and it is not to be deemed
an offer or solicitation on our part with respect to
the purchase or sale of any securities. All trademarks,
service marks and trade names appearing in this report
are the property of their respective owners, and are
likewise used for identification purposes only.
This report is a service available
only to active Paid Premium Members.
You may opt-out of receiving report notifications
at any time. Questions or comments may be submitted
by writing to Premium Membership Services 665 S.E. 10 Street, Suite 201 Deerfield Beach, FL 33441-5634 or by calling 1-800-965-8307
or 954-785-1121.
|
|
|

