You are not logged in.
This means you
CAN ONLY VIEW reports that were published prior to Thursday, April 10, 2025.
You
MUST UPGRADE YOUR MEMBERSHIP if you want to see any current reports.
AFTER MARKET UPDATE - THURSDAY, AUGUST 7TH, 2014
Previous After Market Report Next After Market Report >>>
|
|
|
|
DOW |
-75.07 |
16,368.27 |
-0.46% |
|
Volume |
656,471,470 |
-3% |
|
Volume |
1,731,191,120 |
+2% |
|
NASDAQ |
-20.08 |
4,334.97 |
-0.46% |
|
Advancers |
1,415 |
45% |
|
Advancers |
1,007 |
35% |
|
S&P 500 |
-10.67 |
1,909.57 |
-0.56% |
|
Decliners |
1,660 |
53% |
|
Decliners |
1,772 |
62% |
|
Russell 2000 |
-5.79 |
1,119.76 |
-0.51% |
|
52 Wk Highs |
41 |
|
|
52 Wk Highs |
22 |
|
|
S&P 600 |
-3.45 |
646.03 |
-0.53% |
|
52 Wk Lows |
58 |
|
|
52 Wk Lows |
86 |
|
|
 |
Leadership Wanes as Major Averages Show Technical Deterioration
Kenneth J. Gruneisen - Passed the CAN SLIM® Master's Exam
Stocks retreated on Thursday as the Dow Jones Industrial Average lost 75 points to 16,368. The S&P 500 fell 12 points to 1,909. The NASDAQ declined 20 points to 4,334. The volume totals were mixed, higher than the prior session volume total on the Nasdaq exchange but lighter on the NYSE. Decliners led advancers by an 8-7 margin on the NYSE and 9-5 on the Nasdaq exchange. There were 7 high-ranked companies from the CANSLIM.net Leaders List that made new 52-week highs and appeared on the CANSLIM.net BreakOuts Page, down from the prior session total of 9 stocks. New 52-week lows outnumbered new 52-week highs on the NYSE and on the Nasdaq exchange. There were gains for 4 of the 11 of the high-ranked companies currently included on the Featured Stocks Page. The market (M criteria) deterioration of late earned the label of a "correction" as the technical damage became significant to chart readers and leadership (stocks hitting new 52-week highs) waned. Disciplined investors limit losses and reduce market exposure during rough market periods by selling any stocks which fall more than -7% from their purchase price.
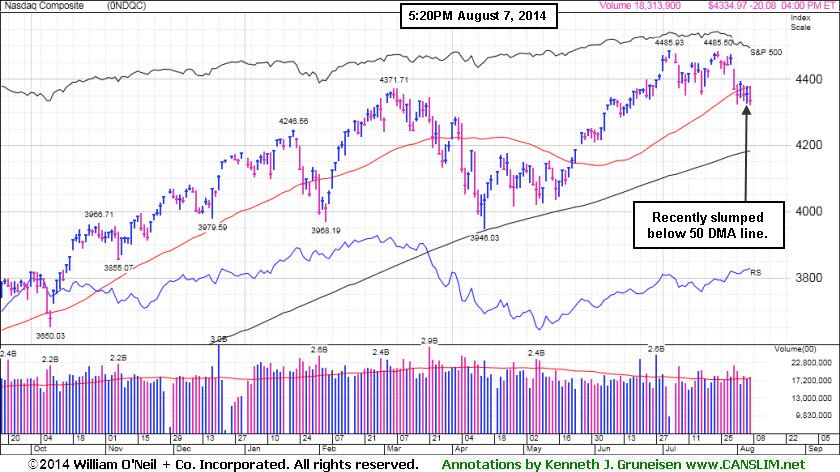
PICTURED: The Nasdaq Composite Index recently slumped below its 50-day moving average (DMA) line. A rebound above that important short-term average is needed for its outlook to improve.
After gaining in early trading, the major averages dropped as heightened geopolitical concerns prompted profit taking. Russia imposed a ban on importing food from western nations and a combat aircraft was also shot down over Ukraine. The escalating tensions between Russia and Ukraine overshadowed positive economic data. A report showed that jobless claims unexpectedly fell by 14,000 last week to 289,000, while the four-week average declined to an eight-year low.
At the close, eight of the 10 sectors in the S&P 500 were down. Health care and telecom were notable underperformers. Johnson and Johnson (JNJ -0.8%) and Pfizer (PFE -0.9%), Verizon (VZ -1.1%) and AT&T (T -0.9%) fell. The defensive utilities sector was the relative outperformer. Duke Energy (DUK +0.9%) rose following the company's strong profit tally.
Treasuries gained ground. The benchmark 10-year note rose 15/32 to yield 2.41%. The 30-year bond increased 27/32 to yield 3.22%.
|
 Kenneth J. Gruneisen started out as a licensed stockbroker in August 1987, a couple of months prior to the historic stock market crash that took the Dow Jones Industrial Average down -22.6% in a single day. He has published daily fact-based fundamental and technical analysis on high-ranked stocks online for two decades. Through FACTBASEDINVESTING.COM, Kenneth provides educational articles, news, market commentary, and other information regarding proven investment systems that work in good times and bad.
Comments contained in the body of this report are technical opinions only and are not necessarily those of Gruneisen Growth Corp. The material herein has been obtained from sources believed to be reliable and accurate, however, its accuracy and completeness cannot be guaranteed. Our firm, employees, and customers may effect transactions, including transactions contrary to any recommendation herein, or have positions in the securities mentioned herein or options with respect thereto. Any recommendation contained in this report may not be suitable for all investors and it is not to be deemed an offer or solicitation on our part with respect to the purchase or sale of any securities. |
|
 |
Financial, Tech, Retail, and Energy-Related Groups Fell
Kenneth J. Gruneisen - Passed the CAN SLIM® Master's Exam
Financial shares were a negative influence on the major averages on Thursday as the Bank Index ($BKX -0.87%) and the Broker/Dealer Index ($XBD -0.95%) lost ground. The tech sector was weak as the Biotechnology Index ($BTK -0.93%), Networking Index ($NWX -0.81%), and the Semiconductor Index ($SOX -1.37%) saw unanimous losses. The Retail Index ($RLX -0.22%) ended the session with a small loss. The Integrated Oil Index ($XOI -0.77%) and Oil Services Index ($OSX -0.59%) both edged lower while the Gold & Silver Index ($XAU -0.03%) finished flat.
Charts courtesy www.stockcharts.com
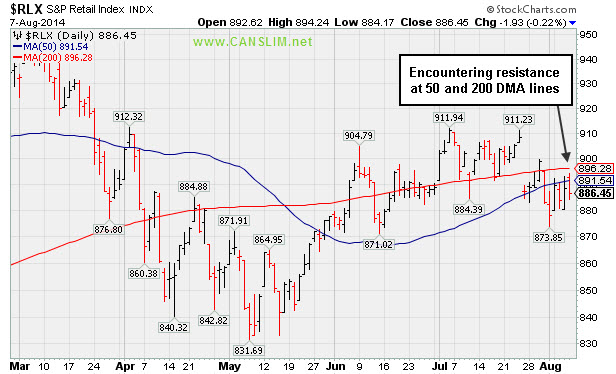
PICTURED: The Retail Index ($RLX -0.22%) has been encountering resistance at its 50-day and 200-day moving average (DMA) lines after slumping below those important moving averages.
| Oil Services |
$OSX |
285.21 |
-1.68 |
-0.59% |
+1.49% |
| Integrated Oil |
$XOI |
1,625.10 |
-12.66 |
-0.77% |
+8.11% |
| Semiconductor |
$SOX |
599.38 |
-8.33 |
-1.37% |
+12.03% |
| Networking |
$NWX |
320.82 |
-2.62 |
-0.81% |
-0.96% |
| Broker/Dealer |
$XBD |
160.15 |
-1.54 |
-0.95% |
-0.26% |
| Retail |
$RLX |
886.45 |
-1.93 |
-0.22% |
-5.68% |
| Gold & Silver |
$XAU |
101.10 |
-0.03 |
-0.03% |
+20.14% |
| Bank |
$BKX |
68.30 |
-0.60 |
-0.87% |
-1.39% |
| Biotech |
$BTK |
2,756.24 |
-25.80 |
-0.93% |
+18.27% |
|
|
|
 |
Following 50-Day Moving Average Violation Gains Lacked Volume
Kenneth J. Gruneisen - Passed the CAN SLIM® Master's Exam
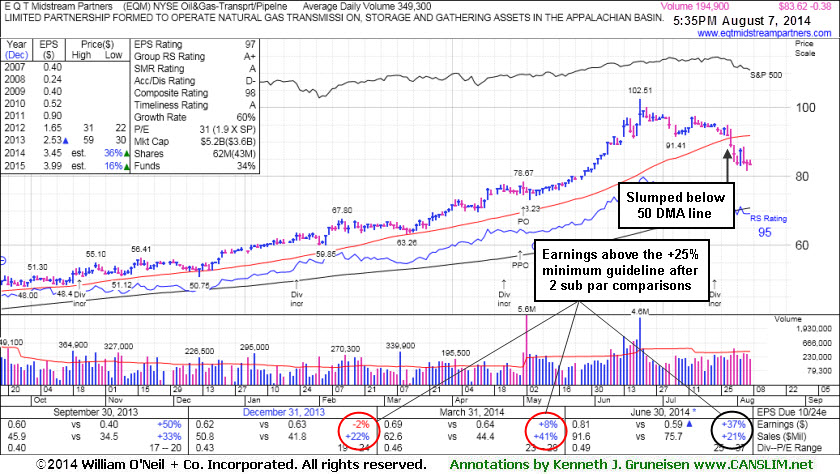
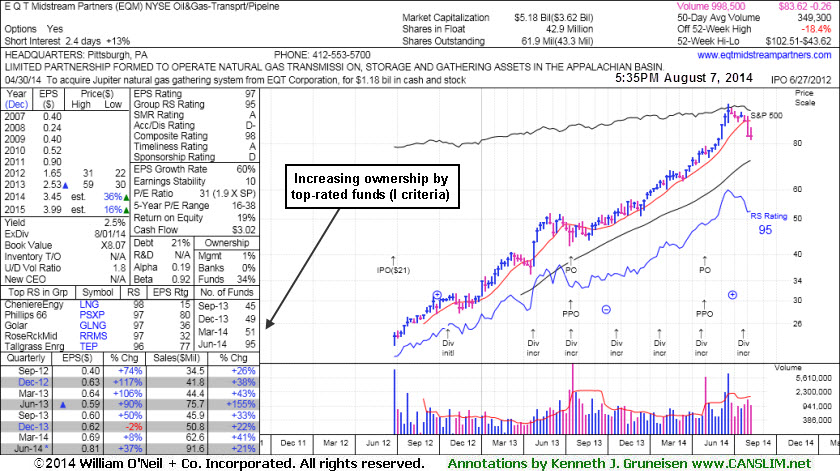
E Q T Midstream Partners' (EQM -$0.38 or -0.45% to $83.62) has only tallied gains with light volume in recent weeks, even after violating its 50-day moving average (DMA) line with volume-driven losses that triggered a technical sell signal. It recently reported earnings +37% on +21% sales revenues for the Jun '14 quarter, an improvement after 2 sub par quarterly earnings comparisons. Technically, it needs gains above its 50 DMA line for its outlook to improve and it faces resistance due to overhead supply while it is consolidating -18.4% off its 52-week high.
It was last shown in this FSU section on 7/17/14 with annotated graphs under the headline, "Volume Totals Cooling While Consolidating Near Highs". It completed a new Public Offering of 10.75 Million common units on 5/01/14. It traded up as much as +92.8% since first highlighted in yellow in the 12/12/13 mid-day report (read here) with pivot point based on its 11/18/13 high plus 10 cents. It completed a new Public Offering on 7/16/13, then made gradual progress afterward. This MLP in the Natural Gas business has seen the number of top-rated funds owning its shares rise from 20 in Jun '12 to 95 in Jun '14, a reassuring sign concerning the I criteria. Its Up/Down Volume Ratio of 1.8 is an unbiased indication its shares have been under accumulation over the past 50 days.
|
|
|
Color Codes Explained :
Y - Better candidates highlighted by our
staff of experts.
G - Previously featured
in past reports as yellow but may no longer be buyable under the
guidelines.
***Last / Change / Volume data in this table is the closing quote data***
Symbol/Exchange
Company Name
Industry Group |
PRICE |
CHANGE
(%Change) |
Day High |
Volume
(% DAV)
(% 50 day avg vol) |
52 Wk Hi
% From Hi |
Featured
Date |
Price
Featured |
Pivot Featured |
|
Max Buy |
ACT
-
NYSE
Actavis plc
Medical-Generic Drugs
|
$203.94
|
-2.57
-1.24% |
$207.51
|
3,357,416
134.84% of 50 DAV
50 DAV is 2,490,000
|
$230.77
-11.63%
|
6/20/2014
|
$216.53
|
PP = $230.87
|
|
MB = $242.41
|
Most Recent Note - 8/6/2014 12:03:39 PM
G - Small gap down today and its color code is changed to green while slumping below its 50 DMA line and enduring distributional pressure. A rebound above the 50 DMA line is needed for its outlook to improve. Reported earnings +70% on +34% sales revenues for the Jun '14 quarter. See the latest FSU analysis for more details and new annotated graphs.
>>> FEATURED STOCK ARTICLE : Enduring Distributional Pressure While Sputtering Near 50-Day Average - 8/5/2014
View all notes |
Set NEW NOTE alert |
CANSLIM.net Company Profile |
SEC
News |
Chart |
Request a new note
C
A N
S L
I M


|
AFSI
-
NASDAQ
Amtrust Financial Svcs
INSURANCE - Property and; Casualty Insurance
|
$42.66
|
-0.52
-1.20% |
$46.02
|
1,331,034
254.40% of 50 DAV
50 DAV is 523,200
|
$47.10
-9.43%
|
5/21/2014
|
$44.85
|
PP = $44.85
|
|
MB = $47.09
|
 Most Recent Note - 8/7/2014 11:55:47 AM
G - Reversed into the red after gapping up today following Jun '14 earnings news. Previously noted with caution - "Consolidating just above its 50 DMA line, facing resistance due to overhead supply up through the $47 level."
>>> FEATURED STOCK ARTICLE : 50-Day Moving Average Line Acted as Recent Resistance - 7/23/2014
View all notes |
Set NEW NOTE alert |
CANSLIM.net Company Profile |
SEC
News |
Chart |
Request a new note
C
A N
S L
I M
|
BITA
-
NYSE
Bitauto Hldgs Ltd Ads
Internet-Content
|
$62.09
|
+1.15
1.89% |
$63.50
|
1,228,072
133.20% of 50 DAV
50 DAV is 922,000
|
$62.23
-0.22%
|
6/26/2014
|
$46.20
|
PP = $47.03
|
|
MB = $49.38
|
Most Recent Note - 8/4/2014 12:10:19 PM
G - Hitting a new 52-week high with today's volume-driven gain, getting more extended from its prior base. Its 50 DMA line ($47.63) defines important near-term support to watch on pullbacks.
>>> FEATURED STOCK ARTICLE : Strength Returned After Shake-Out and Positive Reversal - 7/21/2014
View all notes |
Set NEW NOTE alert |
CANSLIM.net Company Profile |
SEC
News |
Chart |
Request a new note
C
A N
S L
I M
|
EQM
-
NYSE
E Q T Midstream Partners
ENERGY - Oil and Gas Pipelines
|
$83.62
|
-0.38
-0.45% |
$85.00
|
194,909
55.85% of 50 DAV
50 DAV is 349,000
|
$102.51
-18.43%
|
12/12/2013
|
$53.17
|
PP = $56.51
|
|
MB = $59.34
|
Most Recent Note - 8/7/2014 5:53:01 PM
G - Gains have lacked volume conviction since violating its 50 DMA line. Reported earnings +37% on +21% sales revenues for the Jun '14 quarter, an improvement after 2 sub par quarterly earnings comparisons. See latest FSU analysis for more details and new annotated graphs.
>>> FEATURED STOCK ARTICLE : Following 50-Day Moving Average Violation Gains Lacked Volume - 8/7/2014
View all notes |
Set NEW NOTE alert |
CANSLIM.net Company Profile |
SEC
News |
Chart |
Request a new note
C
A N
S L
I M
|
FB
-
NASDAQ
Facebook Inc Cl A
INTERNET
|
$73.17
|
+0.70
0.97% |
$74.00
|
38,017,794
87.68% of 50 DAV
50 DAV is 43,360,000
|
$76.74
-4.65%
|
7/24/2014
|
$76.00
|
PP = $72.69
|
|
MB = $76.32
|
Most Recent Note - 8/5/2014 5:42:30 PM
Y - Consolidating today near its pivot point, stubbornly holding its ground after gapping up on 7/24/14 to a new 52-week high following strong earnings news for the Jun '14 quarter.
>>> FEATURED STOCK ARTICLE : Breakaway Gap May Signal Beginning of Meaningful Rally - 7/24/2014
View all notes |
Set NEW NOTE alert |
CANSLIM.net Company Profile |
SEC
News |
Chart |
Request a new note
C
A N
S L
I M
|
Symbol/Exchange
Company Name
Industry Group |
PRICE |
CHANGE
(%Change) |
Day High |
Volume
(% DAV)
(% 50 day avg vol) |
52 Wk Hi
% From Hi |
Featured
Date |
Price
Featured |
Pivot Featured |
|
Max Buy |
ICON
-
NASDAQ
Iconix Brand Group Inc
CONSUMER NON-DURABLES - Textile - Apparel Footwear
|
$41.68
|
-0.33
-0.79% |
$42.40
|
318,304
69.38% of 50 DAV
50 DAV is 458,800
|
$44.81
-6.99%
|
6/5/2014
|
$43.54
|
PP = $43.44
|
|
MB = $45.61
|
Most Recent Note - 8/6/2014 6:44:43 PM
G - Reported earnings +4% on +3% sales revenues for the Jun '14 quarter, below the +25% minimum earnings guideline (C criteria) raising fundamental concerns. There was a "negative reversal" on 7/29/14 as its 50 DMA line acted as resistance and it Relative Strength rating fell below 80+ minimum guideline.
>>> FEATURED STOCK ARTICLE : Fundamental and Technical Deterioration Hurts Outlook - 7/31/2014
View all notes |
Set NEW NOTE alert |
CANSLIM.net Company Profile |
SEC
News |
Chart |
Request a new note
C
A N
S L
I M
|
PANW
-
NYSE
Palo Alto Networks
Computer Sftwr-Security
|
$79.96
|
+0.63
0.79% |
$81.60
|
665,717
38.15% of 50 DAV
50 DAV is 1,745,000
|
$85.78
-6.78%
|
7/30/2014
|
$84.21
|
PP = $85.88
|
|
MB = $90.17
|
Most Recent Note - 8/6/2014 6:46:52 PM
Y - Subsequent volume-driven gains to new high territory may trigger a new (or add-on) technical buy signal. Its 50 DMA line ($78.98) and recent low ($76.86 on 8/01/14) define important near-term support where subsequent violations would raise serious concerns and trigger technical sell signals.
>>> FEATURED STOCK ARTICLE : Found Support Above 50-Day Average Near Prior Highs - 7/22/2014
View all notes |
Set NEW NOTE alert |
CANSLIM.net Company Profile |
SEC
News |
Chart |
Request a new note
C
A N
S L
I M
|
TARO
-
NYSE
Taro Pharmaceutical Inds
DRUGS - Drug Manufacturers - Other
|
$138.45
|
+0.47
0.34% |
$140.17
|
66,474
93.63% of 50 DAV
50 DAV is 71,000
|
$149.89
-7.63%
|
7/30/2014
|
$144.24
|
PP = $149.99
|
|
MB = $157.49
|
Most Recent Note - 8/6/2014 6:41:14 PM
Y - Still building on an advanced base pattern. Subsequent volume-driven gains to new highs may trigger a new (or add-on) buy signal. See the latest FSU analysis for more details and new annotated graphs.
>>> FEATURED STOCK ARTICLE : Still Building on an Advanced Base Pattern - 8/6/2014
View all notes |
Set NEW NOTE alert |
CANSLIM.net Company Profile |
SEC
News |
Chart |
Request a new note
C
A N
S L
I M
|
TRN
-
NYSE
Trinity Industries Inc
TRANSPORTATION - Railroads
|
$41.56
|
-0.19
-0.46% |
$42.39
|
1,991,455
64.53% of 50 DAV
50 DAV is 3,086,000
|
$47.83
-13.11%
|
4/30/2014
|
$37.79
|
PP = $38.03
|
|
MB = $39.93
|
Most Recent Note - 8/6/2014 6:42:45 PM
G - Gapped down and violated its 50 DMA line ($43.26) raising concerns and triggering a technical sell signal. Only a prompt rebound above the 50 DMA line would help its outlook improve. Reported earnings +91% on +39% sales for the Jun '14 quarter.
>>> FEATURED STOCK ARTICLE : Earnings News Due Following Tuesday's Close - 7/28/2014
View all notes |
Set NEW NOTE alert |
CANSLIM.net Company Profile |
SEC
News |
Chart |
Request a new note
C
A N
S L
I M
|
UA
-
NYSE
Under Armour Inc Cl A
CONSUMER NON-DURABLES - Textile - Apparel Clothing
|
$67.74
|
-0.50
-0.73% |
$68.99
|
1,442,968
51.68% of 50 DAV
50 DAV is 2,792,000
|
$70.94
-4.51%
|
7/10/2014
|
$58.50
|
PP = $60.79
|
|
MB = $63.83
|
Most Recent Note - 8/6/2014 6:48:24 PM
G - Recently reported earnings +0% on +34% sales revenues for the Jun '14 quarter, below the +25% minimum earnings guideline (C criteria), yet the company raised its guidance. Hold its ground stubbornly near all-time highs with no resistance remaining due to overhead supply.
>>> FEATURED STOCK ARTICLE : Bullish Action Despite Latest Earnings Below +25% Minimum Guideline - 7/30/2014
View all notes |
Set NEW NOTE alert |
CANSLIM.net Company Profile |
SEC
News |
Chart |
Request a new note
C
A N
S L
I M
|
Symbol/Exchange
Company Name
Industry Group |
PRICE |
CHANGE
(%Change) |
Day High |
Volume
(% DAV)
(% 50 day avg vol) |
52 Wk Hi
% From Hi |
Featured
Date |
Price
Featured |
Pivot Featured |
|
Max Buy |
WLK
-
NYSE
Westlake Chemical Corp
CHEMICALS - Specialty Chemicals
|
$87.07
|
-0.46
-0.53% |
$88.48
|
460,261
77.62% of 50 DAV
50 DAV is 593,000
|
$91.97
-5.33%
|
4/29/2014
|
$72.79
|
PP = $69.31
|
|
MB = $72.78
|
Most Recent Note - 8/5/2014 12:15:10 PM
G - Reported earnings +11% on +6% sales revenues for the Jun '14 quarter, below the +25% minimum earnings guideline (C criteria), raising fundamental concerns. Gapped down today for a loss with above average volume, testing support at its 50 DMA line ($84.56).
>>> FEATURED STOCK ARTICLE : Extended From Prior Base After Streak of 8 Consecutive Gains - 7/25/2014
View all notes |
Set NEW NOTE alert |
CANSLIM.net Company Profile |
SEC
News |
Chart |
Request a new note
C
A N
S L
I M
|
|
|
|
THESE ARE NOT BUY RECOMMENDATIONS!
Comments contained in the body of this report are technical
opinions only. The material herein has been obtained
from sources believed to be reliable and accurate, however,
its accuracy and completeness cannot be guaranteed.
This site is not an investment advisor, hence it does
not endorse or recommend any securities or other investments.
Any recommendation contained in this report may not
be suitable for all investors and it is not to be deemed
an offer or solicitation on our part with respect to
the purchase or sale of any securities. All trademarks,
service marks and trade names appearing in this report
are the property of their respective owners, and are
likewise used for identification purposes only.
This report is a service available
only to active Paid Premium Members.
You may opt-out of receiving report notifications
at any time. Questions or comments may be submitted
by writing to Premium Membership Services 665 S.E. 10 Street, Suite 201 Deerfield Beach, FL 33441-5634 or by calling 1-800-965-8307
or 954-785-1121.
|
|
|

