You are not logged in.
This means you
CAN ONLY VIEW reports that were published prior to Sunday, February 25, 2024.
You
MUST UPGRADE YOUR MEMBERSHIP if you want to see any current reports.
AFTER MARKET UPDATE - MONDAY, AUGUST 3RD, 2020
Previous After Market Report Next After Market Report >>>
|
|
|
|
DOW |
+236.08 |
26,664.40 |
+0.89% |
|
Volume |
871,512,923 |
-33% |
|
Volume |
4,132,986,400 |
-6% |
|
NASDAQ |
+155.86 |
10,901.13 |
+1.45% |
|
Advancers |
1,885 |
64% |
|
Advancers |
2,226 |
70% |
|
S&P 500 |
+23.49 |
3,294.61 |
+0.72% |
|
Decliners |
1,075 |
36% |
|
Decliners |
934 |
30% |
|
Russell 2000 |
+26.38 |
1,506.80 |
+1.78% |
|
52 Wk Highs |
130 |
|
|
52 Wk Highs |
227 |
|
|
S&P 600 |
+10.81 |
876.19 |
+1.25% |
|
52 Wk Lows |
18 |
|
|
52 Wk Lows |
24 |
|
|
 |
Tech Strength Boosts Nasdaq Composite Index to New Record High
Kenneth J. Gruneisen - Passed the CAN SLIM® Master's Exam
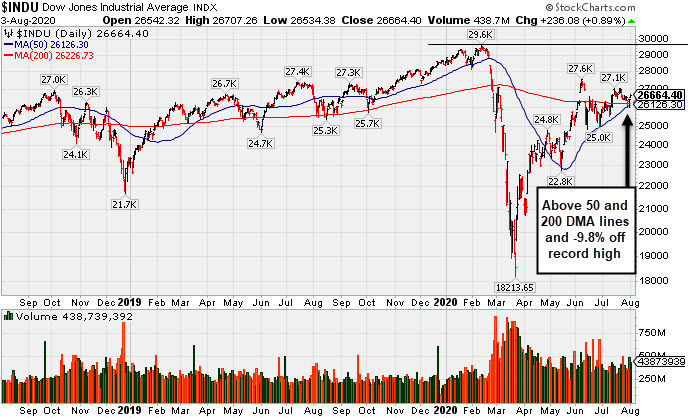
The S&P 500 climbed 0.7%, now within roughly 2.7% of its all-time high reached on February 19. The Nasdaq Composite rallied 1.5% to a new record level, while the Dow added 236 points. The reported volume totals were lighter than the prior session on the NYSE and higher on the Nasdaq exchange. Advancers led declines by a 9-5 margin on the NYSE and more than 2-1 on the Nasdaq exchange. There were 119 high-ranked companies from the Leaders List that hit new 52-week highs and were listed on the BreakOuts Page, versus the total of 70 on the prior session. New 52-week highs totals expanded and solidly outnumbered new 52-week lows totals on both the NYSE and the Nasdaq exchange. The major indices are in a confirmed uptrend (M criteria). Any sustainable rally requires a healthy crop of new leaders, so it remains ever-important to see substantial new highs totals. Charts used courtesy of www.stockcharts.com
PICTURED: The Dow Jones Industrial Average is consolidating above its 50-day and 200-day moving average (DMA) lines and -9.8% off its record high. Stocks finished firmly higher on Monday, as investors digested positive economic updates and a raft of M&A news. Also in focus were continued negotiations between the White House and Congress on a fifth coronavirus relief bill, with President Trump reportedly exploring options for unilateral action if no compromise can be reached.
Technology shares outperformed, with Apple reaching a fresh record high. M&A headlines garnered attention, with Microsoft (MSFT +5.62%) after confirming reports that the Tech titan is in talks to buy social media platform TikTok from Chinese company ByteDance. Meanwhile, ADT (ADT +56.66%) surged after Alphabet (GOOGL -0.35%) bought +6.6% stake in the company in a push to integrate Google Home and Nest devices into the home security firm’s network.
On the data front, a report from the Institute for Supply Management (ISM) showed the U.S. manufacturing sector grew at the fastest rate since March 2019 in July. Overseas, a gauge of manufacturing activity in the eurozone moved into expansionary territory for the first time in 18 months, while a Chinese private survey revealed a similar measure jumped to the highest level since 2011. Treasuries were little changed, with the yield on the 10-year note steady at 0.54%. In commodities, WTI crude added 1.4% to $40.83/barrel despite OPEC and its allies increasing production this month.
|
 Kenneth J. Gruneisen started out as a licensed stockbroker in August 1987, a couple of months prior to the historic stock market crash that took the Dow Jones Industrial Average down -22.6% in a single day. He has published daily fact-based fundamental and technical analysis on high-ranked stocks online for two decades. Through FACTBASEDINVESTING.COM, Kenneth provides educational articles, news, market commentary, and other information regarding proven investment systems that work in good times and bad.
Comments contained in the body of this report are technical opinions only and are not necessarily those of Gruneisen Growth Corp. The material herein has been obtained from sources believed to be reliable and accurate, however, its accuracy and completeness cannot be guaranteed. Our firm, employees, and customers may effect transactions, including transactions contrary to any recommendation herein, or have positions in the securities mentioned herein or options with respect thereto. Any recommendation contained in this report may not be suitable for all investors and it is not to be deemed an offer or solicitation on our part with respect to the purchase or sale of any securities. |
|
 |
Tech Sector, Broker/Dealer, and Oil Services Indexes Rose
Kenneth J. Gruneisen - Passed the CAN SLIM® Master's Exam
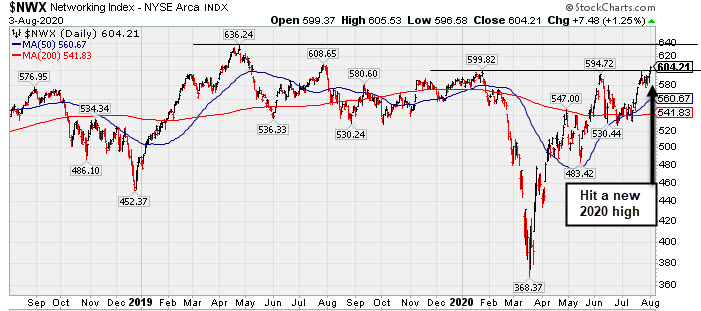
The Broker/Dealer Index ($XBD +1.40%) posted a solid gain while the Bank Index ($BKX -0.03%) finished flat and the Retail Index ($RLX -0.80%) suffered a modest loss. The tech sector had a positive bias as Biotech Index ($BTK +2.65%), Semiconductor Index ($SOX +1.89%), and Networking Index ($NWX +1.25%) posted unanimous gains. The Oil Services Index ($OSX +2.11%) posted a solid gain while the Integrated Oil Index ($XOI -0.21%) edged lower and the Gold & Silver Index ($XAU -1.13%) was a laggard on the mostly positive session.
PICTURED: The Networking Index ($NWX +1.25%) hit a new 2020 high while rallying toward its all-time high.
| Oil Services |
$OSX |
36.36 |
+0.75 |
+2.11% |
-53.56% |
| Integrated Oil |
$XOI |
740.01 |
-1.55 |
-0.21% |
-41.76% |
| Semiconductor |
$SOX |
2,176.84 |
+40.43 |
+1.89% |
+17.69% |
| Networking |
$NWX |
604.21 |
+7.48 |
+1.25% |
+3.57% |
| Broker/Dealer |
$XBD |
282.27 |
+3.91 |
+1.40% |
-2.79% |
| Retail |
$RLX |
3,300.34 |
-26.67 |
-0.80% |
+34.75% |
| Gold & Silver |
$XAU |
152.79 |
-1.74 |
-1.13% |
+42.90% |
| Bank |
$BKX |
74.47 |
-0.02 |
-0.03% |
-34.31% |
| Biotech |
$BTK |
5,807.30 |
+149.82 |
+2.65% |
+14.60% |
|
|
|
 |
Rebounded Above 50-Day Average; Earnings News Due on
Kenneth J. Gruneisen - Passed the CAN SLIM® Master's Exam
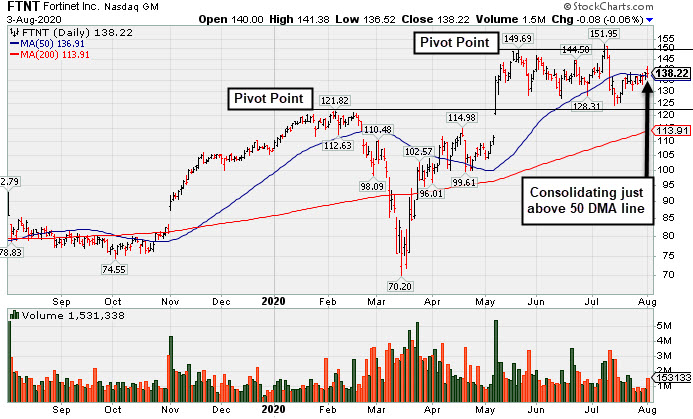
Fortinet Inc (FTNT -$0.08 or -0.06%to $138.22) is due to report earnings news on 8/06/20. Volume and volatility often increase near earnings news. A quiet gain and close back above its 50 DMA line ($136.91) recently helped its outlook to improve following a slump. It still faces some near-term resistance due to overhead supply up to the $151 level. Subsequent gains above the pivot point backed by at least +40% above average volume are needed to trigger a new (or add-on) technical buy signal.
FTNT was last shown in this FSU section on 7/08/20 with an annotated graph under the headline, "Best Ever Close With Volume-Driven Gain Approaching Pivot Point". Bullish action came after reporting earnings +30% on +22% sales revenues for the Mar '20 quarter, its 9th consecutive quarterly comparison with earnings above the +25% minimum guideline (C criteria). Annual earnings (A criteria) have been improving since FY '14, also helping it match with the fact-based investment system's guidelines.
There are 130.9 million shares in the public float (S criteria). The number of top-rated funds owning its shares rose from 960 in Jun '18 to 1,690 in Jun '20, a reassuring sign concerning the I criteria. Its current Up/Down Volume ratio of 1.0 is an unbiased indication its shares have been neutral concerning accumulation/distribution over the past 50 days. It has a Timeliness rating of A and Sponsorship rating of B.
Charts courtesy of www.stockcharts.com
 |
|
|
Color Codes Explained :
Y - Better candidates highlighted by our
staff of experts.
G - Previously featured
in past reports as yellow but may no longer be buyable under the
guidelines.
***Last / Change / Volume data in this table is the closing quote data***
Symbol/Exchange
Company Name
Industry Group |
PRICE |
CHANGE
(%Change) |
Day High |
Volume
(% DAV)
(% 50 day avg vol) |
52 Wk Hi
% From Hi |
Featured
Date |
Price
Featured |
Pivot Featured |
|
Max Buy |
 FTNT
-
NASDAQ
FTNT
-
NASDAQ
Fortinet Inc
Computer Sftwr-Security
|
$138.22
|
-0.08
-0.06% |
$141.39
|
1,530,674
95.25% of 50 DAV
50 DAV is 1,607,000
|
$151.95
-9.04%
|
6/22/2020
|
$142.68
|
PP = $149.79
|
|
MB = $157.28
|
 Most Recent Note - 8/3/2020 5:29:27 PM
Y - Due to report earnings news on 8/06/20. Consolidating just above its 50 DMA line ($137). Faces some near-term resistance due to overhead supply up to the $151 level. See the latest FSU analysis for more details and a new annotated graph.
>>> FEATURED STOCK ARTICLE : Rebounded Above 50-Day Average; Earnings News Due on - 8/3/2020 |
View all notes |
Set NEW NOTE alert |
Company Profile |
SEC
News |
Chart |
Request a new note
C
A
S
I |
CRL
-
NYSE
Charles River Labs Intl
DRUGS - Biotechnology
|
$207.57
|
+8.58
4.31% |
$208.44
|
401,371
105.62% of 50 DAV
50 DAV is 380,000
|
$203.26
2.12%
|
7/15/2020
|
$192.66
|
PP = $189.95
|
|
MB = $199.45
|
Most Recent Note - 8/3/2020 5:37:01 PM
G - Color code is changed to green after rallying well above its "max buy" level and hitting a new all-time high with today's big gain backed by (higher) near average volume. The prior high ($189.85 on 6/03/20) defines initial support to watch above its 50 DMA line ($183.96). Due to report Jun '20 quarterly earnings news before the open on Wednesday, 8/05/20.
>>> FEATURED STOCK ARTICLE : Volume +71% Above Average Behind Breakout - 7/15/2020 |
View all notes |
Set NEW NOTE alert |
Company Profile |
SEC
News |
Chart |
Request a new note
C
A
S
I |
EBS
-
NYSE
Emergent Biosolutions
DRUGS - Biotechnology
|
$118.00
|
+6.76
6.08% |
$119.63
|
1,248,607
131.57% of 50 DAV
50 DAV is 949,000
|
$114.13
3.39%
|
7/7/2020
|
$89.47
|
PP = $93.68
|
|
MB = $98.36
|
Most Recent Note - 8/3/2020 5:31:33 PM
G - Reported Jun '20 quarterly earnings +890% on +62% sales revenue for the Jun '20 quarter versus the year ago period. Hit yet another new all-time high with today's 4th consecutive gain, rallying further above its "max buy" level. Prior highs in the $93 area define initial support above its 50 DMA line ($85.43).
>>> FEATURED STOCK ARTICLE : Impressive Rebound to Hit a New High - 7/9/2020 |
View all notes |
Set NEW NOTE alert |
Company Profile |
SEC
News |
Chart |
Request a new note
C
A
S
I |
NBIX
-
NASDAQ
Neurocrine Biosciences
DRUGS - Biotechnology
|
$123.01
|
+2.65
2.20% |
$124.41
|
758,873
92.21% of 50 DAV
50 DAV is 823,000
|
$136.27
-9.73%
|
5/19/2020
|
$123.71
|
PP = $119.75
|
|
MB = $125.74
|
Most Recent Note - 8/3/2020 5:55:34 PM
G - After the close it today it reported Jun '20 quarterly earnings +100% on +65% sales revenues versus the year ago period. A rebound above the 50 DMA line ($124.41) is still needed for its outlook to improve.
>>> FEATURED STOCK ARTICLE : Consolidating Near 50-Day Moving Average; Earnings Report Due - 7/27/2020 |
View all notes |
Set NEW NOTE alert |
Company Profile |
SEC
News |
Chart |
Request a new note
C
A
S
I |
BMRN
-
NASDAQ
Biomarin Pharmaceutical
DRUGS - Drug Manufacturers - Other
|
$122.04
|
+2.23
1.86% |
$122.47
|
1,071,646
71.92% of 50 DAV
50 DAV is 1,490,000
|
$131.95
-7.51%
|
6/17/2020
|
$110.95
|
PP = $112.67
|
|
MB = $118.30
|
Most Recent Note - 7/29/2020 6:11:01 PM
G - Pulling back from its all-time high and slumping near its "max buy" level with light volume behind recent losses. Due to report earnings news on 8/04/20. Its 50 DMA line ($116.38) defines important near-term support to watch above the prior high ($112.57 on 6/04/20).
>>> FEATURED STOCK ARTICLE : Hovering Near High With Volume Totals Cooling - 7/10/2020 |
View all notes |
Set NEW NOTE alert |
Company Profile |
SEC
News |
Chart |
Request a new note
C
A
S
I |
Symbol/Exchange
Company Name
Industry Group |
PRICE |
CHANGE
(%Change) |
Day High |
Volume
(% DAV)
(% 50 day avg vol) |
52 Wk Hi
% From Hi |
Featured
Date |
Price
Featured |
Pivot Featured |
|
Max Buy |
AUDC
-
NASDAQ
Audiocodes Ltd
ELECTRONICS - Scientific and Technical Instrum
|
$37.12
|
+1.03
2.85% |
$37.40
|
832,801
102.18% of 50 DAV
50 DAV is 815,000
|
$44.94
-17.40%
|
7/17/2020
|
$37.16
|
PP = $40.16
|
|
MB = $42.17
|
Most Recent Note - 8/3/2020 5:41:33 PM
G - Reported Jun '20 quarterly earnings +45% on +8% sales revenues versus the year-ago period. Halted its slide with today's gain backed by average volume after 4 damaging losses. Its slump back below the pivot point and into the prior base raised concerns. Disciplined investors always limit losses by selling any stock that falls more than 7-8% from their purchase price.
>>> FEATURED STOCK ARTICLE : Resilient and High-Ranked VOIP Firm Rebounding Near Highs - 7/17/2020 |
View all notes |
Set NEW NOTE alert |
Company Profile |
SEC
News |
Chart |
Request a new note
C
A
S
I |
AMD
-
NASDAQ
Advanced Micro Devices
ELECTRONICS - Semiconductor - Broad Line
|
$77.67
|
+0.24
0.31% |
$78.50
|
42,507,654
68.49% of 50 DAV
50 DAV is 62,065,000
|
$78.96
-1.63%
|
7/22/2020
|
$61.73
|
PP = $59.10
|
|
MB = $62.06
|
Most Recent Note - 7/30/2020 5:44:13 PM
G - Hit yet another new high with today's volume-driven gain. Reported earnings +125% on +26% sales revenues for the Jun '20 quarter versus the year ago period. Getting very extended from the previously noted base. Disciplined investors avoid chasing stocks more than +5% above prior highs. The prior highs in the $59 area define initial support to watch on pullbacks.
>>> FEATURED STOCK ARTICLE : Pullback After Breakout Gain Backed by +152% Above Average Volume - 7/23/2020 |
View all notes |
Set NEW NOTE alert |
Company Profile |
SEC
News |
Chart |
Request a new note
C
A
S
I |
TREX
-
NYSE
Trex Company Inc
MATERIALS and CONSTRUCTION - General Building Materials
|
$144.50
|
+5.17
3.71% |
$144.96
|
716,340
77.19% of 50 DAV
50 DAV is 928,000
|
$141.09
2.42%
|
6/26/2020
|
$109.05
|
PP = $132.94
|
|
MB = $139.59
|
Most Recent Note - 8/3/2020 6:01:00 PM
G - Hit a new all-time high with today's gain backed by below average volume. After the close it reported Jun '20 quarterly earnings +27% on +7% sales revenues versus the year ago period. Volume and volatility often increase near earnings news. Important near-term support is at its 50 DMA line ($126.56). See the latest FSU analysis for more details and an annotated graph.
>>> FEATURED STOCK ARTICLE : Perched Near All Time High With Earnings News Due Monday - 7/30/2020 |
View all notes |
Set NEW NOTE alert |
Company Profile |
SEC
News |
Chart |
Request a new note
C
A
S
I |
NFLX
-
NASDAQ
Netflix Inc
SPECIALTY RETAIL - Music and Video Stores
|
$498.62
|
+9.74
1.99% |
$503.09
|
5,863,075
74.54% of 50 DAV
50 DAV is 7,866,000
|
$575.37
-13.34%
|
5/14/2020
|
$441.95
|
PP = $449.62
|
|
MB = $472.10
|
Most Recent Note - 7/29/2020 6:06:59 PM
G - Consolidating above its 50 DMA line ($462) and prior highs in the $458 area defining important near-term support. Extended from the prior base, and consolidating after reporting Jun '20 earnings +165% on +25% sales revenues versus the year ago period. See the latest FSU analysis for more details and a new annotated graph.
>>> FEATURED STOCK ARTICLE : Consolidating After Getting Extended From Prior Base - 7/29/2020 |
View all notes |
Set NEW NOTE alert |
Company Profile |
SEC
News |
Chart |
Request a new note
C
A
S
I |
CHGG
-
NYSE
Chegg Inc
Consumer Svcs-Education
|
$85.93
|
+4.96
6.13% |
$87.97
|
8,465,619
254.84% of 50 DAV
50 DAV is 3,322,000
|
$81.03
6.05%
|
6/17/2020
|
$63.71
|
PP = $68.08
|
|
MB = $71.48
|
Most Recent Note - 8/3/2020 12:50:21 PM
G - Gapped up today hitting yet another new all-time high with today's 4th consecutive gain, getting very extended from any sound base. Due to report Jun '20 quarterly results today after the market close. Volume and volatility often increase near earnings news. Prior high in the $68 area defines support to watch coinciding with its 50 DMA line ($67.63) where any losses leading to violations would raise concerns and trigger technical sell signals.
>>> FEATURED STOCK ARTICLE : Negative Reversal After Recently Wedging into New High Territory - 7/13/2020 |
View all notes |
Set NEW NOTE alert |
Company Profile |
SEC
News |
Chart |
Request a new note
C
A
S
I |
Symbol/Exchange
Company Name
Industry Group |
PRICE |
CHANGE
(%Change) |
Day High |
Volume
(% DAV)
(% 50 day avg vol) |
52 Wk Hi
% From Hi |
Featured
Date |
Price
Featured |
Pivot Featured |
|
Max Buy |
LGIH
-
NASDAQ
L G I Homes Inc
Bldg-Resident/Comml
|
$118.21
|
+4.10
3.59% |
$118.96
|
547,957
158.37% of 50 DAV
50 DAV is 346,000
|
$120.54
-1.93%
|
7/7/2020
|
$99.19
|
PP = $95.82
|
|
MB = $100.61
|
Most Recent Note - 8/3/2020 5:58:47 PM
G - Due to report Jun '20 quarterly earnings news before the open on Tuesday, 8/04/20. Posted a gain today with above average for a new best-ever close, getting very extended from the previously noted base. Prior highs in the $95 area and its 50 DMA line ($96.21) define near-term support to watch on pullbacks.
>>> FEATURED STOCK ARTICLE : Earning News Due Next Week for Homebuilder - 7/31/2020 |
View all notes |
Set NEW NOTE alert |
Company Profile |
SEC
News |
Chart |
Request a new note
C
A
S
I |
NOW
-
NYSE
Servicenow Inc
Computer Sftwr-Enterprse
|
$439.96
|
+0.76
0.17% |
$444.79
|
1,799,720
105.43% of 50 DAV
50 DAV is 1,707,000
|
$454.70
-3.24%
|
4/30/2020
|
$343.05
|
PP = $363.05
|
|
MB = $381.20
|
Most Recent Note - 7/30/2020 12:59:48 PM
G - Report Jun '20 quarterly earnings +73% on +28% sales revenues versus the year ago period. Volume and volatility often increase near earnings news. Volume totals have been cooling while hovering near its all-time high, stubbornly holding its ground. It has not formed a sound base. Its 50 DMA line ($405.53) defines important near-term support to watch where a violation may trigger a technical sell signal.
>>> FEATURED STOCK ARTICLE : Perched Near All-Time High With Earnings News Due Next Week - 7/22/2020 |
View all notes |
Set NEW NOTE alert |
Company Profile |
SEC
News |
Chart |
Request a new note
C
A
S
I |
TEAM
-
NASDAQ
Atlassian Corp Plc Cl A
Comp Sftwr-Spec Enterprs
|
$177.95
|
+1.30
0.74% |
$178.87
|
2,909,928
146.67% of 50 DAV
50 DAV is 1,984,000
|
$198.41
-10.31%
|
7/7/2020
|
$190.44
|
PP = $191.82
|
|
MB = $201.41
|
Most Recent Note - 7/31/2020 1:16:38 PM
G - Color code is changed to green after gapping down today and violating its 50 DMA line ($181.13) with a damaging volume-driven loss triggering a technical sell signal. Weak action came after it reported Jun '20 quarterly earnings +25% on +29% sales revenues versus the year ago period. Volume and volatility often increase near earnings news. Recent gains above the pivot point lacked the +40% above average volume necessary to trigger a convincing new (or add-on) technical buy signal. The prior low ($169.11 on 7/14/20) defines the next important support below its 50 DMA line.
>>> FEATURED STOCK ARTICLE : Consolidating Near High With Earnings News Due Soon - 7/24/2020 |
View all notes |
Set NEW NOTE alert |
Company Profile |
SEC
News |
Chart |
Request a new note
C
A
S
I |
TTD
-
NASDAQ
The Trade Desk Inc Cl A
Comml Svcs-Advertising
|
$475.32
|
+24.00
5.32% |
$478.20
|
1,269,190
76.14% of 50 DAV
50 DAV is 1,667,000
|
$475.67
-0.07%
|
6/3/2020
|
$340.61
|
PP = $327.35
|
|
MB = $343.72
|
Most Recent Note - 8/3/2020 5:35:05 PM
G - Due to report earnings news after the close on Thursday, 8/06/20. Posted a big gain today backed by below average volume and hit a new all-time high, getting very extended from any sound base. Its 50 DMA line ($397.62) defines near-term support to watch.
>>> FEATURED STOCK ARTICLE : Rebounded Near All-Time High With Gain Backed by Light Volume - 7/20/2020 |
View all notes |
Set NEW NOTE alert |
Company Profile |
SEC
News |
Chart |
Request a new note
C
A
S
I |
DOCU
-
NASDAQ
Docusign Inc
Computer Sftwr-Enterprse
|
$226.28
|
+9.45
4.36% |
$227.33
|
3,180,129
56.32% of 50 DAV
50 DAV is 5,647,000
|
$217.70
3.94%
|
6/10/2020
|
$149.73
|
PP = $152.10
|
|
MB = $159.71
|
Most Recent Note - 8/3/2020 5:39:40 PM
G - Posted a 6th consecutive gain today with below average volume. Still very extended from any sound base. Its 50 DMA line ($174.49) defines near-term support to watch. DOCU is now priced +114% above its 200 DMA price, and it is taught in the Certification that a stock trading +70-100% or more above the 200 DMA is to be recognized as a "sell signal".
>>> FEATURED STOCK ARTICLE : E-Signature Firm is Extended From Any Sound Base - 7/28/2020 |
View all notes |
Set NEW NOTE alert |
Company Profile |
SEC
News |
Chart |
Request a new note
C
A
S
I |
Symbol/Exchange
Company Name
Industry Group |
PRICE |
CHANGE
(%Change) |
Day High |
Volume
(% DAV)
(% 50 day avg vol) |
52 Wk Hi
% From Hi |
Featured
Date |
Price
Featured |
Pivot Featured |
|
Max Buy |
PING
-
NYSE
Ping Identity Hldg Corp
Computer Sftwr-Security
|
$36.01
|
+1.65
4.80% |
$36.64
|
883,941
63.00% of 50 DAV
50 DAV is 1,403,000
|
$35.79
0.61%
|
6/1/2020
|
$29.24
|
PP = $29.90
|
|
MB = $31.40
|
Most Recent Note - 8/3/2020 5:32:57 PM
G - Posted a solid gain today with light volume for another new all-time high. Its 50 DMA line ($31.51) and prior highs in the $29 area define important near-term support. It has not formed a sound base of sufficient length. Completed Secondary Offerings on 7/09/20 and 5/15/20.
>>> FEATURED STOCK ARTICLE : Consolidating Above 50-Day Moving Average Following Secondary - 7/16/2020 |
View all notes |
Set NEW NOTE alert |
Company Profile |
SEC
News |
Chart |
Request a new note
C
A
S
I |
ZEN
-
NYSE
Zendesk Inc
Computer Sftwr-Enterprse
|
$92.31
|
+1.16
1.27% |
$93.59
|
2,955,669
134.17% of 50 DAV
50 DAV is 2,203,000
|
$101.94
-9.45%
|
7/21/2020
|
$94.29
|
PP = $94.97
|
|
MB = $99.72
|
Most Recent Note - 7/31/2020 1:20:38 PM
Y - Pulling back abruptly today with heavy volume. retreating from a new all-time high hit on the prior session as it challenged it "max buy" level. Weak action came after it reported Jun '20 quarterly earnings +180% on +27% sales revenues versus the year-ago period. Volume and volatility often increase near earnings news.
>>> FEATURED STOCK ARTICLE : Pullback Below Pivot Point Following Breakout Gain - 7/21/2020 |
View all notes |
Set NEW NOTE alert |
Company Profile |
SEC
News |
Chart |
Request a new note
C
A
S
I |
|
|
|
THESE ARE NOT BUY RECOMMENDATIONS!
Comments contained in the body of this report are technical
opinions only. The material herein has been obtained
from sources believed to be reliable and accurate, however,
its accuracy and completeness cannot be guaranteed.
This site is not an investment advisor, hence it does
not endorse or recommend any securities or other investments.
Any recommendation contained in this report may not
be suitable for all investors and it is not to be deemed
an offer or solicitation on our part with respect to
the purchase or sale of any securities. All trademarks,
service marks and trade names appearing in this report
are the property of their respective owners, and are
likewise used for identification purposes only.
This report is a service available
only to active Paid Premium Members.
You may opt-out of receiving report notifications
at any time. Questions or comments may be submitted
by writing to Premium Membership Services 665 S.E. 10 Street, Suite 201 Deerfield Beach, FL 33441-5634 or by calling 1-800-965-8307
or 954-785-1121.
|
|
|