You are not logged in.
This means you
CAN ONLY VIEW reports that were published prior to Monday, April 14, 2025.
You
MUST UPGRADE YOUR MEMBERSHIP if you want to see any current reports.
AFTER MARKET UPDATE - TUESDAY, AUGUST 2ND, 2011
Previous After Market Report Next After Market Report >>>
|
|
|
|
DOW |
-265.87 |
11,866.62 |
-2.19% |
|
Volume |
1,252,178,920 |
+13% |
|
Volume |
2,312,892,130 |
+7% |
|
NASDAQ |
-75.37 |
2,669.24 |
-2.75% |
|
Advancers |
647 |
21% |
|
Advancers |
441 |
16% |
|
S&P 500 |
-32.89 |
1,254.05 |
-2.56% |
|
Decliners |
2,398 |
77% |
|
Decliners |
2,181 |
81% |
|
Russell 2000 |
-25.85 |
767.00 |
-3.26% |
|
52 Wk Highs |
20 |
|
|
52 Wk Highs |
31 |
|
|
S&P 600 |
-12.71 |
414.76 |
-2.97% |
|
52 Wk Lows |
169 |
|
|
52 Wk Lows |
140 |
|
|
 |
Indices Dive And Violate 200-Day Moving Average Lines
Kenneth J. Gruneisen - Passed the CAN SLIM® Master's Exam
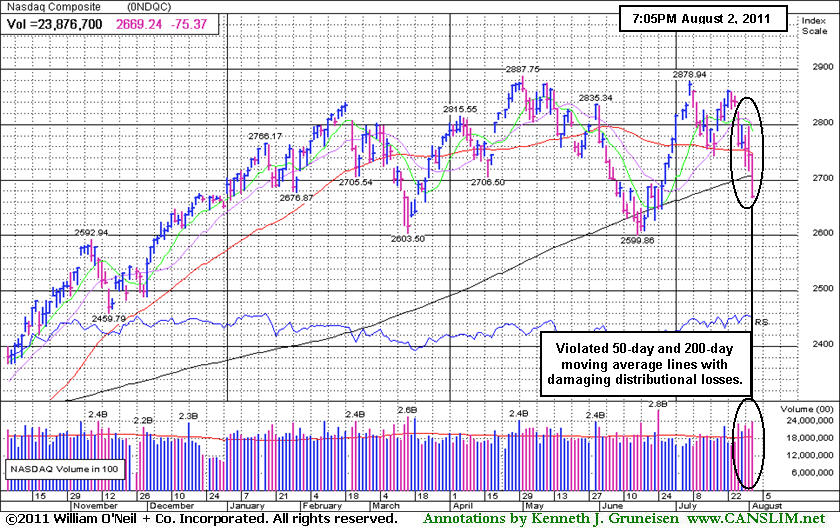
The S&P 500 Index, Dow Jones Industrial Average, and the Nasdaq Composite Index endured damaging losses and they unanimously violated their respective 200-day moving average (DMA) lines on Tuesday. Volume totals were reported higher than the prior session totals on the NYSE and on the Nasdaq exchange, and the weak finish was a clear sign that the institutional crowd was more aggressively dumping stocks. New 52-week lows solidly outnumbered new 52-week highs on the NYSE and on the Nasdaq exchange. Declining issues beat advancers by nearly 4-1 on the NYSE and by nearly 5-1 on the Nasdaq exchange. There were 15 high-ranked companies from the CANSLIM.net Leaders List that made new 52-week highs and appeared on the CANSLIM.net BreakOuts Page, down from the prior total of 20 stocks. There were 5 gainers out of the 19 high-ranked leaders currently included on the Featured Stocks Page.
Pain intensified on Wall Street as the Dow extended its longest losing streak since October 2008, meanwhile the S&P 500 Index completely erased its 2011 advance. President Obama signed his approval on the U.S. debt limit deal, but despite the agreement, worries remain that S&P and Moody's Investors Service will cut the U.S. credit rating. Weak data intensified worries about the economic recovery. Some economists said federal spending cutbacks may contribute to a further slowdown in the economy. The Commerce Department reported that consumers trimmed their spending in June for the first time in almost two years. Incomes rose by the smallest amount since September, reflecting a weak job market.
Earnings reports provided no relief. Coach Inc (COH -6.52%) lost ground as margins declined, cutting into profits. The new General Motors Company (GM -3.63%) reported that July sales beat expectations, but the automaker warned that weakening sentiment may slow deliveries.
Gold closed at a record high $1,644.50 per ounce, as nervous investors sought safety. The 10-year Treasury note was up a full point and the yield sank to 2.61%.
Concerns have been raised by increasing pressure on stocks as indicated by the major averages (M criteria). The prior rally effort has ended and the market correction currently leaves disciplined investors in a defensive stance, watching for a new rally confirmed by a solid follow-through day before new buying efforts may be justified. Financial stocks, considered very important leading indicators, also are continuing to struggle.
The August 2011 issue of CANSLIM.net News will be published soon! Links to all prior reports are available on the Premium Member Homepage.
PICTURED: The Nasdaq Composite Index violated its 50-day and 200-day moving average lines with damaging distributional losses.
|
 Kenneth J. Gruneisen started out as a licensed stockbroker in August 1987, a couple of months prior to the historic stock market crash that took the Dow Jones Industrial Average down -22.6% in a single day. He has published daily fact-based fundamental and technical analysis on high-ranked stocks online for two decades. Through FACTBASEDINVESTING.COM, Kenneth provides educational articles, news, market commentary, and other information regarding proven investment systems that work in good times and bad.
Comments contained in the body of this report are technical opinions only and are not necessarily those of Gruneisen Growth Corp. The material herein has been obtained from sources believed to be reliable and accurate, however, its accuracy and completeness cannot be guaranteed. Our firm, employees, and customers may effect transactions, including transactions contrary to any recommendation herein, or have positions in the securities mentioned herein or options with respect thereto. Any recommendation contained in this report may not be suitable for all investors and it is not to be deemed an offer or solicitation on our part with respect to the purchase or sale of any securities. |
|
 |
Losses Bring Widespread Damage to Most Groups
Kenneth J. Gruneisen - Passed the CAN SLIM® Master's Exam
The Gold & Silver Index ($XAU +0.60%) was a standout gainer in a sea of losses across all other areas on Tuesday. The Retail Index ($RLX -3.76%) fell hard and the Bank Index ($BKX -3.22%) and Broker/Dealer Index ($XBD -2.93%) had a negative influence on the market averages. Energy-related shares faced pressure as the Oil Services Index ($OSX -2.87%) and Integrated Oil Index ($XOI -2.74%) sank. The Healthcare Index ($HMO -2.07%) continued backpedaling. The tech sector saw unanimous losses in the -3% range from the Biotechnology Index ($BTK -3.06%), Semiconductor Index ($SOX -3.04%), Networking Index ($NWX -3.03%), Internet Index ($IIX -2.95%).
Charts courtesy www.stockcharts.com
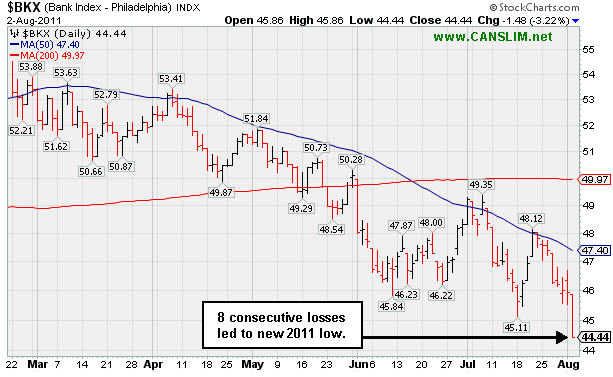
PICTURED: The Bank Index ($BKX -3.22%) streak of 8 consecutive losses led to a new 2011 low.
| Oil Services |
$OSX |
263.58 |
-7.79 |
-2.87% |
+7.53% |
| Healthcare |
$HMO |
2,041.80 |
-43.06 |
-2.07% |
+20.67% |
| Integrated Oil |
$XOI |
1,246.76 |
-35.14 |
-2.74% |
+2.77% |
| Semiconductor |
$SOX |
375.17 |
-11.76 |
-3.04% |
-8.90% |
| Networking |
$NWX |
248.55 |
-7.78 |
-3.03% |
-11.41% |
| Internet |
$IIX |
294.94 |
-8.97 |
-2.95% |
-4.15% |
| Broker/Dealer |
$XBD |
101.88 |
-3.08 |
-2.93% |
-16.16% |
| Retail |
$RLX |
513.89 |
-20.05 |
-3.76% |
+1.08% |
| Gold & Silver |
$XAU |
208.23 |
+1.24 |
+0.60% |
-8.10% |
| Bank |
$BKX |
44.44 |
-1.48 |
-3.22% |
-14.88% |
| Biotech |
$BTK |
1,288.71 |
-40.74 |
-3.06% |
-0.69% |
|
|
|
 |
Finish In Lower Half Of Intra-Day Range Indicates Distribution
Kenneth J. Gruneisen - Passed the CAN SLIM® Master's Exam
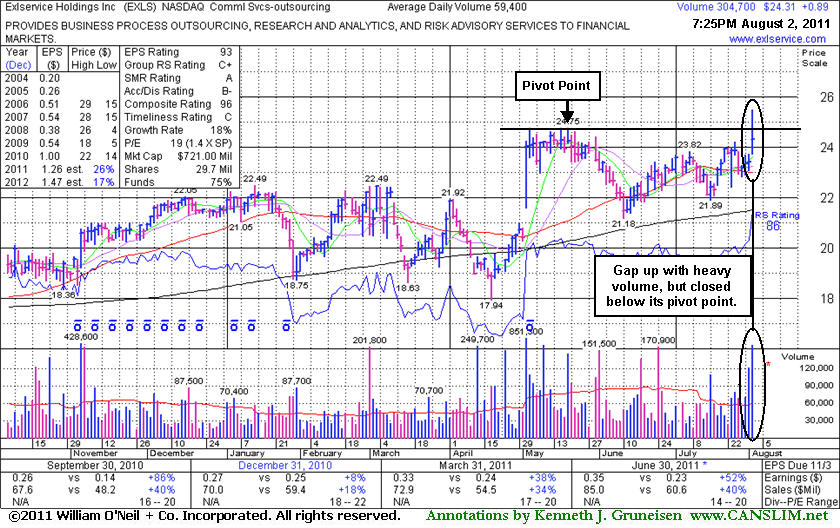
Exlservice Holdings Inc (EXLS +$0.89 or +3.80% to $24.31) finished in the lower half of its intra-day range today and below its pivot point, a sign it was encountering distributional pressure following a considerable gap up gain for a new 52-week high. No resistance remains due to overhead supply. In today's mid-day report its color code was changed to yellow with pivot point cited based on its 5/19/11 high plus 10 cents. A powerful breakout could trigger a technical buy signal, however weak action in the broader market (M criteria) is an overriding concern arguing against new buying efforts until a new rally confirmed with a solid follow-through day occurs.
Reported earnings +52% on +40% sales revenues for the quarter ended June 30, 2011 versus the year ago period. Quarterly comparisons (C criteria) have shown mostly impressive sales and earnings increases. Downturn in its FY '08 earnings was previously noted as a small flaw with respect to the A criteria of the fact-based investment system. Found support near its prior resistance in the $22 area during its consolidation since noted in the 5/12/11 mid-day report.
|
|
|
Color Codes Explained :
Y - Better candidates highlighted by our
staff of experts.
G - Previously featured
in past reports as yellow but may no longer be buyable under the
guidelines.
***Last / Change / Volume data in this table is the closing quote data***
Symbol/Exchange
Company Name
Industry Group |
PRICE |
CHANGE
(%Change) |
Day High |
Volume
(% DAV)
(% 50 day avg vol) |
52 Wk Hi
% From Hi |
Featured
Date |
Price
Featured |
Pivot Featured |
|
Max Buy |
ATHN
-
NASDAQ
Athenahealth Inc
DIVERSIFIED SERVICES - Business/Management Services
|
$59.43
|
+0.05
0.08% |
$61.78
|
903,347
181.72% of 50 DAV
50 DAV is 497,100
|
$60.29
-1.43%
|
7/22/2011
|
$57.30
|
PP = $50.66
|
|
MB = $53.19
|
 Most Recent Note - 8/2/2011 12:14:22 PM
G - Up today, inching to another new all-time high, getting extended from prior highs in the $50 area that define support after its 7/22/11 breakaway gap.
>>> The latest Featured Stock Update with an annotated graph appeared on 7/27/2011. Click here.
View all notes |
Alert me of new notes |
CANSLIM.net Company Profile |
SEC |
Zacks Reports |
StockTalk |
News |
Chart |
Request a new note
C
A N
S L
I M


|
BIDU
-
NASDAQ
Baidu Inc Ads
INTERNET - Internet Information Providers
|
$152.92
|
-6.01
-3.78% |
$160.80
|
7,741,274
86.04% of 50 DAV
50 DAV is 8,996,800
|
$165.96
-7.86%
|
7/26/2011
|
$164.32
|
PP = $156.14
|
|
MB = $163.95
|
Most Recent Note - 8/2/2011 4:26:48 PM
Y - Dipped further below its pivot point today. No resistance remains due to overhead supply after the 7/25/11 "breakaway gap" triggered a technical buy signal, but any subsequent close below its old high close ($152.37 on 4/16/11) would completely negate the breakout and raise more concerns. Weak market (M criteria) environment is currently a concern, since 3 out of 4 stocks tend to go in the direction of the major averages.
>>> The latest Featured Stock Update with an annotated graph appeared on 7/28/2011. Click here.
View all notes |
Alert me of new notes |
CANSLIM.net Company Profile |
SEC |
Zacks Reports |
StockTalk |
News |
Chart |
Request a new note
C
A N
S L
I M
|
CACC
-
NASDAQ
Credit Acceptance Corp
FINANCIAL SERVICES - Credit Services
|
$78.76
|
-1.76
-2.19% |
$82.08
|
84,337
229.80% of 50 DAV
50 DAV is 36,700
|
$86.87
-9.34%
|
6/2/2011
|
$76.10
|
PP = $82.39
|
|
MB = $86.51
|
Most Recent Note - 8/2/2011 4:29:29 PM
G - Reversed early gains today and closed with a loss on above average volume and finished near the session low. Reported earnings +37% on +16% sales revenues for the quarter ended June 30, 2011 versus the year ago period. The next important support level to watch is prior chart lows in the $75 area.
>>> The latest Featured Stock Update with an annotated graph appeared on 6/27/2011. Click here.
View all notes |
Alert me of new notes |
CANSLIM.net Company Profile |
SEC |
Zacks Reports |
StockTalk |
News |
Chart |
Request a new note
C
A N
S L
I M
|
CMG
-
NYSE
Chipotle Mexican Grill
LEISURE - Restaurants
|
$320.65
|
-6.90
-2.11% |
$330.59
|
607,274
76.31% of 50 DAV
50 DAV is 795,800
|
$337.32
-4.94%
|
4/1/2011
|
$274.00
|
PP = $275.10
|
|
MB = $288.86
|
Most Recent Note - 8/2/2011 6:20:18 PM
Still quietly hovering -4.9% off its all-time high, extended from any sound base pattern. Reported earnings per share +12% on +22% sales revenues for the quarter ended June 30, 2011 versus the year ago period, marking its 2nd consecutive quarterly comparison with earnings below the +25% guideline. Due to fundamental concerns it will be dropped from the Featured Stocks list tonight.
>>> The latest Featured Stock Update with an annotated graph appeared on 7/8/2011. Click here.
View all notes |
Alert me of new notes |
CANSLIM.net Company Profile |
SEC |
Zacks Reports |
StockTalk |
News |
Chart |
Request a new note
C
A N
S L
I M
|
EXLS
-
NASDAQ
Exlservice Holdings Inc
DIVERSIFIED SERVICES - Business/Management Services
|
$24.31
|
+0.89
3.80% |
$25.46
|
304,745
513.04% of 50 DAV
50 DAV is 59,400
|
$24.75
-1.78%
|
8/2/2011
|
$24.85
|
PP = $24.85
|
|
MB = $26.09
|
Most Recent Note - 8/2/2011 6:23:35 PM
Y - Finished in the lower half of its intra-day range today and below its pivot point, a sign it was encountering distributional pressure following a considerable gap up gain for a new 52-week high. No resistance remains due to overhead supply. In today's mid-day report its color code was changed to yellow with pivot point cited based on its 5/19/11 high plus 10 cents. Reported earnings +52% on +40% sales revenues for the quarter ended June 30, 2011 versus the year ago period. Quarterly comparisons (C criteria) have shown mostly impressive sales and earnings increases. Downturn in its FY '08 earnings was previously noted as a small flaw with respect to the A criteria of the fact-based investment system. Found support near its prior resistance in the $22 area during its consolidation since noted in the 5/12/11 mid-day report.
There are no Featured Stock Updates™ available for this stock at this time. You may request one by clicking the Request a New Note link below
View all notes |
Alert me of new notes |
CANSLIM.net Company Profile |
SEC |
Zacks Reports |
StockTalk |
News |
Chart |
Request a new note
C
A N
S L
I M
|
Symbol/Exchange
Company Name
Industry Group |
PRICE |
CHANGE
(%Change) |
Day High |
Volume
(% DAV)
(% 50 day avg vol) |
52 Wk Hi
% From Hi |
Featured
Date |
Price
Featured |
Pivot Featured |
|
Max Buy |
EZPW
-
NASDAQ
Ezcorp Inc Cl A
SPECIALTY RETAIL - Specialty Retail, Other
|
$31.97
|
-0.90
-2.74% |
$33.20
|
577,657
112.74% of 50 DAV
50 DAV is 512,400
|
$38.66
-17.30%
|
6/13/2011
|
$31.18
|
PP = $33.41
|
|
MB = $35.08
|
Most Recent Note - 8/2/2011 6:16:27 PM
Its 50 DMA line acted as resistance recently and today it slumped to its lowest close since 6/23/11. Based on weak action it will be dropped from the Featured Stocks list tonight.
>>> The latest Featured Stock Update with an annotated graph appeared on 7/5/2011. Click here.
View all notes |
Alert me of new notes |
CANSLIM.net Company Profile |
SEC |
Zacks Reports |
StockTalk |
News |
Chart |
Request a new note
C
A N
S L
I M
|
FCFS
-
NASDAQ
First Cash Financial Svs
SPECIALTY RETAIL - Specialty Retail, Other
|
$44.34
|
+0.02
0.05% |
$46.42
|
488,828
233.22% of 50 DAV
50 DAV is 209,600
|
$45.47
-2.49%
|
5/31/2011
|
$42.00
|
PP = $40.23
|
|
MB = $42.24
|
Most Recent Note - 8/2/2011 12:35:21 PM
G - Off its earlier high after another gap up today. Getting more extended from its prior base, meanwhile recent chart lows and its 50 DMA line define important near-term support to watch in the $41 area.
>>> The latest Featured Stock Update with an annotated graph appeared on 7/18/2011. Click here.
View all notes |
Alert me of new notes |
CANSLIM.net Company Profile |
SEC |
Zacks Reports |
StockTalk |
News |
Chart |
Request a new note
C
A N
S L
I M
|
FOSL
-
NASDAQ
Fossil Inc
CONSUMER DURABLES - Recreational Goods, Other
|
$122.21
|
-4.53
-3.57% |
$127.82
|
715,440
101.96% of 50 DAV
50 DAV is 701,700
|
$134.98
-9.46%
|
2/1/2011
|
$73.30
|
PP = $74.44
|
|
MB = $78.16
|
Most Recent Note - 8/2/2011 4:31:37 PM
G - Closed near the session low today with a loss on average volume. Retreating from all-time highs and slumping toward its 50 DMA line defining important support.
>>> The latest Featured Stock Update with an annotated graph appeared on 7/21/2011. Click here.
View all notes |
Alert me of new notes |
CANSLIM.net Company Profile |
SEC |
Zacks Reports |
StockTalk |
News |
Chart |
Request a new note
C
A N
S L
I M
|
LULU
-
NASDAQ
Lululemon Athletica
MANUFACTURING - Textile Manufacturing
|
$59.29
|
-2.86
-4.60% |
$62.70
|
2,944,371
71.06% of 50 DAV
50 DAV is 4,143,300
|
$64.49
-8.06%
|
6/21/2011
|
$51.48
|
PP = $50.57
|
|
MB = $53.10
|
Most Recent Note - 8/2/2011 6:11:34 PM
G - Closed near the session low with a loss today on higher but below average volume. It is -8.1% off its all-time high with volume totals generally cooling in recent weeks while extended from a sound base. Its 50 DMA line and prior resistance defining support to watch. A 2:1 split effective 7/12/11 impacted prices (prior Featured Price, Pivot Point, and Max Buy levels were adjusted).
>>> The latest Featured Stock Update with an annotated graph appeared on 7/15/2011. Click here.
View all notes |
Alert me of new notes |
CANSLIM.net Company Profile |
SEC |
Zacks Reports |
StockTalk |
News |
Chart |
Request a new note
C
A N
S L
I M
|
MKTX
-
NASDAQ
Marketaxess Holdings Inc
FINANCIAL SERVICES - Investment Brokerage - Nationa
|
$26.25
|
+0.12
0.46% |
$26.72
|
199,994
123.91% of 50 DAV
50 DAV is 161,400
|
$27.00
-2.78%
|
7/29/2011
|
$25.87
|
PP = $26.35
|
|
MB = $27.67
|
Most Recent Note - 8/1/2011 4:11:12 PM
Y - Posted a small gain today after churning heavy volume and touching a new 52-week high. See the latest FSU analysis for more details and an annotated graph.
>>> The latest Featured Stock Update with an annotated graph appeared on 7/29/2011. Click here.
View all notes |
Alert me of new notes |
CANSLIM.net Company Profile |
SEC |
Zacks Reports |
StockTalk |
News |
Chart |
Request a new note
C
A N
S L
I M
|
Symbol/Exchange
Company Name
Industry Group |
PRICE |
CHANGE
(%Change) |
Day High |
Volume
(% DAV)
(% 50 day avg vol) |
52 Wk Hi
% From Hi |
Featured
Date |
Price
Featured |
Pivot Featured |
|
Max Buy |
MWIV
-
NASDAQ
M W I Veterinary Supply
HEALTH SERVICES - Medical Instruments and; Supplies
|
$85.89
|
-2.42
-2.74% |
$88.52
|
57,302
90.10% of 50 DAV
50 DAV is 63,600
|
$90.24
-4.82%
|
7/11/2011
|
$83.39
|
PP = $84.67
|
|
MB = $88.90
|
Most Recent Note - 8/2/2011 6:13:43 PM
G - Down today on lighter volume. Its 7/29/11 gain was backed by only +26% above average volume, below the threshold to trigger a proper technical buy signal. Reported earnings +23% on +18% sales revenues for the quarter ended June 30, 2011 versus the year ago period. That marks the weakest sales and earnings increases in the span of 6 quarterly comparisons, raising concerns. The sub par earnings increase (below the +25% guideline) coupled with broader market (M criteria) weakness may give investors reasons to avoid new buying efforts.
>>> The latest Featured Stock Update with an annotated graph appeared on 6/30/2011. Click here.
View all notes |
Alert me of new notes |
CANSLIM.net Company Profile |
SEC |
Zacks Reports |
StockTalk |
News |
Chart |
Request a new note
C
A N
S L
I M
|
OTEX
-
NASDAQ
Open Text Corp
INTERNET - Internet Software and Services
|
$62.61
|
-4.56
-6.79% |
$67.22
|
436,438
156.43% of 50 DAV
50 DAV is 279,000
|
$72.32
-13.43%
|
6/1/2011
|
$65.86
|
PP = $67.18
|
|
MB = $70.54
|
Most Recent Note - 8/2/2011 4:11:36 PM
G - Violated support at old highs near $66 and slumped under its 50 DMA line today with a damaging loss on above average volume, triggering a technical sell signal. Color code is changed to green based on worrisome action. It stalled after its 7/13/11 technical buy signal with a negative reversal marking its all-time high.
>>> The latest Featured Stock Update with an annotated graph appeared on 7/20/2011. Click here.
View all notes |
Alert me of new notes |
CANSLIM.net Company Profile |
SEC |
Zacks Reports |
StockTalk |
News |
Chart |
Request a new note
C
A N
S L
I M
|
PCLN
-
NASDAQ
Priceline.Com Inc
INTERNET - Internet Software and Services
|
$518.32
|
-20.54
-3.81% |
$539.15
|
1,209,438
126.59% of 50 DAV
50 DAV is 955,400
|
$561.88
-7.75%
|
7/29/2011
|
$539.46
|
PP = $552.15
|
|
MB = $579.76
|
Most Recent Note - 8/2/2011 4:13:27 PM
Y - Pulled back toward its 50 DMA line with a small loss today, finishing -7.8% off its 52-week high. Color code was changed to yellow with pivot point cited based on its 7/08/11 high. Due to report earnings on August 3rd. Stellar earnings history satisfies the C and A criteria. Found support well above its 200 DMA line during its consolidation since dropped from the Featured Stocks list on 6/15/11. A subsequent breakout could trigger a technical buy signal, but keep in mind that the M criteria may override all other promising criteria, since 3 out of 4 stocks follow the direction of the major averages. See the latest FSU analysis for more details and a new annotated graph.
>>> The latest Featured Stock Update with an annotated graph appeared on 8/1/2011. Click here.
View all notes |
Alert me of new notes |
CANSLIM.net Company Profile |
SEC |
Zacks Reports |
StockTalk |
News |
Chart |
Request a new note
C
A N
S L
I M
|
PRGO
-
NASDAQ
Perrigo Co
DRUGS - Drug Related Products
|
$85.80
|
-3.61
-4.04% |
$89.69
|
871,328
196.42% of 50 DAV
50 DAV is 443,600
|
$94.61
-9.31%
|
7/13/2011
|
$92.89
|
PP = $92.40
|
|
MB = $97.02
|
Most Recent Note - 8/2/2011 4:16:06 PM
G - Today's 5th consecutive loss on heavier volume led to a 50 DMA line violation, triggering a technical sell signal and raising more serious concerns. Color code is changed to green due to weak action after this riskier late-stage setup stalled following a rally to new 52-week highs.
>>> The latest Featured Stock Update with an annotated graph appeared on 7/13/2011. Click here.
View all notes |
Alert me of new notes |
CANSLIM.net Company Profile |
SEC |
Zacks Reports |
StockTalk |
News |
Chart |
Request a new note
C
A N
S L
I M
|
PSMT
-
NASDAQ
Pricesmart Inc
RETAIL - Drug Stores
|
$58.10
|
-2.95
-4.83% |
$61.47
|
216,746
92.67% of 50 DAV
50 DAV is 233,900
|
$62.27
-6.70%
|
7/22/2011
|
$60.04
|
PP = $61.14
|
|
MB = $64.20
|
Most Recent Note - 8/2/2011 4:18:08 PM
Y - A negative bias in the broader market (M criteria) hurts the near-term outlook for all stocks. PSMT did not trigger a proper buy signal after it was featured in yellow in the 7/22/11 mid-day report.
>>> The latest Featured Stock Update with an annotated graph appeared on 7/22/2011. Click here.
View all notes |
Alert me of new notes |
CANSLIM.net Company Profile |
SEC |
Zacks Reports |
StockTalk |
News |
Chart |
Request a new note
C
A N
S L
I M
|
Symbol/Exchange
Company Name
Industry Group |
PRICE |
CHANGE
(%Change) |
Day High |
Volume
(% DAV)
(% 50 day avg vol) |
52 Wk Hi
% From Hi |
Featured
Date |
Price
Featured |
Pivot Featured |
|
Max Buy |
QSII
-
NASDAQ
Quality Systems Inc
COMPUTER SOFTWARE and SERVICES - Healthcare Information Service
|
$88.50
|
-2.21
-2.44% |
$92.29
|
259,575
102.40% of 50 DAV
50 DAV is 253,500
|
$93.64
-5.49%
|
7/6/2011
|
$91.26
|
PP = $91.67
|
|
MB = $96.25
|
Most Recent Note - 8/2/2011 4:19:20 PM
Y - Reversed into the red again today after early gains had it poised for a best-ever close. Reported earnings +55% on +21% sales revenues for the quarter ended June 30, 2011 versus the year ago period. Volume-driven gains and a strong finish for new highs with heavy volume would be a technical buy signal, however the weaker market action (M criteria) of late is arguing against any new buying efforts.
>>> The latest Featured Stock Update with an annotated graph appeared on 7/6/2011. Click here.
View all notes |
Alert me of new notes |
CANSLIM.net Company Profile |
SEC |
Zacks Reports |
StockTalk |
News |
Chart |
Request a new note
C
A N
S L
I M
|
UA
-
NYSE
Under Armour Inc Cl A
CONSUMER NON-DURABLES - Textile - Apparel Clothing
|
$69.18
|
-3.69
-5.06% |
$73.65
|
1,372,749
105.24% of 50 DAV
50 DAV is 1,304,400
|
$82.95
-16.60%
|
7/19/2011
|
$81.33
|
PP = $81.52
|
|
MB = $85.60
|
Most Recent Note - 8/2/2011 4:22:23 PM
Down today on average volume, violating its 50 DMA line and raising concerns. UA did not confirm a proper technical buy signal since recently featured in yellow, and based on its damaging slump to a finish -16.6% off its 52-week high it will be dropped from the Featured Stocks list tonight. Reported earnings +71% on +42% sales revenues for the quarter ended June 30, 2011 versus the year ago period, showing impressive acceleration in sales and earnings increases, sequentially.
>>> The latest Featured Stock Update with an annotated graph appeared on 7/26/2011. Click here.
View all notes |
Alert me of new notes |
CANSLIM.net Company Profile |
SEC |
Zacks Reports |
StockTalk |
News |
Chart |
Request a new note
C
A N
S L
I M
|
ULTA
-
NASDAQ
Ulta Salon Cosm & Frag
SPECIALTY RETAIL - Specialty Retail, Other
|
$61.43
|
-1.80
-2.85% |
$63.89
|
685,462
73.86% of 50 DAV
50 DAV is 928,100
|
$68.80
-10.71%
|
1/6/2011
|
$36.12
|
PP = $37.34
|
|
MB = $39.21
|
Most Recent Note - 8/2/2011 6:27:30 PM
G - Closed near the session low today, consolidating near support at its 50 DMA line. It rallied +200% since first featured in yellow at $22.81 in the 3/12/10 mid-day report.
>>> The latest Featured Stock Update with an annotated graph appeared on 7/14/2011. Click here.
View all notes |
Alert me of new notes |
CANSLIM.net Company Profile |
SEC |
Zacks Reports |
StockTalk |
News |
Chart |
Request a new note
C
A N
S L
I M
|
ZAGG
-
NASDAQ
Zagg Inc
SPECIALTY RETAIL - Specialty Retail, Other
|
$16.10
|
+0.01
0.06% |
$16.65
|
1,005,793
41.10% of 50 DAV
50 DAV is 2,446,900
|
$16.90
-4.73%
|
6/1/2011
|
$10.92
|
PP = $10.59
|
|
MB = $11.12
|
Most Recent Note - 8/1/2011 4:04:28 PM
G - Gapped up today for a gain with below average volume. Extended from a sound base. No overhead supply remains to act as resistance, however its short V shaped consolidation in recent weeks is not recognized as a sound base pattern. Its 50 DMA line and recent lows define chart support.
>>> The latest Featured Stock Update with an annotated graph appeared on 7/19/2011. Click here.
View all notes |
Alert me of new notes |
CANSLIM.net Company Profile |
SEC |
Zacks Reports |
StockTalk |
News |
Chart |
Request a new note
C
A N
S L
I M
|
|
|
|
THESE ARE NOT BUY RECOMMENDATIONS!
Comments contained in the body of this report are technical
opinions only. The material herein has been obtained
from sources believed to be reliable and accurate, however,
its accuracy and completeness cannot be guaranteed.
This site is not an investment advisor, hence it does
not endorse or recommend any securities or other investments.
Any recommendation contained in this report may not
be suitable for all investors and it is not to be deemed
an offer or solicitation on our part with respect to
the purchase or sale of any securities. All trademarks,
service marks and trade names appearing in this report
are the property of their respective owners, and are
likewise used for identification purposes only.
This report is a service available
only to active Paid Premium Members.
You may opt-out of receiving report notifications
at any time. Questions or comments may be submitted
by writing to Premium Membership Services 665 S.E. 10 Street, Suite 201 Deerfield Beach, FL 33441-5634 or by calling 1-800-965-8307
or 954-785-1121.
|
|
|

