You are not logged in.
This means you
CAN ONLY VIEW reports that were published prior to Monday, April 14, 2025.
You
MUST UPGRADE YOUR MEMBERSHIP if you want to see any current reports.
AFTER MARKET UPDATE - MONDAY, JULY 30TH, 2012
Previous After Market Report Next After Market Report >>>
|
|
|
|
DOW |
-2.65 |
13,073.01 |
-0.02% |
|
Volume |
658,570,740 |
-28% |
|
Volume |
1,444,729,360 |
-29% |
|
NASDAQ |
-12.25 |
2,945.84 |
-0.41% |
|
Advancers |
1,473 |
47% |
|
Advancers |
884 |
34% |
|
S&P 500 |
-0.67 |
1,385.30 |
-0.05% |
|
Decliners |
1,560 |
50% |
|
Decliners |
1,587 |
61% |
|
Russell 2000 |
-4.42 |
791.58 |
-0.56% |
|
52 Wk Highs |
182 |
|
|
52 Wk Highs |
63 |
|
|
S&P 600 |
-2.83 |
443.53 |
-0.63% |
|
52 Wk Lows |
17 |
|
|
52 Wk Lows |
45 |
|
|
 |
Major Averages End Lower on Lighter Volume
Kenneth J. Gruneisen - Passed the CAN SLIM® Master's Exam
Stocks gave up minor ground on Monday's volatile trading session. The volume totals were reported much lighter on the NYSE and on the Nasdaq exchange versus the prior session totals. Declining issues led advancing issues by nearly a 2-1 margin on the Nasdaq exchange, but decliners led by only a narrow margin on the NYSE. The total number of new 52-week highs led new 52-week lows on the NYSE, and on the Nasdaq exchange. There were 48 high-ranked companies from the CANSLIM.net Leaders List made new 52-week highs and appeared on the CANSLIM.net BreakOuts Page, down from the prior session total of 68 stocks. The expansion in leadership coupled with the major indices' volume-driven and sizable gains was an encouraging shift concerning the M criteria. There were gains for 6 of the 15 high-ranked companies currently included on the Featured Stocks Page.
Stocks broke a two-day rally as investors turned defensive ahead of the conclusion of the FOMC meeting on Wednesday and the ECB's rate decision on Thursday. Hopes of ECB action helped Italy's borrowing costs fall below 6% for the first time since April. Weak economic data added to the downside as the Dallas Fed manufacturing index dropped in June to its lowest level in almost a year, sinking to a negative 13.2, suggesting slightly slower output growth. However, a meeting between U.S. Treasury Secretary Geithner and Germany's Finance Minister helped ease some concerns as the leaders expressed confidence that the euro zone can overcome its ongoing sovereign debt issues.
Among sectors, telecoms led gainers while financials lagged behind. AT&T Inc (T +0.78%) rose after announcing a stock repurchase program and JP Morgan Chase & Co (JPM -2.03%) fell after an analyst downgrade. Among other news, Apple Inc (AAPL +1.69%) bounced back from last week's decline amid reports that it may unveil new products at an event in September.
Second-quarter earnings reports will also garner attention this week. Anadarko Petroleum Corp (APC +0.48%) and Seagate Technology Plc (STX +1.40%) reported earnings after Monday's close.
In bondland, Treasuries were higher with the 10-year note up 14/32 to yield 1.50% and the 30-year bond gained a full point to yield 2.57%.
In terms of the M criteria, last week's gains brought technical improvements to the major indices' trend coupled with an expansion in leadership (stocks hitting new 52-week highs). Any sustainable rally requires a healthy crop of strong leaders hitting new 52-week highs.
Earnings season has led numerous stocks to experience greater than usual daily volume and greater price volatility which can surprise and frustrate investors. ALWAYS do your best to limit losses by first making only disciplined entries, then quickly limiting losses if any stock ever falls more than -7% from the purchase price.
In August we will begin providing all currently upgraded members access to new monthly webcasts! A new "Market's Leading Groups" archives tab will also soon be added on the Premium Member Homepage. These changes are aimed at satisfying member requests and improving the service. If you have questions, comments or suggestions please let us know via the inquiry form here. The most recent WEBCAST (Q2 2012) is available "ON DEMAND" - CLICK HERE.
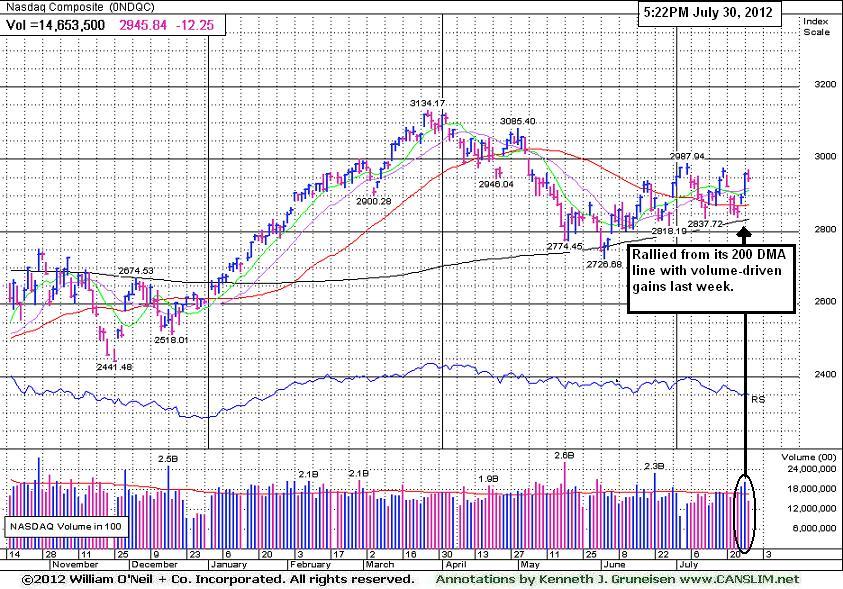
PICTURED: The tech-heavy Nasdaq Composite Index ended Monday's session with a small loss on lighter volume. Last week it rallied from support at its longer-term 200-day moving average (DMA) line with volume-driven gains.
|
 Kenneth J. Gruneisen started out as a licensed stockbroker in August 1987, a couple of months prior to the historic stock market crash that took the Dow Jones Industrial Average down -22.6% in a single day. He has published daily fact-based fundamental and technical analysis on high-ranked stocks online for two decades. Through FACTBASEDINVESTING.COM, Kenneth provides educational articles, news, market commentary, and other information regarding proven investment systems that work in good times and bad.
Comments contained in the body of this report are technical opinions only and are not necessarily those of Gruneisen Growth Corp. The material herein has been obtained from sources believed to be reliable and accurate, however, its accuracy and completeness cannot be guaranteed. Our firm, employees, and customers may effect transactions, including transactions contrary to any recommendation herein, or have positions in the securities mentioned herein or options with respect thereto. Any recommendation contained in this report may not be suitable for all investors and it is not to be deemed an offer or solicitation on our part with respect to the purchase or sale of any securities. |
|
 |
Tech and Financial Groups Led Decliners
Kenneth J. Gruneisen - Passed the CAN SLIM® Master's Exam
The tech sector's weakness led to losses for the Biotechnology Index ($BTK -1.74%), Semiconductor Index ($SOX -0.94%), and the Networking Index ($NWX -0.44%). Losses from the Bank Index ($BKX -0.82%) and Broker/Dealer Index ($XBD -0.63%) also weighed on the major averages. The Retail Index ($RLX -0.15%) did a better job of holding its ground, but the Healthcare Index ($HMO -0.47%) also edged lower. The Oil Services Index ($OSX -1.62%) suffered a loss while the Integrated Oil Index ($XOI +0.32%) eked out a small gain, and the Gold & Silver Index ($XAU +1.33%) was a standout gainer on Monday's mostly negative session.
Charts courtesy www.stockcharts.com
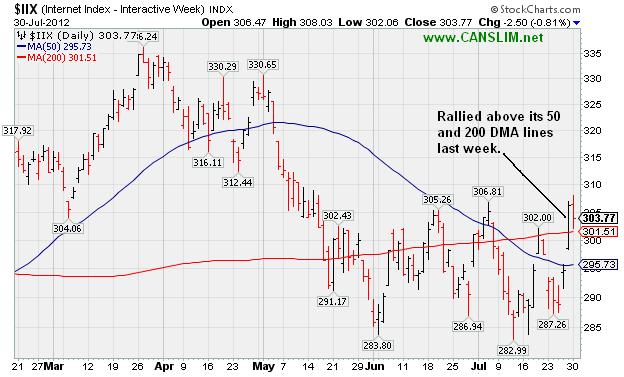
PICTURED: The Internet Index ($IIX -0.81%) pulled back on Monday. It rallied above its 50-day and 200-day moving average (DMA) lines last week.
| Oil Services |
$OSX |
221.50 |
-3.64 |
-1.62% |
+2.41% |
| Healthcare |
$HMO |
2,336.97 |
-11.10 |
-0.47% |
+2.43% |
| Integrated Oil |
$XOI |
1,211.25 |
+3.87 |
+0.32% |
-1.45% |
| Semiconductor |
$SOX |
380.61 |
-3.62 |
-0.94% |
+4.44% |
| Networking |
$NWX |
193.20 |
-0.85 |
-0.44% |
-10.21% |
| Internet |
$IIX |
303.77 |
-2.50 |
-0.81% |
+7.82% |
| Broker/Dealer |
$XBD |
83.12 |
-0.53 |
-0.63% |
-0.18% |
| Retail |
$RLX |
629.51 |
-0.95 |
-0.15% |
+20.32% |
| Gold & Silver |
$XAU |
153.82 |
+2.02 |
+1.33% |
-14.85% |
| Bank |
$BKX |
45.72 |
-0.38 |
-0.82% |
+16.10% |
| Biotech |
$BTK |
1,487.01 |
-26.39 |
-1.74% |
+36.24% |
|
|
|
 |
Pause Following Spurt of Volume-Driven Gains to New Highs
Kenneth J. Gruneisen - Passed the CAN SLIM® Master's Exam
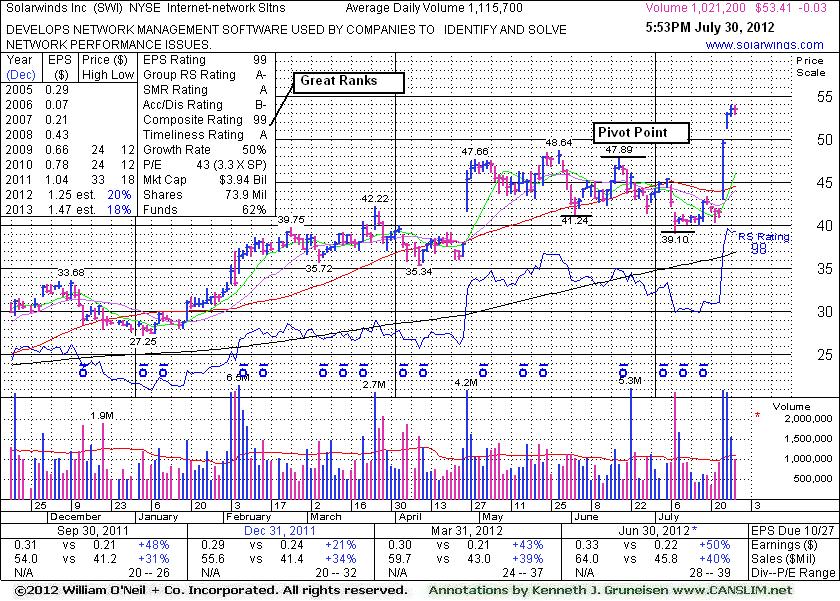
Solarwinds Inc (SWI -$0.03 or -0.06% to $53.41) paused today near its all-time high after 3 consecutive volume-driven gains. No overhead supply remains to act as resistance. It quickly rallied beyond its "max buy" level with above average volume behind last week's gains after reporting earnings +50% on +40% sales revenues for the quarter ended June 30, 2012 versus the year ago period. In 3 of the 4 most current quarterly comparisons its earnings increases were above the +25% guideline meeting the C criteria of the fact-based system. It has a good annual earnings (A criteria) history. The number of top-rated funds owning its shares rose from 346 in Jun '11 to 455 in Jun '12, a reassuring sign concerning the I criteria of the fact-based investment system.
It gapped up and spiked to a new 52-week high on 7/25/12 with a considerable gain backed by 4 times average volume rallying from a "double bottom" base pattern. It was rallying above its 50-day moving average line and on the rise when highlighted in yellow in that day's mid-day report (read here) with new pivot point cited based on its 6/19/12 high. Its last appearance in this FSU section was on 6/15/12 with an annotated graph under the headline, "Secondary Buy Point After Finding Support". However, subsequent damaging violations of its 50-day moving average line and deterioration below the 6/04/11 low ($41.24) had triggered more worrisome technical sell signals. Disciplined investors always limit losses by selling any stock that falls more than -7% from their purchase price. Risk management is crucial to investors' success, meanwhile a stock that is sold can always be bought back again if strength returns.
|
|
|
Color Codes Explained :
Y - Better candidates highlighted by our
staff of experts.
G - Previously featured
in past reports as yellow but may no longer be buyable under the
guidelines.
***Last / Change / Volume data in this table is the closing quote data***
Symbol/Exchange
Company Name
Industry Group |
PRICE |
CHANGE
(%Change) |
Day High |
Volume
(% DAV)
(% 50 day avg vol) |
52 Wk Hi
% From Hi |
Featured
Date |
Price
Featured |
Pivot Featured |
|
Max Buy |
ALXN
-
NASDAQ
Alexion Pharmaceuticals
DRUGS - Drug Manufacturers - Other
|
$104.59
|
-4.38
-4.02% |
$109.90
|
2,138,926
91.99% of 50 DAV
50 DAV is 2,325,200
|
$109.96
-4.88%
|
5/1/2012
|
$91.73
|
PP = $95.11
|
|
MB = $99.87
|
 Most Recent Note - 7/30/2012 3:58:47 PM
G - Down today with below average volume, pulling back near prior highs. Reported earnings +62% on +48% sales revenues for the quarter ended June 30, 2012 versus the year ago period.
>>> The latest Featured Stock Update with an annotated graph appeared on 7/25/2012. Click here.
View all notes |
Alert me of new notes |
CANSLIM.net Company Profile |
SEC |
Zacks Reports |
StockTalk |
News |
Chart |
Request a new note
C
A N
S L
I M


|
ASPS
-
NASDAQ
Altisource Ptf Sltns Sa
REAL ESTATE - Property Management/Developmen
|
$77.49
|
+3.56
4.82% |
$79.20
|
265,165
201.80% of 50 DAV
50 DAV is 131,400
|
$76.40
1.43%
|
6/5/2012
|
$60.01
|
PP = $63.00
|
|
MB = $66.15
|
Most Recent Note - 7/30/2012 11:56:10 AM
G - Hitting a new 52-week high today following a brief consolidation, getting more extended from its prior base. Recent low and its 50 DMA line define near-term support to watch. Reported earnings +117% on +55% sales revenues for the quarter ended June 30, 2012 versus the year ago period.
>>> The latest Featured Stock Update with an annotated graph appeared on 7/3/2012. Click here.
View all notes |
Alert me of new notes |
CANSLIM.net Company Profile |
SEC |
Zacks Reports |
StockTalk |
News |
Chart |
Request a new note
C
A N
S L
I M
|
CFNL
-
NASDAQ
Cardinal Financial Corp
BANKING - Regional - Southeast Banks
|
$12.76
|
-0.21
-1.62% |
$13.04
|
22,525
27.91% of 50 DAV
50 DAV is 80,700
|
$13.21
-3.41%
|
7/20/2012
|
$12.85
|
PP = $12.41
|
|
MB = $13.03
|
Most Recent Note - 7/26/2012 5:05:24 PM
Y - Today was its best volume-driven gain above its pivot point thus far. It encountered distributional pressure after featured in the 7/20/12 mid-day report. See the latest FSU analysis for more details and a new annotated graph.
>>> The latest Featured Stock Update with an annotated graph appeared on 7/26/2012. Click here.
View all notes |
Alert me of new notes |
CANSLIM.net Company Profile |
SEC |
Zacks Reports |
StockTalk |
News |
Chart |
Request a new note
C
A N
S L
I M
|
CMCSA
-
NASDAQ
Comcast Corp Cl A
MEDIA - CATV Systems
|
$32.21
|
-0.08
-0.23% |
$32.56
|
9,696,272
71.95% of 50 DAV
50 DAV is 13,475,700
|
$32.78
-1.74%
|
6/11/2012
|
$29.94
|
PP = $30.98
|
|
MB = $32.53
|
Most Recent Note - 7/25/2012 5:55:05 PM
Y - Volume totals have been quiet or average while recently holding its ground above its pivot point. No overhead supply remains to act as resistance and it is still trading below its "max buy" level.
>>> The latest Featured Stock Update with an annotated graph appeared on 7/11/2012. Click here.
View all notes |
Alert me of new notes |
CANSLIM.net Company Profile |
SEC |
Zacks Reports |
StockTalk |
News |
Chart |
Request a new note
C
A N
S L
I M
|
DG
-
NYSE
Dollar General Corp
RETAIL - Discount, Variety Stores
|
$50.95
|
-0.04
-0.08% |
$51.64
|
3,375,873
83.96% of 50 DAV
50 DAV is 4,020,800
|
$56.04
-9.08%
|
7/16/2012
|
$54.68
|
PP = $56.14
|
|
MB = $58.95
|
Most Recent Note - 7/25/2012 5:57:33 PM
Y - Gapped down today for as loss but rebounded to finish near the session high and closed just above its 50 DMA line after encountering distributional pressure. It did not register volume-driven gains above its new pivot point to trigger a new (or add-on) technical buy signal.
>>> The latest Featured Stock Update with an annotated graph appeared on 7/12/2012. Click here.
View all notes |
Alert me of new notes |
CANSLIM.net Company Profile |
SEC |
Zacks Reports |
StockTalk |
News |
Chart |
Request a new note
C
A N
S L
I M
|
Symbol/Exchange
Company Name
Industry Group |
PRICE |
CHANGE
(%Change) |
Day High |
Volume
(% DAV)
(% 50 day avg vol) |
52 Wk Hi
% From Hi |
Featured
Date |
Price
Featured |
Pivot Featured |
|
Max Buy |
EXPE
-
NASDAQ
Expedia Inc
INTERNET - Internet Information Providers
|
$56.12
|
+1.22
2.22% |
$56.68
|
5,272,213
131.55% of 50 DAV
50 DAV is 4,007,800
|
$58.40
-3.90%
|
4/27/2012
|
$41.80
|
PP = $35.57
|
|
MB = $37.35
|
Most Recent Note - 7/30/2012 12:15:13 PM
G - Holding its ground today following a considerable gap up gain on 7/27/12 for a new 52-week high from below its 50 DMA line. Reported earnings +24% on +14% sales revenues for the quarter ending June 30, 2012 versus the year ago period, just below the +25% minimum earnings guideline for buy candidates.
>>> The latest Featured Stock Update with an annotated graph appeared on 7/10/2012. Click here.
View all notes |
Alert me of new notes |
CANSLIM.net Company Profile |
SEC |
Zacks Reports |
StockTalk |
News |
Chart |
Request a new note
C
A N
S L
I M
|
GNC
-
NYSE
G N C Holdings Inc
RETAIL - Drug Stores
|
$39.27
|
+1.06
2.77% |
$39.31
|
2,404,322
96.09% of 50 DAV
50 DAV is 2,502,100
|
$42.70
-8.03%
|
6/29/2012
|
$39.20
|
PP = $40.00
|
|
MB = $42.00
|
Most Recent Note - 7/30/2012 4:01:34 PM
Y - Color code is changed to yellow again while trading up above its 50 DMA line today. Reported earnings +59% on +19% sales revenues for the quarter ended June 30, 2012 versus the year ago period, beating expectations, and it also raised guidance for FY '12. Disciplined investors always limit losses if any stock falls more than -7% from their purchase price.
>>> The latest Featured Stock Update with an annotated graph appeared on 7/5/2012. Click here.
View all notes |
Alert me of new notes |
CANSLIM.net Company Profile |
SEC |
Zacks Reports |
StockTalk |
News |
Chart |
Request a new note
C
A N
S L
I M
|
GPX
-
NYSE
G P Strategies Corp
DIVERSIFIED SERVICES - Education and Training Services
|
$17.46
|
-0.34
-1.91% |
$18.00
|
30,799
56.31% of 50 DAV
50 DAV is 54,700
|
$18.99
-8.06%
|
6/29/2012
|
$18.01
|
PP = $18.15
|
|
MB = $19.06
|
Most Recent Note - 7/26/2012 3:50:30 PM
Y - Volume totals have been cooling while consolidating above its 50 DMA line. Recent losses completely negated the prior breakout and raised concerns. Disciplined investors always limit losses by selling any stock if it falls more than -7% from their purchase price.
>>> The latest Featured Stock Update with an annotated graph appeared on 7/6/2012. Click here.
View all notes |
Alert me of new notes |
CANSLIM.net Company Profile |
SEC |
Zacks Reports |
StockTalk |
News |
Chart |
Request a new note
C
A N
S L
I M
|
HMSY
-
NASDAQ
H M S Holdings Corp
COMPUTER SOFTWARE and SERVICES - Healthcare Information Service
|
$34.43
|
+0.08
0.23% |
$35.51
|
968,706
98.00% of 50 DAV
50 DAV is 988,500
|
$35.98
-4.31%
|
7/27/2012
|
$33.91
|
PP = $34.83
|
|
MB = $36.57
|
Most Recent Note - 7/27/2012 5:13:32 PM
Y - Reported earnings +35% on +34% sales revenues for the quarter ended June 30, 2012 versus the year ago period. It was highlighted in yellow with new pivot point based on its 7/10/12 high in the mid day report (read here). No resistance remains due to overhead supply. It tried to rally from a 6-month cup-with-handle base pattern but finished below its pivot point today while posting a considerable gain with more than 2 times average volume. Subsequent volume-driven gains above its pivot may trigger a technical buy signal. It went through a deep consolidation below its 200 DMA line then rebounded impressively since dropped from the Featured Stocks list on 3/02/12. See the latest FSU analysis for more details and a new annotated graph.
>>> The latest Featured Stock Update with an annotated graph appeared on 7/27/2012. Click here.
View all notes |
Alert me of new notes |
CANSLIM.net Company Profile |
SEC |
Zacks Reports |
StockTalk |
News |
Chart |
Request a new note
C
A N
S L
I M
|
N
-
NYSE
Netsuite Inc
DIVERSIFIED SERVICES - Business/Management Services
|
$56.22
|
-0.73
-1.28% |
$57.76
|
796,199
128.07% of 50 DAV
50 DAV is 621,700
|
$58.56
-4.00%
|
6/20/2012
|
$51.83
|
PP = $51.88
|
|
MB = $54.47
|
Most Recent Note - 7/27/2012 12:30:25 PM
G - Gapped up and hit a new 52-week high today after finding support at its 50 DMA line. Color code was changed to green after rallying well above its "max buy" level. Reported earnings +200% on +29% sales revenues for the quarter ended June 30, 2012 versus the year ago period.
>>> The latest Featured Stock Update with an annotated graph appeared on 7/19/2012. Click here.
View all notes |
Alert me of new notes |
CANSLIM.net Company Profile |
SEC |
Zacks Reports |
StockTalk |
News |
Chart |
Request a new note
C
A N
S L
I M
|
Symbol/Exchange
Company Name
Industry Group |
PRICE |
CHANGE
(%Change) |
Day High |
Volume
(% DAV)
(% 50 day avg vol) |
52 Wk Hi
% From Hi |
Featured
Date |
Price
Featured |
Pivot Featured |
|
Max Buy |
NSM
-
NYSE
Nationstar Mtg Hldgs Inc
FINANCIAL SERVICES - Credit Services
|
$22.30
|
+0.40
1.83% |
$22.88
|
559,236
68.80% of 50 DAV
50 DAV is 812,900
|
$25.11
-11.19%
|
6/27/2012
|
$20.29
|
PP = $20.46
|
|
MB = $21.48
|
Most Recent Note - 7/27/2012 1:18:45 PM
Y - Color code is changed to yellow while pulling back under its "max buy" level today with a 4th consecutive loss since proposing an Offering of $100 million of Senior Notes. Prior highs and its 50 DMA line in the $20 area define important support to watch on pullbacks.
>>> The latest Featured Stock Update with an annotated graph appeared on 6/27/2012. Click here.
View all notes |
Alert me of new notes |
CANSLIM.net Company Profile |
SEC |
Zacks Reports |
StockTalk |
News |
Chart |
Request a new note
C
A N
S L
I M
|
RNF
-
NYSE
Rentech Nitrogen Ptnr Lp
CHEMICALS - Agricultural Chemicals
|
$30.13
|
+0.53
1.79% |
$31.23
|
644,957
197.36% of 50 DAV
50 DAV is 326,800
|
$31.34
-3.86%
|
7/27/2012
|
$29.58
|
PP = $30.60
|
|
MB = $32.13
|
Most Recent Note - 7/30/2012 12:46:59 PM
Y - Pulling back from earlier highs above its pivot point following a gap up gain today. In the 7/27/12 mid-day report it was highlighted again in yellow with new pivot point cited based upon its 7/17/12 high while noted -"Subsequent volume-driven gains above the pivot may trigger a technical buy signal, meanwhile it is ideal for investors to have on their watchlist. Rebounding toward its 52-week high while working on a cup-with-high handle base pattern. Fundamentals remain strong. Rebounded impressively from a deep consolidation below its 50 DMA line. It was dropped from the Featured Stocks list on 5/10/12 due to damaging technical action."

>>> The latest Featured Stock Update with an annotated graph appeared on 5/2/2012. Click here.
View all notes |
Alert me of new notes |
CANSLIM.net Company Profile |
SEC |
Zacks Reports |
StockTalk |
News |
Chart |
Request a new note
C
A N
S L
I M
|
SWI
-
NYSE
Solarwinds Inc
COMPUTER SOFTWARE and SERVICES - Application Software
|
$53.41
|
-0.03
-0.06% |
$53.95
|
1,026,725
92.03% of 50 DAV
50 DAV is 1,115,700
|
$53.97
-1.04%
|
7/25/2012
|
$47.82
|
PP = $47.89
|
|
MB = $50.28
|
Most Recent Note - 7/30/2012 6:18:32 PM
G - Paused today following 3 consecutive volume-driven gains for new all-time highs. Prior highs in the $48 area define initial support to watch on pullbacks. See the latest FSU analysis for more details and a new annotated graph.
>>> The latest Featured Stock Update with an annotated graph appeared on 7/30/2012. Click here.
View all notes |
Alert me of new notes |
CANSLIM.net Company Profile |
SEC |
Zacks Reports |
StockTalk |
News |
Chart |
Request a new note
C
A N
S L
I M
|
TDG
-
NYSE
Transdigm Group Inc
AEROSPACE/DEFENSE - Aerospace/Defense Products and; Services
|
$120.88
|
-0.75
-0.62% |
$121.72
|
307,164
62.61% of 50 DAV
50 DAV is 490,600
|
$136.34
-11.34%
|
6/18/2012
|
$127.00
|
PP = $132.79
|
|
MB = $139.43
|
Most Recent Note - 7/25/2012 5:51:08 PM
G - Held its ground today following a damaging loss on 7/24/12 with heavy volume that violated its 50 DMA line triggering a technical sell signal.
>>> The latest Featured Stock Update with an annotated graph appeared on 7/18/2012. Click here.
View all notes |
Alert me of new notes |
CANSLIM.net Company Profile |
SEC |
Zacks Reports |
StockTalk |
News |
Chart |
Request a new note
C
A N
S L
I M
|
VSI
-
NYSE
Vitamin Shoppe Inc
SPECIALTY RETAIL - Specialty Retail, Other
|
$57.81
|
-0.60
-1.03% |
$58.55
|
217,508
59.20% of 50 DAV
50 DAV is 367,400
|
$58.88
-1.82%
|
6/29/2012
|
$54.93
|
PP = $55.03
|
|
MB = $57.78
|
Most Recent Note - 7/26/2012 12:50:18 PM
Y - Erased most of today's early gain after touching a new high and briefly trading above its "max buy" level. Found support at its 50 DMA line this week, but any damaging violation would raise concerns and trigger a technical sell signal. Recent gains after forming an 8-week cup-with-handle base lacked the volume required to trigger a proper new (or add-on) technical buy signal.
>>> The latest Featured Stock Update with an annotated graph appeared on 7/2/2012. Click here.
View all notes |
Alert me of new notes |
CANSLIM.net Company Profile |
SEC |
Zacks Reports |
StockTalk |
News |
Chart |
Request a new note
C
A N
S L
I M
|
Symbol/Exchange
Company Name
Industry Group |
PRICE |
CHANGE
(%Change) |
Day High |
Volume
(% DAV)
(% 50 day avg vol) |
52 Wk Hi
% From Hi |
Featured
Date |
Price
Featured |
Pivot Featured |
|
Max Buy |
|
|
|
THESE ARE NOT BUY RECOMMENDATIONS!
Comments contained in the body of this report are technical
opinions only. The material herein has been obtained
from sources believed to be reliable and accurate, however,
its accuracy and completeness cannot be guaranteed.
This site is not an investment advisor, hence it does
not endorse or recommend any securities or other investments.
Any recommendation contained in this report may not
be suitable for all investors and it is not to be deemed
an offer or solicitation on our part with respect to
the purchase or sale of any securities. All trademarks,
service marks and trade names appearing in this report
are the property of their respective owners, and are
likewise used for identification purposes only.
This report is a service available
only to active Paid Premium Members.
You may opt-out of receiving report notifications
at any time. Questions or comments may be submitted
by writing to Premium Membership Services 665 S.E. 10 Street, Suite 201 Deerfield Beach, FL 33441-5634 or by calling 1-800-965-8307
or 954-785-1121.
|
|
|

