You are not logged in.
This means
you CAN ONLY VIEW reports that were published prior to Monday, April 14, 2025.
You
MUST UPGRADE YOUR MEMBERSHIP if you want to see any current reports.
 MIDDAY BREAKOUTS REPORT - FRIDAY, JULY 27TH, 2012 MIDDAY BREAKOUTS REPORT - FRIDAY, JULY 27TH, 2012
Previous Mid Day Report Next Mid Day Report >>>
|
|
DOW 13010.99 123.06 (0.95%) | NASDAQ 2937.18 43.93 (1.52%) | S&P 500 1376.69 16.67 (1.23%)
|
Time of Screening :
7/27/2012 11:47:50 AM Report Released :
7/27/2012 1:07:12 PM
Price is:
Above 52W High and Less Than 52W High
but within 8% of the 52 Week High
Volume Is:
At least 57.5% of 50 Day Average at
the time of the screening.
More details about this report...
At around
mid-way through each trading day we run
a screen against our database of
high-ranked stocks, searching for
possible buy candidates that are trading
at or near their 52-week high on above
average volume. The results of that
screen are split into the two sections
you see below. The first, titled
"TODAY's FEATURED STOCKS" shows stocks
that our experts have recently
identified as among the strongest candidates to
consider. Stocks highlighted in yellow
are the most timely and noteworthy, so
particular attention and prompt action
may be appropriate. The second section,
titled "TODAY's BREAKOUT SCREEN" shows
the remainder of stocks meeting today's
screen parameters. Our experts have
reviewed and included notes on these
stocks as well, but found that they may
not match up as favorably.
|
|
Y - Today's strongest
candidates
highlighted
by our staff
of experts.
|
|
G - Previously featured in
this report as yellow and
now may no longer be buyable
under the guidelines.
|
|
|
Symbol/Exchange
Company Name
Industry Group |
PRICE |
CHANGE
(%Change) |
Day High |
Volume
(% DAV)
(50 DAV) |
52 Wk Hi
% From Hi |
Date
Featured |
Price
Featured |
Pivot Point |
|
Max Buy |
EXPE
- NASDAQ
Expedia Inc
|
$57.04
|
+11.33
24.79%
|
$58.40
|
10,851,536
287.68% of 50 DAV
50 DAV is 3,772,100
|
$58.39
-2.31%
|
4/27/2012 |
$41.80
|
PP = $35.57
MB = $37.35 |
Most Recent Note - 7/27/2012 12:12:55 PM
G - Reported earnings +24% on +14% sales revenues for the quarter ending June 30, 2012 versus the year ago period, just below the +25% minimum earnings guideline for buy candidates. Gapped up today for a new 52-week high with a considerable volume-driven gain from below its 50 DMA line.
>>> The latest Featured Stock Update with an annotated graph appeared on 7/10/2012. Click here.
|
|
View all notes |
Alert me of new notes |
Company Profile |
SEC |
News |
Chart | C
A N
S L
I M
|
HMSY
- NASDAQ
H M S Holdings Corp
|
$33.91
|
+2.34
7.41%
|
$34.43
|
570,455
57.94% of 50 DAV
50 DAV is 984,600
|
$34.98
-3.06%
|
7/27/2012 |
$33.91
|
PP = $34.83
MB = $36.57 |
Most Recent Note - 7/27/2012 12:25:35 PM
Y - Reported earnings +35% on +34% sales revenues for the quarter ended June 30, 2012 versus the year ago period. Color code is changed to yellow with new pivot point based on its 7/10/12 high. Little resistance remains due to overhead supply while it is rallying near its 52-week high after a 6-month cup-with-handle base pattern. A volume-driven gain above its pivot may trigger a technical buy signal. It went through a deep consolidation below its 200 DMA line then rebounded impressively since last noted on 3/02/12 when it was dropped from the Featured Stocks list.
>>> The latest Featured Stock Update with an annotated graph appeared on 3/2/2012. Click here.
|
|
View all notes |
Alert me of new notes |
Company Profile |
SEC |
News |
Chart | C
A N
S L
I M
|
N
- NYSE
Netsuite Inc
|
$56.98
|
+7.56
15.30%
|
$58.00
|
1,239,217
213.25% of 50 DAV
50 DAV is 581,100
|
$58.00
-1.76%
|
6/20/2012 |
$51.83
|
PP = $51.88
MB = $54.47 |
Most Recent Note - 7/27/2012 12:30:25 PM
G - Gapped up and hit a new 52-week high today after finding support at its 50 DMA line. Color code was changed to green after rallying well above its "max buy" level. Reported earnings +200% on +29% sales revenues for the quarter ended June 30, 2012 versus the year ago period.
>>> The latest Featured Stock Update with an annotated graph appeared on 7/19/2012. Click here.
|
|
View all notes |
Alert me of new notes |
Company Profile |
SEC |
News |
Chart | C
A N
S L
I M
|
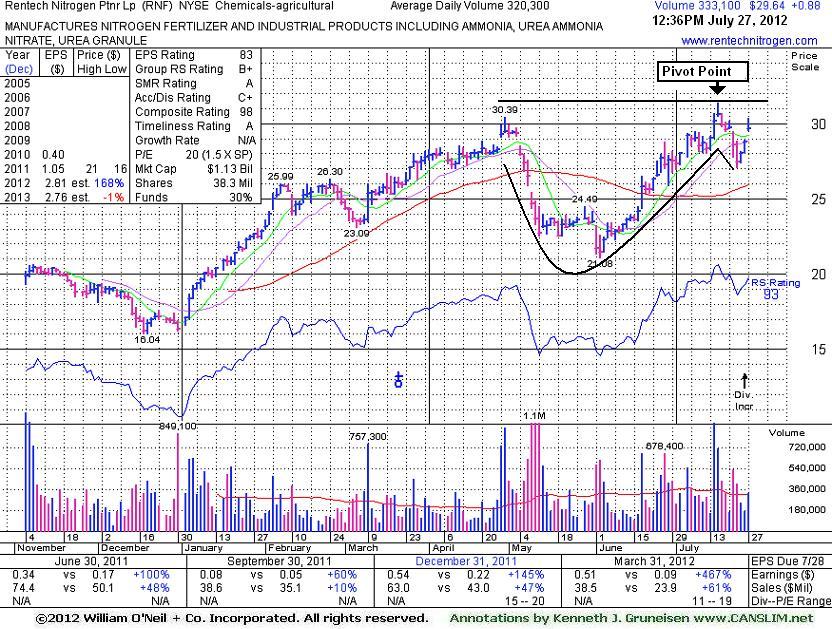
RNF
- NYSE
Rentech Nitrogen Ptnr Lp
|
$29.58
|
+0.82
2.85%
|
$30.34
|
318,742
99.51% of 50 DAV
50 DAV is 320,300
|
$31.34
-5.62%
|
7/27/2012 |
$29.58
|
PP = $30.60
MB = $32.13 |
Most Recent Note - 7/27/2012 12:45:37 PM
Y - Color code is changed to yellow with new pivot point cited based upon its 7/17/12 high. Subsequent volume-driven gains above the pivot may trigger a technical buy signal, meanwhile it is ideal for investors to have on their watchlist. Rebounding toward its 52-week high while working on a cup-with-high handle base pattern. Fundamentals remain strong. Rebounded impressively from a deep consolidation below its 50 DMA line. It was dropped from the Featured Stocks list on 5/10/12 due to damaging technical action.
>>> The latest Featured Stock Update with an annotated graph appeared on 5/2/2012. Click here.
|
|
View all notes |
Alert me of new notes |
Company Profile |
SEC |
News |
Chart | C
A N
S L
I M
|
|
 |
Symbol - Exchange - Industry Group
Company Name |
Last |
Chg |
Day
High |
52 WK Hi |
% From Hi |
Volume
% DAV |
DAV |
ALGN
- NASDAQ - HEALTH SERVICES - Medical Appliances & Equipment
Align Technology Inc
|
$35.84 |
+0.84
2.40%
|
$36.04
|
$36.04
|
-0.55% |
816,995
60.48%
|
1,350,900
|
Most Recent Note for ALGN - 7/27/2012 11:51:29 AM
Hitting a new 52-week high today with a 3rd consecutive gain. Recently rallied back with volume-driven gains after slumping under its 50 DMA line, however the 7/20/12 mid-day report noted - "It has not formed a sound base pattern. Little resistance remains due to overhead supply. Earnings rose +70% on +21% sales revenues for the quarter ended June 30, 2012 versus the year ago period, marking a 3rd consecutive quarterly earnings increase above the +25% minimum guideline (C criteria). Its annual earnings (A criteria) history has been good following a downturn in FY '08. Patient and disciplined investors may watch for a proper base to form while it continues consolidating."
|
|
View all notes |
Alert me of new notes |
Company Profile |
SEC |
News |
Chart | C
A N
S L
I M
|
AMGN
- NASDAQ - DRUGS - Biotechnology
Amgen Inc
|
$82.42 |
+3.13
3.94%
|
$82.50
|
$82.50
|
-0.10% |
6,296,919
131.58%
|
4,785,600
|
Most Recent Note for AMGN - 7/27/2012 11:55:17 AM
Hitting a new 52-week high after gapping up today. It has a slow and steady annual earnings (A criteria) history. The Mar and Jun '12 quarterly comparisons showed sales revenues and earnings acceleration, however it is not a match with the fact-based investment system's fundamental guidelines.
|
|
View all notes |
Alert me of new notes |
Company Profile |
SEC |
News |
Chart | C
A N
S L
I M
|
AWK
- NYSE - Utility-Water Supply
American Water Works Co
|
$36.49 |
+0.57
1.59%
|
$36.61
|
$36.61
|
-0.33% |
445,546
61.50%
|
724,500
|
Most Recent Note for AWK - 7/27/2012 11:57:44 AM
Touched a new 52-week high today, and it has recently been wedging into new high territory with gains lacking great volume conviction. Last noted in the 6/08/12 mid-day report - "This Utility - Water Supply firm has a steady annual earnings (A criteria) history. Lack of sales revenues growth indicates no increase in demand for its products/services even while earnings in the Dec '11 and Mar '12 periods were above the +25% guideline."
|
|
View all notes |
Alert me of new notes |
Company Profile |
SEC |
News |
Chart | C
A N
S L
I M
|
BUD
- NYSE - FOOD & BEVERAGE - Beverages - Brewers
Anheuser-Busch Inbev Adr
|
$80.92 |
+0.91
1.14%
|
$81.69
|
$81.69
|
-0.94% |
1,013,248
57.74%
|
1,754,800
|
Most Recent Note for BUD - 7/27/2012 11:59:48 AM
Wedging into new high territory late this week after consolidating in a tight range since noted on 6/29/12 when a considerable gap up gain for a new 52-week high helped it blast from an 8-week cup shaped base without a handle that included a trip below its 50 DMA line. Prior mid-day reports noted - "Quarterly comparisons have not shown strong and steady sales revenues and earnings increases."
|
|
View all notes |
Alert me of new notes |
Company Profile |
SEC |
News |
Chart | C
A N
S L
I M
|
CAB
- NYSE - SPECIALTY RETAIL - Sporting Goods Stores
Cabelas Inc
|
$44.97 |
+0.06
0.12%
|
$45.85
|
$45.85
|
-1.93% |
647,042
114.50%
|
565,100
|
Most Recent Note for CAB - 7/27/2012 12:04:19 PM
Holding its ground today after a considerable volume-driven gain and strong finish on the prior session for a new 52-week high, rallying above its high hit when noted in the 4/26/12 mid-day report. Reported earnings beating expectations and it gave encouraging guidance. This Retail - Leisure Products firm has earned high ranks, and its annual earnings (A criteria) growth has improved since a slight downturn in FY '08. Quarterly sales revenues have shown sub par increases in the +5-7% range, below the robust revenues growth levels expected under the fact-based investment system.
|
|
View all notes |
Alert me of new notes |
Company Profile |
SEC |
News |
Chart | C
A N
S L
I M
|
CHH
- NYSE - LEISURE - Lodging
Choice Hotels Intl Inc
|
$41.20 |
+2.09
5.34%
|
$41.99
|
$42.29
|
-2.58% |
182,701
138.10%
|
132,300
|
Most Recent Note for CHH - 7/27/2012 12:05:24 PM
Gapped up today, challenging its 52-week high. Earnings history is not a match with the fact-based investment system's guidelines.
|
|
View all notes |
Alert me of new notes |
Company Profile |
SEC |
News |
Chart | C
A N
S L
I M
|
CYNO
- NASDAQ - Medical-Systems/Equip
Cynosure Inc
|
$24.88 |
+0.51
2.09%
|
$24.88
|
$24.88
|
0.00% |
58,251
62.43%
|
93,300
|
Most Recent Note for CYNO - 7/27/2012 12:07:42 PM
Held it ground and continued to rally since gapping up on 7/24/12, technically breaking out of the previously noted cup-with-handle base pattern. Reported earnings of 20 cents per share versus a year ago loss of 1 cent per share while sales revenues were up +50% versus the year ago period ended June 30th. Prior mid-day reports noted - "It survived but failed to impress since dropped from the Featured Stocks list on 11/7/07. Its Dec '11 and Mar '12 quarters showed earnings after years of losses, but while it is an interesting turn around story, the fundamentals are not a match with the fact based system's guidelines."
|
|
View all notes |
Alert me of new notes |
Company Profile |
SEC |
News |
Chart | C
A N
S L
I M
|
DIS
- NYSE - MEDIA - Entertainment - Diversified
Walt Disney Company
|
$49.90 |
+0.19
0.38%
|
$50.04
|
$0.00
|
0.00% |
5,754,312
63.76%
|
9,024,500
|
Most Recent Note for DIS - 7/27/2012 12:10:29 PM
Holding its ground perched at 52-week and multi-year highs since last noted in the 7/17/12 mid-day report - "Reported earnings +18% on +6% sales revenues for the quarter ended March 31, 2012 versus the year ago period. Quarterly and annual earnings (C and A criteria) history has been below guidelines of the fact-based system."
|
|
View all notes |
Alert me of new notes |
Company Profile |
SEC |
News |
Chart | C
A N
S L
I M
|
EGBN
- NASDAQ - BANKING - Regional - Mid-Atlantic Banks
Eagle Bancorp Inc
|
$18.05 |
+0.18
1.01%
|
$18.13
|
$18.13
|
-0.44% |
39,614
79.07%
|
50,100
|
Most Recent Note for EGBN - 7/27/2012 12:12:13 PM
Gains this week helped it reach a new 52-week high. Rebounded from a pullback to its 200 DMA line during its consolidation since noted in the 4/30/12 mid-day report. Reported earnings +54% on +21% sales revenues for the quarter ended June 30, 2012 versus the year ago period. Prior mid-day reports noted - "This Bank holding company with operations in the Northeast has shown strong sales revenues and earnings increases in recent quarterly comparisons, however its annual earnings (A criteria) history has not been strong and steady."
|
|
View all notes |
Alert me of new notes |
Company Profile |
SEC |
News |
Chart | C
A N
S L
I M
|
MED
- NYSE - SPECIALTY RETAIL - Specialty Retail, Other
Medifast Inc
|
$25.49 |
+4.86
23.56%
|
$25.64
|
$26.43
|
-3.56% |
696,955
431.82%
|
161,400
|
Most Recent Note for MED - 7/27/2012 12:29:17 PM
Gapped up today and hit a new 52-week high with a considerable volume-driven gain. It survived but failed to impress since last noted in the 5/13/10 mid-day report. Recent quarterly earnings (C criteria) comparisons have shown sub par earnings growth versus the year ago periods, and its annual earnings (A criteria) history included a downturn in FY '11.
|
|
View all notes |
Alert me of new notes |
Company Profile |
SEC |
News |
Chart | C
A N
S L
I M
|
SAIA
- NASDAQ - TRANSPORTATION - Trucking
Saia Inc
|
$22.57 |
+3.77
20.03%
|
$23.17
|
$23.17
|
-2.61% |
178,162
135.69%
|
131,300
|
Most Recent Note for SAIA - 7/27/2012 12:48:37 PM
Gapped up today from below its 50 DMA line and matched its 52-week high. No resistance remains due to overhead supply. Reported earnings +243% on only +8% sales revenues for the quarter ended June 30, 2012 versus the year ago period. Last noted in the 5/24/12 mid-day report - "Recent quarterly comparisons showed strong earnings increases satisfying the C criteria. Its annual earnings (A criteria) history has been erratic and not a match with the fact-based investment system's guidelines."
|
|
View all notes |
Alert me of new notes |
Company Profile |
SEC |
News |
Chart | C
A N
S L
I M
|
SPSC
- NASDAQ - COMPUTER SOFTWARE & SERVICES - Application Software
S P S Commerce Inc
|
$31.00 |
+2.17
7.53%
|
$31.39
|
$32.97
|
-5.98% |
44,724
73.56%
|
60,800
|
Most Recent Note for SPSC - 7/27/2012 12:53:57 PM
Found support near its 50 DMA line and prior resistance in the $28 area. Volume-driven gains in June helped it technically break out since last noted in the 5/17/12 mid-day report. The 3 most current quarterly comparisons through Jun '12 showed improved sales revenues and earnings increases above the +25% guideline (C criteria). However, a downturn in its FY '11 earnings is a flaw concerning the annual earnings (A criteria) history, making it not a match with the fact-based investment system's guidelines.
|
|
View all notes |
Alert me of new notes |
Company Profile |
SEC |
News |
Chart | C
A N
S L
I M
|
TCBI
- NASDAQ - BANKING - Regional - Southwest Banks
Texas Capital Bancshares
|
$43.22 |
+2.21
5.39%
|
$43.35
|
$43.96
|
-1.68% |
1,237,716
275.29%
|
449,600
|
Most Recent Note for TCBI - 7/27/2012 12:58:06 PM
Hit a new 52-week high today with a considerable volume-driven gain. Reported earnings +73% on +27% sales revenues for the quarter ended June 30, 2012 versus the year ago period. Prior mid-day reports noted - "Recent quarters showed strong earnings increases versus the year earlier that satisfy the C criteria. Its annual earnings (A criteria) history included a downturn in FY '08 & '09 that raised fundamental concerns with respect to the guidelines of the fact-based investment system."
|
|
View all notes |
Alert me of new notes |
Company Profile |
SEC |
News |
Chart | C
A N
S L
I M
|
USNA
- NYSE - DRUGS - Drug Related Products
U S A N A Health Science
|
$44.94 |
+1.02
2.32%
|
$45.01
|
$45.02
|
-0.18% |
93,651
103.71%
|
90,300
|
Most Recent Note for USNA - 7/27/2012 12:59:49 PM
Hitting another new 52-week high today with its 4th consecutive gain, rallying with above average volume. Reported earnings +35% on +8% sales revenues for the quarter ended June 30, 2012 versus the year ago period. Found support near its 50 DMA line since noted in the 5/01/12 mid-day report following a damaging gap down - "This network marketer of dietary supplements, health foods, and skin care products has been showing recent improvement in quarterly comparisons through Mar '12, but fundamentally the C criteria is not satisfied. Its annual earnings (A criteria) growth rate has been improving since a downturn in FY '08."
|
|
View all notes |
Alert me of new notes |
Company Profile |
SEC |
News |
Chart | C
A N
S L
I M
|
VASC
- NASDAQ - HEALTH SERVICES - Medical Instruments & Supplies
Vascular Solutions
|
$13.51 |
+0.27
2.04%
|
$13.64
|
$13.85
|
-2.45% |
33,268
64.60%
|
51,500
|
Most Recent Note for VASC - 7/27/2012 1:01:01 PM
Hovering near 52-week and multi-year highs today after volume-driven gains. The 7/25/12 mid-day report noted - "Fundamentals are still not a match with the fact-based investment system's guidelines. Reported earnings +15% on +11% sales revenues for the Jun '12 quarter. Survived but failed to impress since noted in the 8/08/11 mid-day report - 'Gapped down today, pulling back from its 52-week high hit last week. Annual earnings (A criteria) history has been good. The 2 latest quarterly comparisons versus the year ago period showed sales revenues increases in the +14-17% range with earnings per share increases in the +25-44% range. Ownership by top-rated funds fell from 124 in Dec '10 to 116 in Jun '11, whereas increasing institutional interest (I criteria) is clearly desired.'"
|
|
View all notes |
Alert me of new notes |
Company Profile |
SEC |
News |
Chart | C
A N
S L
I M
|
VRSN
- NASDAQ - INTERNET - Internet Software & Services
Verisign Inc
|
$45.32 |
+2.69
6.30%
|
$45.44
|
$45.65
|
-0.73% |
2,138,870
99.80%
|
2,143,100
|
Most Recent Note for VRSN - 7/27/2012 1:04:50 PM
Hitting a new 52-week high today. Found support near its 50 DMA line recently. Reported earnings +18% on +13% sales revenues for the quarter ended June 30, 2012 versus the year ago period, marking its first quarter with earnings increasing below the +25% minimum guideline in more than 2 years. Prior mid-day reports noted - "Recent quarterly comparisons show strong earnings increases, but its annual earnings (A criteria) history has been up and down and is not a match with the investment system's guidelines."
|
|
View all notes |
Alert me of new notes |
Company Profile |
SEC |
News |
Chart | C
A N
S L
I M
|
WFM
- NASDAQ - RETAIL - Grocery Stores
Whole Foods Market Inc
|
$92.92 |
-1.18
-1.25%
|
$93.65
|
$97.25
|
-4.45% |
1,330,053
62.52%
|
2,127,400
|
Most Recent Note for WFM - 7/27/2012 1:06:47 PM
Holding its ground today while perched -4.5% off its 52-week high. Gapped up on 7/26/12 after reporting earnings +26% on +14% sales revenues for the quarter ended June 30, 2012 versus the year ago period, and the mid-day report noted - "The considerable gain and rebound above its 50 DMA helps its technical stance and outlook improve, however it did not form a sound base pattern since dropped from the Featured Stocks list on 7/20/12. Prior highs up through the $97 level may act as resistance."
|
|
View all notes |
Alert me of new notes |
Company Profile |
SEC |
News |
Chart | C
A N
S L
I M
|
|
|
|
THESE ARE NOT BUY RECOMMENDATIONS!
Comments contained in the body of this report are technical
opinions only. The material herein has been obtained
from sources believed to be reliable and accurate, however,
its accuracy and completeness cannot be guaranteed.
We are not an investment advisor, hence it does
not endorse or recommend any securities or other investments.
Any recommendation contained in this report may not
be suitable for all investors and it is not to be deemed
an offer or solicitation on our part with respect to
the purchase or sale of any securities. All trademarks,
service marks and trade names appearing in this report
are the property of their respective owners, and are
likewise used for identification purposes only.
This report is a service available
only to active Paid Premium Members.
You may opt-out of receiving report notifications
at any time. Questions or comments may be submitted
by writing to FactBasedInvesting.com c/o Premium
Member Services 665 S.E. 10 Street, Suite 201
Deerfield Beach, FL 33441-5634 or by calling 954-785-1121.
We appreciate any feedback
members may wish to send via the inquiry form
here.
|
|
|


