You are not logged in.
This means you
CAN ONLY VIEW reports that were published prior to Wednesday, March 12, 2025.
You
MUST UPGRADE YOUR MEMBERSHIP if you want to see any current reports.
AFTER MARKET UPDATE - FRIDAY, JULY 27TH, 2012
Previous After Market Report Next After Market Report >>>
|
|
|
|
DOW |
+187.73 |
13,075.66 |
+1.46% |
|
Volume |
912,979,450 |
+2% |
|
Volume |
2,035,318,640 |
+8% |
|
NASDAQ |
+64.84 |
2,958.09 |
+2.24% |
|
Advancers |
2,568 |
82% |
|
Advancers |
1,921 |
74% |
|
S&P 500 |
+25.95 |
1,385.97 |
+1.91% |
|
Decliners |
492 |
16% |
|
Decliners |
566 |
22% |
|
Russell 2000 |
+18.89 |
796.00 |
+2.43% |
|
52 Wk Highs |
244 |
|
|
52 Wk Highs |
94 |
|
|
S&P 600 |
+9.97 |
446.32 |
+2.28% |
|
52 Wk Lows |
29 |
|
|
52 Wk Lows |
57 |
|
|
 |
Major Indices Resume Rally With Expansion in Leadership
Kenneth J. Gruneisen - Passed the CAN SLIM® Master's Exam
For the week, the Dow Jones Industrial Average rose +2%, the S&P 500 Index gained +1.7%, and the tech-heavy Nasdaq Composite Index posted a +1.1% gain. On Friday's session the major averages ended with solid gains, and the volume totals behind the gains were reported higher on the NYSE and on the Nasdaq exchange versus the prior session totals. The gains backed by higher volume were an encouraging indication that institutional investors were accumulating shares. Advancing issues led decliners by a 5-1 margin on the NYSE and by nearly 4-1 on the Nasdaq exchange. The total number of new 52-week highs led new 52-week lows on the NYSE, and on the Nasdaq exchange. There were 68 high-ranked companies from the CANSLIM.net Leaders List made new 52-week highs and appeared on the CANSLIM.net BreakOuts Page, up considerably from the prior session total of 36 stocks. The expansion in leadership coupled with the major indices' volume-driven and sizable gains was an encouraging shift concerning the M criteria. There were gains for 13 of the 15 high-ranked companies currently included on the Featured Stocks Page.
A reading on second-quarter GDP showed the economy growing by +1.5%, topping expectations. The University of Michigan sentiment index unexpectedly rose to 72.3 from the prior month's level of 72.
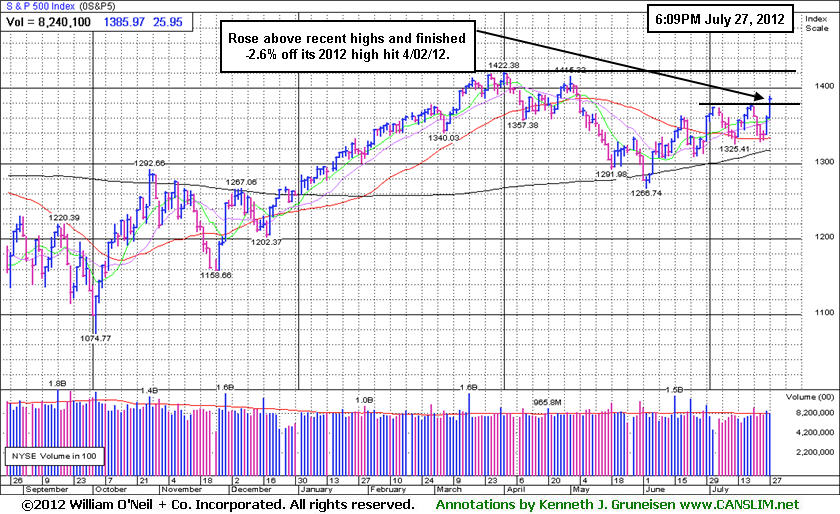
All 10 sectors on the S&P ended Friday's session higher. Healthcare and financial stocks were among the best performers. The Dow Jones Industrial Average ended the week less than -2% off its 2012 high, meanwhile the tech-heavy Nasdaq Composite Index finished -5.6% off its 2012 high. In bondland, Treasuries were lower along the curve with the benchmark 10-year note falling by 7/8 of a point to yield 1.54%.
On the earnings front, Facebook Inc (FB -11.70%) shares sank to a new low and gave investors nothing to like following its disappointing profit tally. Also on the downside, Starbucks Corp (SBUX -9.42%) splashed down below its 200-day moving average (DMA) line after the company posted a weaker-than-expected profit tally and lowered its full year earnings guidance. On the upside, Expedia Inc (EXPE +20.11%), Amazon.com Inc (AMZN +7.87%), and Gilead Sciences Inc (GILD +7.39%) traded up for big gains after the companies topped analysts' expectations in the quarter. In other news, JP Morgan Chase & Co (JPM +3.02%) rose following the bank's announcement of several management changes.
In terms of the M criteria, the week's gains have brought technical improvements to the major indices' trend coupled with an expansion in leadership (stocks hitting new 52-week highs). Any sustainable rally requires a healthy crop of strong leaders hitting new 52-week highs. Recently choppy action had raised concerns and discouraged new buying efforts.
Earnings season has led numerous stocks to experience greater than usual daily volume and greater price volatility which can surprise and frustrate investors. ALWAYS do your best to limit losses by first making only disciplined entries, then quickly limiting losses if any stock ever falls more than -7% from the purchase price.
In August we will begin providing all currently upgraded members access to new monthly webcasts! A new "Market's Leading Groups" archives tab will also soon be added on the Premium Member Homepage. These changes are aimed at satisfying member requests and improving the service. If you have questions, comments or suggestions please let us know via the inquiry form here. The most recent WEBCAST (Q2 2012) is available "ON DEMAND" - CLICK HERE.
PICTURED: The S&P 500 Index rallied above prior highs after finding support near its 50-day moving average (DMA) line and above its 200 DMA line defining an important support well above its June 4th low. It finished the week -2.6% off its 2012 high hit on 4/02/12.
|
 Kenneth J. Gruneisen started out as a licensed stockbroker in August 1987, a couple of months prior to the historic stock market crash that took the Dow Jones Industrial Average down -22.6% in a single day. He has published daily fact-based fundamental and technical analysis on high-ranked stocks online for two decades. Through FACTBASEDINVESTING.COM, Kenneth provides educational articles, news, market commentary, and other information regarding proven investment systems that work in good times and bad.
Comments contained in the body of this report are technical opinions only and are not necessarily those of Gruneisen Growth Corp. The material herein has been obtained from sources believed to be reliable and accurate, however, its accuracy and completeness cannot be guaranteed. Our firm, employees, and customers may effect transactions, including transactions contrary to any recommendation herein, or have positions in the securities mentioned herein or options with respect thereto. Any recommendation contained in this report may not be suitable for all investors and it is not to be deemed an offer or solicitation on our part with respect to the purchase or sale of any securities. |
|
 |
Broad-Based Rally Boosts All Industry Groups
Kenneth J. Gruneisen - Passed the CAN SLIM® Master's Exam
The Retail Index ($RLX +3.27%) was a standout gainer and the influential Bank Index ($BKX +1.54%) and Broker/Dealer Index ($XBD +2.82%) both posted gains that helped underpin the major averages on Friday. The Healthcare Index ($HMO +2.90%) posted a big gain, and the tech sector saw unanimous gains from the Internet Index ($IIX +3.93%), Networking Index ($NWX +2.97%), Semiconductor Index ($SOX +2.31%), and Biotechnology Index ($BTK +1.85%). Commodity-linked groups rounded out the broadly positive session as the Oil Services Index ($OSX +2.67%), Integrated Oil Index ($XOI +1.36%), and the Gold & Silver Index ($XAU +1.21%) rose.
Charts courtesy www.stockcharts.com
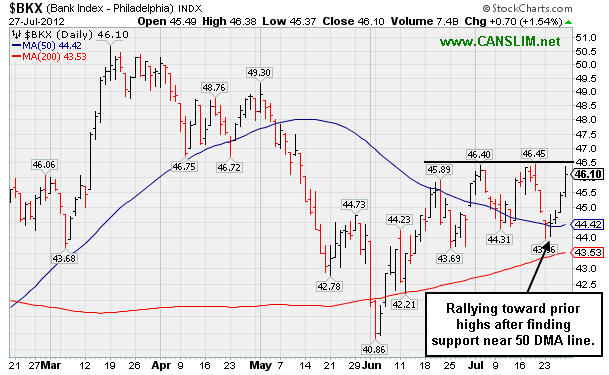
PICTURED: The Bank Index ($BKX +1.54%) is rallying toward prior highs after finding support near its 50-day moving average line.
| Oil Services |
$OSX |
225.14 |
+5.85 |
+2.67% |
+4.10% |
| Healthcare |
$HMO |
2,348.07 |
+66.20 |
+2.90% |
+2.91% |
| Integrated Oil |
$XOI |
1,207.38 |
+16.24 |
+1.36% |
-1.77% |
| Semiconductor |
$SOX |
384.23 |
+8.69 |
+2.31% |
+5.43% |
| Networking |
$NWX |
194.04 |
+5.60 |
+2.97% |
-9.82% |
| Internet |
$IIX |
306.27 |
+11.58 |
+3.93% |
+8.71% |
| Broker/Dealer |
$XBD |
83.65 |
+2.30 |
+2.82% |
+0.46% |
| Retail |
$RLX |
630.98 |
+19.96 |
+3.27% |
+20.60% |
| Gold & Silver |
$XAU |
151.80 |
+1.82 |
+1.21% |
-15.97% |
| Bank |
$BKX |
46.10 |
+0.70 |
+1.54% |
+17.06% |
| Biotech |
$BTK |
1,513.40 |
+27.55 |
+1.85% |
+38.66% |
|
|
|
 |
Touched New 52-Week High After 6-Month Cup With Handle Base
Kenneth J. Gruneisen - Passed the CAN SLIM® Master's Exam
Often, when a leading stock is setting up to breakout of a solid base it is highlighted in CANSLIM.net's Mid-Day Breakouts Report. The most relevant factors are noted in the report which alerts prudent CANSLIM oriented investors to place the issue in their watch list. After doing any necessary backup research, the investor is prepared to act after the stock triggers a technical buy signal (breaks above its pivot point on more than +50% average turnover) but before it gets too extended from a sound base. In the event the stock fails to trigger a technical buy signal and its price declines then it will simply be removed from the watch list. Disciplined investors know to buy as near as possible to the pivot point and avoid chasing stocks after they have rallied more than +5% above their pivot point. It is crucial to always limit losses whenever any stock heads the wrong direction, and disciplined investors sell if a struggling stock ever falls more than -7% from their purchase price.
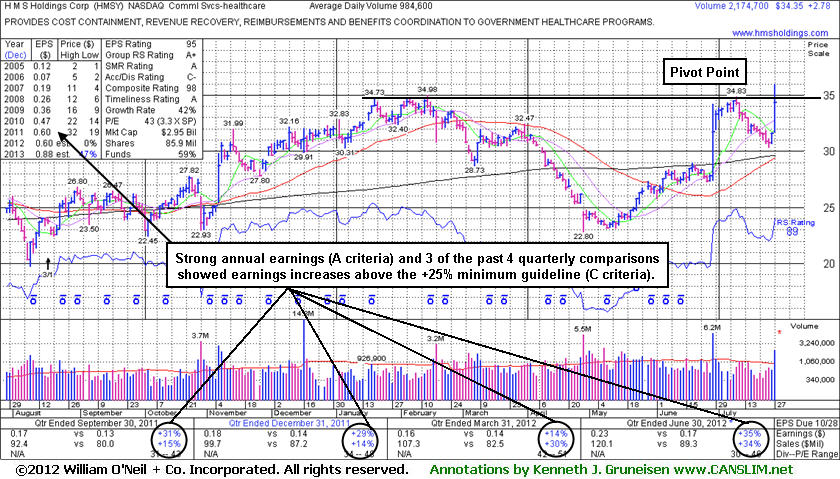
H M S Holdings Corp's (HMSY +$2.78 or +8.81% to $34.35) reported earnings +35% on +34% sales revenues for the quarter ended June 30, 2012 versus the year ago period. It was highlighted in yellow with new pivot point based on its 7/10/12 high in the earlier mid-day report (read here). No resistance remains due to overhead supply. It hit a new 52-week high while trying to rally from a 6-month cup-with-handle base pattern, but it finished today's session below its pivot point. Subsequent volume-driven gains above its pivot may trigger a technical buy signal. Its ongoing success largely hinges largely upon the broader market's ability to reconfirm and then sustain a meaningful rally, however, as the M criteria reminds investors that 3 out of 4 stocks generally move in the same direction as the major averages.
It last appearance in this FSU section was on 3/02/12 under the headline, "Dropping From Featured Stocks List After Damaging Losses". Then it had failed to find support at its 50-day moving average (DMA) line and its Accumulation/Distribution Rating had slumped to a worst possible E rating. It went on to deeply undercut its 200 DMA line before making an impressive rebound in recent months. This Commercial Services - Healthcare firm's annual earnings (A criteria) growth has been strong, and it has reported earnings above the +25% minimum guideline in 3 of the past 4 quarterly comparisons through Jun '12. Sales revenues growth was stronger in the 2 most recent comparisons, sequentially accelerating. The number of top-rated funds owning its shares rose from 453 in Sep '11 to 506 in Jun '12, a reassuring sign concerning the I criteria.
|
|
|
Color Codes Explained :
Y - Better candidates highlighted by our
staff of experts.
G - Previously featured
in past reports as yellow but may no longer be buyable under the
guidelines.
***Last / Change / Volume data in this table is the closing quote data***
Symbol/Exchange
Company Name
Industry Group |
PRICE |
CHANGE
(%Change) |
Day High |
Volume
(% DAV)
(% 50 day avg vol) |
52 Wk Hi
% From Hi |
Featured
Date |
Price
Featured |
Pivot Featured |
|
Max Buy |
ALXN
-
NASDAQ
Alexion Pharmaceuticals
DRUGS - Drug Manufacturers - Other
|
$108.97
|
+2.83
2.67% |
$109.96
|
2,024,507
87.45% of 50 DAV
50 DAV is 2,315,000
|
$108.87
0.09%
|
5/1/2012
|
$91.73
|
PP = $95.11
|
|
MB = $99.87
|
Most Recent Note - 7/25/2012 5:00:17 PM
G - Finished near the session high with a considerable gain backed by +40% above average volume. Color code is changed to green after rallying well above its "max buy"level. Reported earnings +62% on +48% sales revenues for the quarter ended June 30, 2012 versus the year ago period. Found support near its 50 DMA line and prior resistance in the $95 area. See the latest FSU analysis for more details and a new annotated graph.
>>> The latest Featured Stock Update with an annotated graph appeared on 7/25/2012. Click here.
View all notes |
Alert me of new notes |
CANSLIM.net Company Profile |
SEC |
Zacks Reports |
StockTalk |
News |
Chart |
Request a new note
C
A N
S L
I M


|
ASPS
-
NASDAQ
Altisource Ptf Sltns Sa
REAL ESTATE - Property Management/Developmen
|
$73.93
|
+1.13
1.55% |
$74.09
|
120,248
92.21% of 50 DAV
50 DAV is 130,400
|
$76.40
-3.23%
|
6/5/2012
|
$60.01
|
PP = $63.00
|
|
MB = $66.15
|
Most Recent Note - 7/26/2012 3:44:52 PM
G - Down today with above average volume. It is extended from its prior base, and its recent low and its 50 DMA line define near-term support to watch. Reported earnings +117% on +55% sales revenues for the quarter ended June 30, 2012 versus the year ago period.
>>> The latest Featured Stock Update with an annotated graph appeared on 7/3/2012. Click here.
View all notes |
Alert me of new notes |
CANSLIM.net Company Profile |
SEC |
Zacks Reports |
StockTalk |
News |
Chart |
Request a new note
C
A N
S L
I M
|
CFNL
-
NASDAQ
Cardinal Financial Corp
BANKING - Regional - Southeast Banks
|
$12.97
|
+0.29
2.29% |
$13.07
|
69,884
87.25% of 50 DAV
50 DAV is 80,100
|
$13.21
-1.82%
|
7/20/2012
|
$12.85
|
PP = $12.41
|
|
MB = $13.03
|
Most Recent Note - 7/26/2012 5:05:24 PM
Y - Today was its best volume-driven gain above its pivot point thus far. It encountered distributional pressure after featured in the 7/20/12 mid-day report. See the latest FSU analysis for more details and a new annotated graph.
>>> The latest Featured Stock Update with an annotated graph appeared on 7/26/2012. Click here.
View all notes |
Alert me of new notes |
CANSLIM.net Company Profile |
SEC |
Zacks Reports |
StockTalk |
News |
Chart |
Request a new note
C
A N
S L
I M
|
CMCSA
-
NASDAQ
Comcast Corp Cl A
MEDIA - CATV Systems
|
$32.29
|
+0.68
2.15% |
$32.36
|
15,093,998
112.63% of 50 DAV
50 DAV is 13,401,700
|
$32.78
-1.51%
|
6/11/2012
|
$29.94
|
PP = $30.98
|
|
MB = $32.53
|
Most Recent Note - 7/25/2012 5:55:05 PM
Y - Volume totals have been quiet or average while recently holding its ground above its pivot point. No overhead supply remains to act as resistance and it is still trading below its "max buy" level.
>>> The latest Featured Stock Update with an annotated graph appeared on 7/11/2012. Click here.
View all notes |
Alert me of new notes |
CANSLIM.net Company Profile |
SEC |
Zacks Reports |
StockTalk |
News |
Chart |
Request a new note
C
A N
S L
I M
|
DG
-
NYSE
Dollar General Corp
RETAIL - Discount, Variety Stores
|
$50.99
|
-0.29
-0.57% |
$51.58
|
3,411,357
85.30% of 50 DAV
50 DAV is 3,999,200
|
$56.04
-9.01%
|
7/16/2012
|
$54.68
|
PP = $56.14
|
|
MB = $58.95
|
Most Recent Note - 7/25/2012 5:57:33 PM
Y - Gapped down today for as loss but rebounded to finish near the session high and closed just above its 50 DMA line after encountering distributional pressure. It did not register volume-driven gains above its new pivot point to trigger a new (or add-on) technical buy signal.
>>> The latest Featured Stock Update with an annotated graph appeared on 7/12/2012. Click here.
View all notes |
Alert me of new notes |
CANSLIM.net Company Profile |
SEC |
Zacks Reports |
StockTalk |
News |
Chart |
Request a new note
C
A N
S L
I M
|
Symbol/Exchange
Company Name
Industry Group |
PRICE |
CHANGE
(%Change) |
Day High |
Volume
(% DAV)
(% 50 day avg vol) |
52 Wk Hi
% From Hi |
Featured
Date |
Price
Featured |
Pivot Featured |
|
Max Buy |
EXPE
-
NASDAQ
Expedia Inc
INTERNET - Internet Information Providers
|
$54.90
|
+9.19
20.11% |
$58.40
|
17,453,750
462.71% of 50 DAV
50 DAV is 3,772,100
|
$50.66
8.37%
|
4/27/2012
|
$41.80
|
PP = $35.57
|
|
MB = $37.35
|
 Most Recent Note - 7/27/2012 12:12:55 PM
G - Reported earnings +24% on +14% sales revenues for the quarter ending June 30, 2012 versus the year ago period, just below the +25% minimum earnings guideline for buy candidates. Gapped up today for a new 52-week high with a considerable volume-driven gain from below its 50 DMA line.
>>> The latest Featured Stock Update with an annotated graph appeared on 7/10/2012. Click here.
View all notes |
Alert me of new notes |
CANSLIM.net Company Profile |
SEC |
Zacks Reports |
StockTalk |
News |
Chart |
Request a new note
C
A N
S L
I M
|
GNC
-
NYSE
G N C Holdings Inc
RETAIL - Drug Stores
|
$38.21
|
+1.10
2.96% |
$38.79
|
2,976,507
120.79% of 50 DAV
50 DAV is 2,464,100
|
$42.70
-10.52%
|
6/29/2012
|
$39.20
|
PP = $40.00
|
|
MB = $42.00
|
Most Recent Note - 7/26/2012 11:44:25 AM
G - Trading in a wide range today after it reported earnings that beat expectations and raised guidance for FY '12. Now consolidating under its 50 DMA line which may act as a resistance level. Disciplined investors always limit losses if any stock falls more than -7% from their purchase price.
>>> The latest Featured Stock Update with an annotated graph appeared on 7/5/2012. Click here.
View all notes |
Alert me of new notes |
CANSLIM.net Company Profile |
SEC |
Zacks Reports |
StockTalk |
News |
Chart |
Request a new note
C
A N
S L
I M
|
GPX
-
NYSE
G P Strategies Corp
DIVERSIFIED SERVICES - Education and Training Services
|
$17.80
|
+0.62
3.61% |
$17.93
|
27,058
47.64% of 50 DAV
50 DAV is 56,800
|
$18.99
-6.27%
|
6/29/2012
|
$18.01
|
PP = $18.15
|
|
MB = $19.06
|
Most Recent Note - 7/26/2012 3:50:30 PM
Y - Volume totals have been cooling while consolidating above its 50 DMA line. Recent losses completely negated the prior breakout and raised concerns. Disciplined investors always limit losses by selling any stock if it falls more than -7% from their purchase price.
>>> The latest Featured Stock Update with an annotated graph appeared on 7/6/2012. Click here.
View all notes |
Alert me of new notes |
CANSLIM.net Company Profile |
SEC |
Zacks Reports |
StockTalk |
News |
Chart |
Request a new note
C
A N
S L
I M
|
HMSY
-
NASDAQ
H M S Holdings Corp
COMPUTER SOFTWARE and SERVICES - Healthcare Information Service
|
$34.35
|
+2.78
8.81% |
$35.98
|
2,178,564
221.26% of 50 DAV
50 DAV is 984,600
|
$34.98
-1.79%
|
7/27/2012
|
$33.91
|
PP = $34.83
|
|
MB = $36.57
|
Most Recent Note - 7/27/2012 5:13:32 PM
Y - Reported earnings +35% on +34% sales revenues for the quarter ended June 30, 2012 versus the year ago period. It was highlighted in yellow with new pivot point based on its 7/10/12 high in the mid day report (read here). No resistance remains due to overhead supply. It tried to rally from a 6-month cup-with-handle base pattern but finished below its pivot point today while posting a considerable gain with more than 2 times average volume. Subsequent volume-driven gains above its pivot may trigger a technical buy signal. It went through a deep consolidation below its 200 DMA line then rebounded impressively since dropped from the Featured Stocks list on 3/02/12. See the latest FSU analysis for more details and a new annotated graph.
>>> The latest Featured Stock Update with an annotated graph appeared on 7/27/2012. Click here.
View all notes |
Alert me of new notes |
CANSLIM.net Company Profile |
SEC |
Zacks Reports |
StockTalk |
News |
Chart |
Request a new note
C
A N
S L
I M
|
N
-
NYSE
Netsuite Inc
DIVERSIFIED SERVICES - Business/Management Services
|
$56.95
|
+7.53
15.24% |
$58.56
|
2,422,487
416.88% of 50 DAV
50 DAV is 581,100
|
$56.06
1.59%
|
6/20/2012
|
$51.83
|
PP = $51.88
|
|
MB = $54.47
|
Most Recent Note - 7/27/2012 12:30:25 PM
G - Gapped up and hit a new 52-week high today after finding support at its 50 DMA line. Color code was changed to green after rallying well above its "max buy" level. Reported earnings +200% on +29% sales revenues for the quarter ended June 30, 2012 versus the year ago period.
>>> The latest Featured Stock Update with an annotated graph appeared on 7/19/2012. Click here.
View all notes |
Alert me of new notes |
CANSLIM.net Company Profile |
SEC |
Zacks Reports |
StockTalk |
News |
Chart |
Request a new note
C
A N
S L
I M
|
Symbol/Exchange
Company Name
Industry Group |
PRICE |
CHANGE
(%Change) |
Day High |
Volume
(% DAV)
(% 50 day avg vol) |
52 Wk Hi
% From Hi |
Featured
Date |
Price
Featured |
Pivot Featured |
|
Max Buy |
NSM
-
NYSE
Nationstar Mtg Hldgs Inc
FINANCIAL SERVICES - Credit Services
|
$21.90
|
+0.00
0.00% |
$22.08
|
1,295,313
160.57% of 50 DAV
50 DAV is 806,700
|
$25.11
-12.78%
|
6/27/2012
|
$20.29
|
PP = $20.46
|
|
MB = $21.48
|
Most Recent Note - 7/27/2012 1:18:45 PM
Y - Color code is changed to yellow while pulling back under its "max buy" level today with a 4th consecutive loss since proposing an Offering of $100 million of Senior Notes. Prior highs and its 50 DMA line in the $20 area define important support to watch on pullbacks.
>>> The latest Featured Stock Update with an annotated graph appeared on 6/27/2012. Click here.
View all notes |
Alert me of new notes |
CANSLIM.net Company Profile |
SEC |
Zacks Reports |
StockTalk |
News |
Chart |
Request a new note
C
A N
S L
I M
|
RNF
-
NYSE
Rentech Nitrogen Ptnr Lp
CHEMICALS - Agricultural Chemicals
|
$29.60
|
+0.84
2.92% |
$30.34
|
502,056
156.75% of 50 DAV
50 DAV is 320,300
|
$31.34
-5.55%
|
7/27/2012
|
$29.58
|
PP = $30.60
|
|
MB = $32.13
|
Most Recent Note - 7/27/2012 12:45:37 PM
Y - Color code is changed to yellow with new pivot point cited based upon its 7/17/12 high. Subsequent volume-driven gains above the pivot may trigger a technical buy signal, meanwhile it is ideal for investors to have on their watchlist. Rebounding toward its 52-week high while working on a cup-with-high handle base pattern. Fundamentals remain strong. Rebounded impressively from a deep consolidation below its 50 DMA line. It was dropped from the Featured Stocks list on 5/10/12 due to damaging technical action.

>>> The latest Featured Stock Update with an annotated graph appeared on 5/2/2012. Click here.
View all notes |
Alert me of new notes |
CANSLIM.net Company Profile |
SEC |
Zacks Reports |
StockTalk |
News |
Chart |
Request a new note
C
A N
S L
I M
|
SWI
-
NYSE
Solarwinds Inc
COMPUTER SOFTWARE and SERVICES - Application Software
|
$53.44
|
+0.53
1.00% |
$53.97
|
1,565,419
142.21% of 50 DAV
50 DAV is 1,100,800
|
$53.11
0.62%
|
7/25/2012
|
$47.82
|
PP = $47.89
|
|
MB = $50.28
|
Most Recent Note - 7/26/2012 12:40:54 PM
G - Gapped up today and rallied beyond its "max buy" level with above average volume behind its 2nd consecutive gain, and its color code was changed to green after quickly getting extended. Reported earnings +50% on +40% sales revenues for the quarter ended June 30, 2012 versus the year ago period. Gapped up on the prior session and spiked to a new 52-week high, finishing strong with a considerable gain backed by 4 times average volume. It was rallying above its 50 DMA line and on the rise when highlighted in yellow in 7/25/12 mid-day report (read here) with new pivot point cited based on its 6/19/12 high while rallying from a "double bottom" base pattern and noted - "It has shown resilience since dropped on 7/09/12 from the Featured Stocks list. A strong finish above its pivot point may clinch a technical buy signal, however the M criteria now argues against any new buying efforts until the major averages confirm a new rally with another follow-through day."
>>> The latest Featured Stock Update with an annotated graph appeared on 6/15/2012. Click here.
View all notes |
Alert me of new notes |
CANSLIM.net Company Profile |
SEC |
Zacks Reports |
StockTalk |
News |
Chart |
Request a new note
C
A N
S L
I M
|
TDG
-
NYSE
Transdigm Group Inc
AEROSPACE/DEFENSE - Aerospace/Defense Products and; Services
|
$121.63
|
+1.56
1.30% |
$122.11
|
258,984
52.15% of 50 DAV
50 DAV is 496,600
|
$136.34
-10.79%
|
6/18/2012
|
$127.00
|
PP = $132.79
|
|
MB = $139.43
|
Most Recent Note - 7/25/2012 5:51:08 PM
G - Held its ground today following a damaging loss on 7/24/12 with heavy volume that violated its 50 DMA line triggering a technical sell signal.
>>> The latest Featured Stock Update with an annotated graph appeared on 7/18/2012. Click here.
View all notes |
Alert me of new notes |
CANSLIM.net Company Profile |
SEC |
Zacks Reports |
StockTalk |
News |
Chart |
Request a new note
C
A N
S L
I M
|
VSI
-
NYSE
Vitamin Shoppe Inc
SPECIALTY RETAIL - Specialty Retail, Other
|
$58.41
|
+1.43
2.51% |
$58.88
|
537,819
146.82% of 50 DAV
50 DAV is 366,300
|
$58.49
-0.14%
|
6/29/2012
|
$54.93
|
PP = $55.03
|
|
MB = $57.78
|
Most Recent Note - 7/26/2012 12:50:18 PM
Y - Erased most of today's early gain after touching a new high and briefly trading above its "max buy" level. Found support at its 50 DMA line this week, but any damaging violation would raise concerns and trigger a technical sell signal. Recent gains after forming an 8-week cup-with-handle base lacked the volume required to trigger a proper new (or add-on) technical buy signal.
>>> The latest Featured Stock Update with an annotated graph appeared on 7/2/2012. Click here.
View all notes |
Alert me of new notes |
CANSLIM.net Company Profile |
SEC |
Zacks Reports |
StockTalk |
News |
Chart |
Request a new note
C
A N
S L
I M
|
Symbol/Exchange
Company Name
Industry Group |
PRICE |
CHANGE
(%Change) |
Day High |
Volume
(% DAV)
(% 50 day avg vol) |
52 Wk Hi
% From Hi |
Featured
Date |
Price
Featured |
Pivot Featured |
|
Max Buy |
|
|
|
THESE ARE NOT BUY RECOMMENDATIONS!
Comments contained in the body of this report are technical
opinions only. The material herein has been obtained
from sources believed to be reliable and accurate, however,
its accuracy and completeness cannot be guaranteed.
This site is not an investment advisor, hence it does
not endorse or recommend any securities or other investments.
Any recommendation contained in this report may not
be suitable for all investors and it is not to be deemed
an offer or solicitation on our part with respect to
the purchase or sale of any securities. All trademarks,
service marks and trade names appearing in this report
are the property of their respective owners, and are
likewise used for identification purposes only.
This report is a service available
only to active Paid Premium Members.
You may opt-out of receiving report notifications
at any time. Questions or comments may be submitted
by writing to Premium Membership Services 665 S.E. 10 Street, Suite 201 Deerfield Beach, FL 33441-5634 or by calling 1-800-965-8307
or 954-785-1121.
|
|
|

