You are not logged in.
This means you
CAN ONLY VIEW reports that were published prior to Monday, February 26, 2024.
You
MUST UPGRADE YOUR MEMBERSHIP if you want to see any current reports.
AFTER MARKET UPDATE - TUESDAY, JULY 28TH, 2020
Previous After Market Report Next After Market Report >>>
|
|
|
|
DOW |
-205.49 |
26,379.28 |
-0.77% |
|
Volume |
725,072,898 |
-8% |
|
Volume |
3,845,526,700 |
-8% |
|
NASDAQ |
-134.57 |
10,401.70 |
-1.28% |
|
Advancers |
1,340 |
46% |
|
Advancers |
1,092 |
34% |
|
S&P 500 |
-20.97 |
3,218.44 |
-0.65% |
|
Decliners |
1,569 |
54% |
|
Decliners |
2,142 |
66% |
|
Russell 2000 |
-14.90 |
1,469.76 |
-1.00% |
|
52 Wk Highs |
80 |
|
|
52 Wk Highs |
67 |
|
|
S&P 600 |
-6.42 |
855.41 |
-0.74% |
|
52 Wk Lows |
8 |
|
|
52 Wk Lows |
20 |
|
|
 |
Major Indices Pulled Back With Lighter Volume on Exchanges
Kenneth J. Gruneisen - Passed the CAN SLIM® Master's Exam
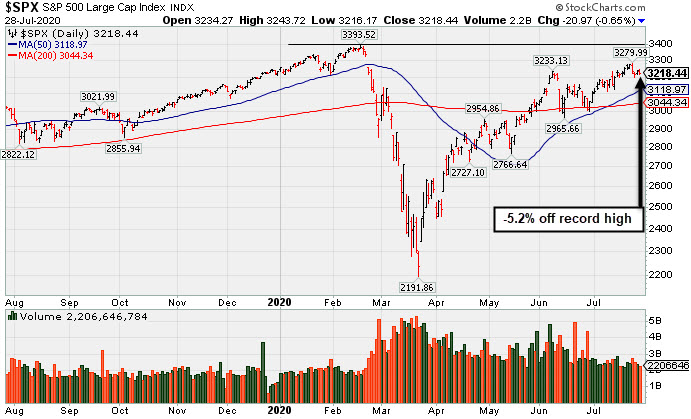
The Dow lost 205 points, while the S&P 500 declined 0.7%. The Nasdaq Composite fell 1.3%. The reported volume totals were lighter than the prior session on the NYSE and on the Nasdaq exchange, a reassuring sign that institutional selling pressure was not increasing. There were 44 high-ranked companies from the Leaders List that hit new 52-week highs and were listed on the BreakOuts Page, versus the total of 59 on the prior session. New 52-week highs totals contracted yet still outnumbered new 52-week lows totals on both the NYSE and the Nasdaq exchange. New lows on the NYSE were in the single digits for the sixth consecutive session. The major indices are in a confirmed uptrend (M criteria). Any sustainable rally requires a healthy crop of new leaders, so it remains ever-important to see substantial new highs totals. Charts used courtesy of www.stockcharts.com
PICTURED: The S&P 500 Index is consolidating well above its 50-day moving average (DMA) line. The benchmark index is -5.2% off its record high.
Stocks finished firmly lower on Tuesday as investors digested corporate earnings results and awaited stimulus updates. Fiscal stimulus remained in focus as Republicans detailed their $1 trillion coronavirus relief bill and began negotiations with Democratic lawmakers over the size and scope of the package.
Eight of 11 S&P 500 sectors ended in negative territory, with Materials and Energy leading laggards. The traditionally more defensive groups outperformed, with Real Estate and Utilities both rising more than 1.5%. In earnings, McDonald’s (MCD -2.49%) fell after its profit tally and global comparable-store sales both fell short of consensus estimates. Industrial conglomerate 3M (MMM -4.85%) fell following disappointing quarterly results. Meanwhile, drugmaker Pfizer (PFE +3.94%) rose after lifting its full-year guidance and revealing that they would launch a key, late-stage study of their vaccine candidate developed in partnership with BioNTech (BNTX -1.33%).
In central bank news, the Federal Reserve extended several of its emergency lending facilities through the remainder of the year. Treasuries advanced, with the yield on the 10-year note down three basis points to 0.58%. On the data front, the Conference Board’s gauge of consumer confidence declined more than expected to 92.6 this month from 98.3 in June. Separately, manufacturing activity in the Richmond Fed region improved more than forecasted in July.
In commodities, COMEX gold rose 1.1% to $1,952.50/ounce after hitting a record high of $2,000.00/ounce in earlier trading. Meanwhile, a gauge of the U.S. dollar lost 0.3%, heading for its worst monthly performance in over nine years.
|
 Kenneth J. Gruneisen started out as a licensed stockbroker in August 1987, a couple of months prior to the historic stock market crash that took the Dow Jones Industrial Average down -22.6% in a single day. He has published daily fact-based fundamental and technical analysis on high-ranked stocks online for two decades. Through FACTBASEDINVESTING.COM, Kenneth provides educational articles, news, market commentary, and other information regarding proven investment systems that work in good times and bad.
Comments contained in the body of this report are technical opinions only and are not necessarily those of Gruneisen Growth Corp. The material herein has been obtained from sources believed to be reliable and accurate, however, its accuracy and completeness cannot be guaranteed. Our firm, employees, and customers may effect transactions, including transactions contrary to any recommendation herein, or have positions in the securities mentioned herein or options with respect thereto. Any recommendation contained in this report may not be suitable for all investors and it is not to be deemed an offer or solicitation on our part with respect to the purchase or sale of any securities. |
|
 |
Energy, Tech, Broker/Dealer, and Retail indexes Fell
Kenneth J. Gruneisen - Passed the CAN SLIM® Master's Exam
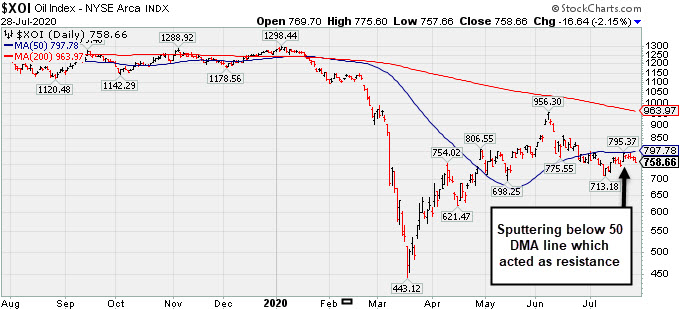
The tech sector had a negative bias as the Semiconductor Index ($SOX -2.10%), Networking Index ($NWX -2.27%), and the Biotech Index ($BTK -1.65%) each fell. Losses for the Broker/Dealer Index ($XBD -1.55%), Bank Index ($BKX -0.28%), and the Retail Index ($RLX -1.28%) also created a drag on the major indices. Energy-linked groups were standout decliners as the Oil Services Index ($OSX -3.85%) and Integrated Oil Index ($XOI -2.15%) both slumped. Meanwhile, the Gold & Silver Index ($XAU -0.59%) edged lower.
PICTURED: The Integrated Oil Index ($XOI -2.15%) has been sputtering and recently met resistance at its 50-day moving average (DMA) line.
| Oil Services |
$OSX |
36.47 |
-1.46 |
-3.85% |
-53.42% |
| Integrated Oil |
$XOI |
758.66 |
-16.64 |
-2.15% |
-40.29% |
| Semiconductor |
$SOX |
2,060.43 |
-44.19 |
-2.10% |
+11.40% |
| Networking |
$NWX |
577.22 |
-13.41 |
-2.27% |
-1.06% |
| Broker/Dealer |
$XBD |
279.81 |
-4.40 |
-1.55% |
-3.64% |
| Retail |
$RLX |
3,215.42 |
-41.58 |
-1.28% |
+31.28% |
| Gold & Silver |
$XAU |
157.28 |
-0.93 |
-0.59% |
+47.10% |
| Bank |
$BKX |
74.17 |
-0.21 |
-0.28% |
-34.57% |
| Biotech |
$BTK |
5,815.51 |
-97.52 |
-1.65% |
+14.76% |
|
|
|
 |
E-Signature Firm is Extended From Any Sound Base
Kenneth J. Gruneisen - Passed the CAN SLIM® Master's Exam
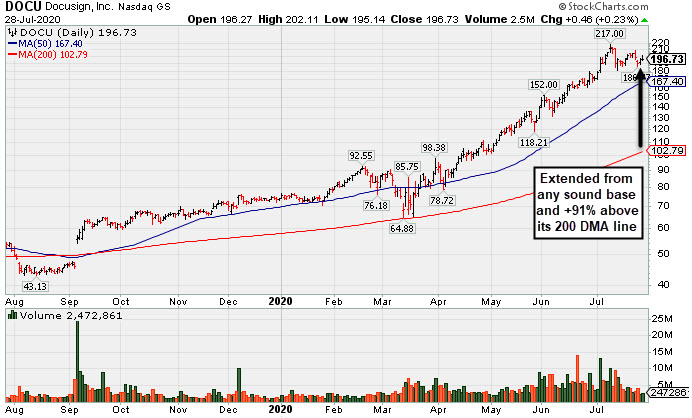
Docusign Inc (DOCU +$0.46 or +0.23% to $196.73) is very extended from any sound base. Its 50-day moving average (DMA) line ($164.50) defines near-term support to watch. DOCU is now priced +91% above its 200 DMA price, and it is taught in the Certification that a stock trading +70-100% or more above the 200 DMA is to be recognized as a "sell signal".
DOCU was last shown in this FSU section on 7/01/20 with an annotated graph under the headline, "Rally From Ascending Base Leaves Stock Very Extended". It was highlighted in yellow in the 6/01/20 mid-day report (read here) with pivot point cited based on its 5/02/20 high plus 10 cents after forming an advanced "ascending base" marked by 3 pullbacks of 10-20% during its ongoing ascent.
It has an Earnings Per Share Rating of 84, above the 80+ minimum for buy candidates. Recently it reported earnings +71% on +39% sales revenues for the Apr '20 quarter versus the year ago period. Three of the past 4 quarterly comparisons versus the year ago period were above the +25% minimum guideline with solid underlying sales revenues growth. After years of losses it had solid earnings in FY '19 and '20.
The number of top-rated funds owning its shares rose from 558 on Jun '19 to 1,081 in Jun '20, a reassuring sign concerning the I criteria. Its current Up/Down Volume Ratio of 1.4 also is an unbiased indication its shares have been under accumulation over the past 50 days. The Computer Software-Enterprise industry group is currently ranked 4th of the 197 Industry Groups (L criteria).
|
|
|
Color Codes Explained :
Y - Better candidates highlighted by our
staff of experts.
G - Previously featured
in past reports as yellow but may no longer be buyable under the
guidelines.
***Last / Change / Volume data in this table is the closing quote data***
Symbol/Exchange
Company Name
Industry Group |
PRICE |
CHANGE
(%Change) |
Day High |
Volume
(% DAV)
(% 50 day avg vol) |
52 Wk Hi
% From Hi |
Featured
Date |
Price
Featured |
Pivot Featured |
|
Max Buy |
 FTNT
-
NASDAQ
FTNT
-
NASDAQ
Fortinet Inc
Computer Sftwr-Security
|
$133.42
|
-3.23
-2.36% |
$136.92
|
937,929
55.73% of 50 DAV
50 DAV is 1,683,000
|
$151.95
-12.19%
|
6/22/2020
|
$142.68
|
PP = $149.79
|
|
MB = $157.28
|
Most Recent Note - 7/27/2020 6:06:49 PM
G - Its 50 DMA line ($137.68) has been acting as resistance after damaging losses, and a rebound above that important short-term average is needed for its outlook to improve.
>>> FEATURED STOCK ARTICLE : Best Ever Close With Volume-Driven Gain Approaching Pivot Point - 7/8/2020 |
View all notes |
Set NEW NOTE alert |
Company Profile |
SEC
News |
Chart |
Request a new note
C
A
S
I |
CRL
-
NYSE
Charles River Labs Intl
DRUGS - Biotechnology
|
$197.37
|
-2.56
-1.28% |
$200.61
|
166,480
42.91% of 50 DAV
50 DAV is 388,000
|
$202.95
-2.75%
|
7/15/2020
|
$192.66
|
PP = $189.95
|
|
MB = $199.45
|
Most Recent Note - 7/27/2020 5:56:43 PM
G - Color code is changed to green after quietly rising and closing above its "max buy" level with today's gain backed by below average volume. The prior high ($189.85 on 6/03/20) defines initial support to watch above its 50 DMA line ($181.12).
>>> FEATURED STOCK ARTICLE : Volume +71% Above Average Behind Breakout - 7/15/2020 |
View all notes |
Set NEW NOTE alert |
Company Profile |
SEC
News |
Chart |
Request a new note
C
A
S
I |
EBS
-
NYSE
Emergent Biosolutions
DRUGS - Biotechnology
|
$92.50
|
-2.28
-2.41% |
$95.73
|
782,916
85.75% of 50 DAV
50 DAV is 913,000
|
$107.16
-13.68%
|
7/7/2020
|
$89.47
|
PP = $93.68
|
|
MB = $98.36
|
Most Recent Note - 7/27/2020 5:54:13 PM
Y - Posted a big gain today with near average volume. There was a noted "negative reversal" on 7/20/20 at its all-time high. The next important support to watch is its 50 DMA line ($83.78). Due to report Jun '20 quarterly earnings news on 7/30/20. Volume and volatility often increase near earnings news.
>>> FEATURED STOCK ARTICLE : Impressive Rebound to Hit a New High - 7/9/2020 |
View all notes |
Set NEW NOTE alert |
Company Profile |
SEC
News |
Chart |
Request a new note
C
A
S
I |
NBIX
-
NASDAQ
Neurocrine Biosciences
DRUGS - Biotechnology
|
$121.65
|
-4.35
-3.45% |
$126.24
|
601,647
69.64% of 50 DAV
50 DAV is 864,000
|
$136.27
-10.73%
|
5/19/2020
|
$123.71
|
PP = $119.75
|
|
MB = $125.74
|
 Most Recent Note - 7/28/2020 6:07:46 PM
G - Violated its 50 DMA line ($124.49) with a big loss today on below average volume triggering a technical sell signal. Only a prompt rebound above the 50 DMA line would help its outlook improve. Due to report Jun '20 quarterly earnings results on Monday 8/03/20. See the latest FSU analysis for more details and an annotated graph.
>>> FEATURED STOCK ARTICLE : Consolidating Near 50-Day Moving Average; Earnings Report Due - 7/27/2020 |
View all notes |
Set NEW NOTE alert |
Company Profile |
SEC
News |
Chart |
Request a new note
C
A
S
I |
BMRN
-
NASDAQ
Biomarin Pharmaceutical
DRUGS - Drug Manufacturers - Other
|
$122.83
|
-1.17
-0.94% |
$124.46
|
885,440
58.48% of 50 DAV
50 DAV is 1,514,000
|
$131.95
-6.91%
|
6/17/2020
|
$110.95
|
PP = $112.67
|
|
MB = $118.30
|
Most Recent Note - 7/23/2020 5:49:24 PM
G - Pulled back from its all-time high with light volume behind today's 3rd consecutive loss. It is extended from any sound base. Fundamentals remain strong. Its 50 DMA line ($114.09) and prior high ($112.57) define near-term support levels to watch.
>>> FEATURED STOCK ARTICLE : Hovering Near High With Volume Totals Cooling - 7/10/2020 |
View all notes |
Set NEW NOTE alert |
Company Profile |
SEC
News |
Chart |
Request a new note
C
A
S
I |
Symbol/Exchange
Company Name
Industry Group |
PRICE |
CHANGE
(%Change) |
Day High |
Volume
(% DAV)
(% 50 day avg vol) |
52 Wk Hi
% From Hi |
Featured
Date |
Price
Featured |
Pivot Featured |
|
Max Buy |
AUDC
-
NASDAQ
Audiocodes Ltd
ELECTRONICS - Scientific and Technical Instrum
|
$37.21
|
-7.55
-16.87% |
$41.53
|
3,512,631
484.50% of 50 DAV
50 DAV is 725,000
|
$44.94
-17.20%
|
7/17/2020
|
$37.16
|
PP = $40.16
|
|
MB = $42.17
|
Most Recent Note - 7/28/2020 6:05:39 PM
G - Reported Jun '20 quarterly earnings +45% on +8% sales revenues versus the year-ago period. Volume and volatility often increase near earnings news. It gapped down today and suffered a big volume-driven loss while slumping back below the pivot point and falling into the prior base, raising concerns. Disciplined investors always limit losses by selling any stock that falls more than 7-8% from their purchase price.
>>> FEATURED STOCK ARTICLE : Resilient and High-Ranked VOIP Firm Rebounding Near Highs - 7/17/2020 |
View all notes |
Set NEW NOTE alert |
Company Profile |
SEC
News |
Chart |
Request a new note
C
A
S
I |
AMD
-
NASDAQ
Advanced Micro Devices
ELECTRONICS - Semiconductor - Broad Line
|
$67.61
|
-1.36
-1.97% |
$69.80
|
88,026,044
149.15% of 50 DAV
50 DAV is 59,020,000
|
$71.63
-5.61%
|
7/22/2020
|
$61.73
|
PP = $59.10
|
|
MB = $62.06
|
Most Recent Note - 7/28/2020 12:27:11 PM
G - Extended from the previously noted base after considerable volume-driven gains. Prior highs in the $59 area define initial support above its 50 DMA line.
>>> FEATURED STOCK ARTICLE : Pullback After Breakout Gain Backed by +152% Above Average Volume - 7/23/2020 |
View all notes |
Set NEW NOTE alert |
Company Profile |
SEC
News |
Chart |
Request a new note
C
A
S
I |
TREX
-
NYSE
Trex Company Inc
MATERIALS and CONSTRUCTION - General Building Materials
|
$134.85
|
-4.15
-2.99% |
$138.03
|
543,358
57.20% of 50 DAV
50 DAV is 950,000
|
$139.98
-3.66%
|
6/26/2020
|
$109.05
|
PP = $132.94
|
|
MB = $139.59
|
Most Recent Note - 7/28/2020 6:38:14 PM
Y - Pulled back today with higher but below average volume while consolidating near its all-time high. Recent gains above the pivot point have not had the +40% above average volume necessary to trigger a proper new (or add-on) technical buy signal. Important near-term support is at its 50 DMA line ($125). Due to report Jun '20 quarterly results on 8/03/20.
>>> FEATURED STOCK ARTICLE : Quietly Perched Near All-Time High After Forming a New Base - 7/6/2020 |
View all notes |
Set NEW NOTE alert |
Company Profile |
SEC
News |
Chart |
Request a new note
C
A
S
I |
NFLX
-
NASDAQ
Netflix Inc
SPECIALTY RETAIL - Music and Video Stores
|
$488.51
|
-7.14
-1.44% |
$497.79
|
5,968,705
75.82% of 50 DAV
50 DAV is 7,872,000
|
$575.37
-15.10%
|
5/14/2020
|
$441.95
|
PP = $449.62
|
|
MB = $472.10
|
Most Recent Note - 7/23/2020 5:52:02 PM
G - Prior highs in the $458 area define near-term support coinciding with its 50 DMA line ($458.79). Pulling back toward its "max buy" level after getting very extended from the prior base. Consolidating after reporting Jun '20 earnings +165% on +25% sales revenues versus the year ago period.
>>> FEATURED STOCK ARTICLE : Powered to New High on Prior Session With Volume Driven Gain - 7/2/2020 |
View all notes |
Set NEW NOTE alert |
Company Profile |
SEC
News |
Chart |
Request a new note
C
A
S
I |
CHGG
-
NYSE
Chegg Inc
Consumer Svcs-Education
|
$72.84
|
-1.46
-1.97% |
$74.46
|
2,466,836
72.92% of 50 DAV
50 DAV is 3,383,000
|
$79.09
-7.90%
|
6/17/2020
|
$63.71
|
PP = $68.08
|
|
MB = $71.48
|
Most Recent Note - 7/27/2020 6:04:44 PM
G - Extended from any sound base. Prior high in the $68 area defines initial support to watch above its 50 DMA line ($66.06) where any losses leading to violations would raise concerns and trigger technical sell signals.
>>> FEATURED STOCK ARTICLE : Negative Reversal After Recently Wedging into New High Territory - 7/13/2020 |
View all notes |
Set NEW NOTE alert |
Company Profile |
SEC
News |
Chart |
Request a new note
C
A
S
I |
Symbol/Exchange
Company Name
Industry Group |
PRICE |
CHANGE
(%Change) |
Day High |
Volume
(% DAV)
(% 50 day avg vol) |
52 Wk Hi
% From Hi |
Featured
Date |
Price
Featured |
Pivot Featured |
|
Max Buy |
LGIH
-
NASDAQ
L G I Homes Inc
Bldg-Resident/Comml
|
$113.98
|
-2.91
-2.49% |
$119.39
|
246,662
68.52% of 50 DAV
50 DAV is 360,000
|
$120.54
-5.44%
|
7/7/2020
|
$99.19
|
PP = $95.82
|
|
MB = $100.61
|
Most Recent Note - 7/28/2020 6:16:15 PM
G - Volume totals have been cooling while hovering near its all-time high stubbornly holding its ground. It is extended from the previously noted base. Prior highs in the $95 area and its 50 DMA line ($93.24) define near-term support to watch on pullbacks.
>>> FEATURED STOCK ARTICLE : Breakout to New High Backed by 53% Above Average Volume - 7/7/2020 |
View all notes |
Set NEW NOTE alert |
Company Profile |
SEC
News |
Chart |
Request a new note
C
A
S
I |
NOW
-
NYSE
Servicenow Inc
Computer Sftwr-Enterprse
|
$435.04
|
+1.23
0.28% |
$442.58
|
1,032,583
61.03% of 50 DAV
50 DAV is 1,692,000
|
$454.70
-4.32%
|
4/30/2020
|
$343.05
|
PP = $363.05
|
|
MB = $381.20
|
Most Recent Note - 7/28/2020 6:20:36 PM
G - Due to report Jun '20 quarterly results after the close on Wednesday, 7/29/20. Volume and volatility often increase near earnings news. Volume totals have been cooling while hovering near its all-time high, stubbornly holding its ground. It has not formed a sound base. Its 50 DMA line ($403) defines important near-term support to watch where a violation may trigger a technical sell signal.
>>> FEATURED STOCK ARTICLE : Perched Near All-Time High With Earnings News Due Next Week - 7/22/2020 |
View all notes |
Set NEW NOTE alert |
Company Profile |
SEC
News |
Chart |
Request a new note
C
A
S
I |
TEAM
-
NASDAQ
Atlassian Corp Plc Cl A
Comp Sftwr-Spec Enterprs
|
$183.36
|
-1.15
-0.62% |
$187.80
|
1,137,973
59.52% of 50 DAV
50 DAV is 1,912,000
|
$198.41
-7.59%
|
7/7/2020
|
$190.44
|
PP = $191.82
|
|
MB = $201.41
|
Most Recent Note - 7/24/2020 7:23:26 PM
Y - Pulled back toward its its 50 DMA line ($181.10) with a loss today on light volume. Recent rebound above its 50 DMA line helped its outlook to improve and its color code was changed to yellow. Recent gains above the pivot point lacked the +40% above average volume necessary to trigger a convincing new (or add-on) technical buy signal. Confirming volume-driven gains would be a reassuring sign of fresh institutional buying demand. The prior low ($169.11 on 7/14/20) defines the next important support below its 50 DMA line. Keep in mind it is due to report earnings news on 7/30/20. See the latest FSU analysis for more details and a new annotated graph.
>>> FEATURED STOCK ARTICLE : Consolidating Near High With Earnings News Due Soon - 7/24/2020 |
View all notes |
Set NEW NOTE alert |
Company Profile |
SEC
News |
Chart |
Request a new note
C
A
S
I |
TTD
-
NASDAQ
The Trade Desk Inc Cl A
Comml Svcs-Advertising
|
$419.46
|
-12.70
-2.94% |
$435.71
|
760,813
44.47% of 50 DAV
50 DAV is 1,711,000
|
$475.67
-11.82%
|
6/3/2020
|
$340.61
|
PP = $327.35
|
|
MB = $343.72
|
Most Recent Note - 7/28/2020 6:39:16 PM
G - Volume totals have been cooling while consolidating near its all-time high. Very extended from any sound base, and its 50 DMA line ($385) defines near-term support to watch.
>>> FEATURED STOCK ARTICLE : Rebounded Near All-Time High With Gain Backed by Light Volume - 7/20/2020 |
View all notes |
Set NEW NOTE alert |
Company Profile |
SEC
News |
Chart |
Request a new note
C
A
S
I |
DOCU
-
NASDAQ
Docusign Inc
Computer Sftwr-Enterprse
|
$196.73
|
+0.46
0.23% |
$202.11
|
2,472,108
43.89% of 50 DAV
50 DAV is 5,633,000
|
$217.00
-9.34%
|
6/10/2020
|
$149.73
|
PP = $152.10
|
|
MB = $159.71
|
Most Recent Note - 7/28/2020 6:35:00 PM
G - Still very extended from any sound base. Its 50 DMA line ($167.40) defines near-term support to watch. DOCU is now priced +91% above its 200 DMA price, and it is taught in the Certification that a stock trading +70-100% or more above the 200 DMA is to be recognized as a "sell signal". See the latest FSU analysis for more details and a new annotated graph.
>>> FEATURED STOCK ARTICLE : E-Signature Firm is Extended From Any Sound Base - 7/28/2020 |
View all notes |
Set NEW NOTE alert |
Company Profile |
SEC
News |
Chart |
Request a new note
C
A
S
I |
Symbol/Exchange
Company Name
Industry Group |
PRICE |
CHANGE
(%Change) |
Day High |
Volume
(% DAV)
(% 50 day avg vol) |
52 Wk Hi
% From Hi |
Featured
Date |
Price
Featured |
Pivot Featured |
|
Max Buy |
PING
-
NYSE
Ping Identity Hldg Corp
Computer Sftwr-Security
|
$32.96
|
-0.64
-1.90% |
$33.77
|
621,456
40.43% of 50 DAV
50 DAV is 1,537,000
|
$35.79
-7.91%
|
6/1/2020
|
$29.24
|
PP = $29.90
|
|
MB = $31.40
|
Most Recent Note - 7/23/2020 5:46:22 PM
G - Had "negative reversals" on Tuesday and again today for losses on light volume. Its 50 DMA line ($30.18) and prior highs in the $29 area define important near-term support. It is extended from any sound base. Completed Secondary Offerings on 7/09/20 and 5/15/20.
>>> FEATURED STOCK ARTICLE : Consolidating Above 50-Day Moving Average Following Secondary - 7/16/2020 |
View all notes |
Set NEW NOTE alert |
Company Profile |
SEC
News |
Chart |
Request a new note
C
A
S
I |
AAXN
-
NASDAQ
Axon Enterprise Inc
Security/Sfty
|
$85.85
|
-0.59
-0.68% |
$86.81
|
374,491
29.79% of 50 DAV
50 DAV is 1,257,000
|
$104.90
-18.16%
|
5/8/2020
|
$84.86
|
PP = $90.20
|
|
MB = $94.71
|
Most Recent Note - 7/28/2020 6:12:18 PM
Slumping further below its 50 DMA line ($90.53) and below the prior low ($87.75 on 7/14/20) with recent losses backed by below average volume raising serious concerns and triggering technical sell signals. A rebound above its 50 DMA line is needed for its outlook to improve. It will be dropped from the Featured Stocks list tonight.
>>> FEATURED STOCK ARTICLE : Managed Positive Reversal After Testing 50-Day Moving Average - 7/14/2020 |
View all notes |
Set NEW NOTE alert |
Company Profile |
SEC
News |
Chart |
Request a new note
C
A
S
I |
ZEN
-
NYSE
Zendesk Inc
Computer Sftwr-Enterprse
|
$95.11
|
-1.20
-1.25% |
$97.24
|
835,259
39.47% of 50 DAV
50 DAV is 2,116,000
|
$97.67
-2.62%
|
7/21/2020
|
$94.29
|
PP = $94.97
|
|
MB = $99.72
|
Most Recent Note - 7/27/2020
Y - Posted a gain today with light volume for a best-ever close. Due to report Jun '20 quarterly earnings news on 7/30/20. Volume and volatility often increase near earnings news.
>>> FEATURED STOCK ARTICLE : Pullback Below Pivot Point Following Breakout Gain - 7/21/2020 |
View all notes |
Set NEW NOTE alert |
Company Profile |
SEC
News |
Chart |
Request a new note
C
A
S
I |
|
|
|
THESE ARE NOT BUY RECOMMENDATIONS!
Comments contained in the body of this report are technical
opinions only. The material herein has been obtained
from sources believed to be reliable and accurate, however,
its accuracy and completeness cannot be guaranteed.
This site is not an investment advisor, hence it does
not endorse or recommend any securities or other investments.
Any recommendation contained in this report may not
be suitable for all investors and it is not to be deemed
an offer or solicitation on our part with respect to
the purchase or sale of any securities. All trademarks,
service marks and trade names appearing in this report
are the property of their respective owners, and are
likewise used for identification purposes only.
This report is a service available
only to active Paid Premium Members.
You may opt-out of receiving report notifications
at any time. Questions or comments may be submitted
by writing to Premium Membership Services 665 S.E. 10 Street, Suite 201 Deerfield Beach, FL 33441-5634 or by calling 1-800-965-8307
or 954-785-1121.
|
|
|