You are not logged in.
This means you
CAN ONLY VIEW reports that were published prior to Monday, April 14, 2025.
You
MUST UPGRADE YOUR MEMBERSHIP if you want to see any current reports.
AFTER MARKET UPDATE - WEDNESDAY, JULY 27TH, 2011
Previous After Market Report Next After Market Report >>>
|
|
|
|
DOW |
-198.75 |
12,302.55 |
-1.59% |
|
Volume |
1,099,239,110 |
+31% |
|
Volume |
2,300,358,710 |
+36% |
|
NASDAQ |
-75.17 |
2,764.79 |
-2.65% |
|
Advancers |
226 |
7% |
|
Advancers |
345 |
13% |
|
S&P 500 |
-27.05 |
1,304.89 |
-2.03% |
|
Decliners |
2,833 |
91% |
|
Decliners |
2,286 |
85% |
|
Russell 2000 |
-24.30 |
800.53 |
-2.95% |
|
52 Wk Highs |
28 |
|
|
52 Wk Highs |
15 |
|
|
S&P 600 |
-12.78 |
431.15 |
-2.88% |
|
52 Wk Lows |
107 |
|
|
52 Wk Lows |
90 |
|
|
 |
Major Averages Show Signs of More Serious Institutional Selling
Kenneth J. Gruneisen - Passed the CAN SLIM® Master's Exam
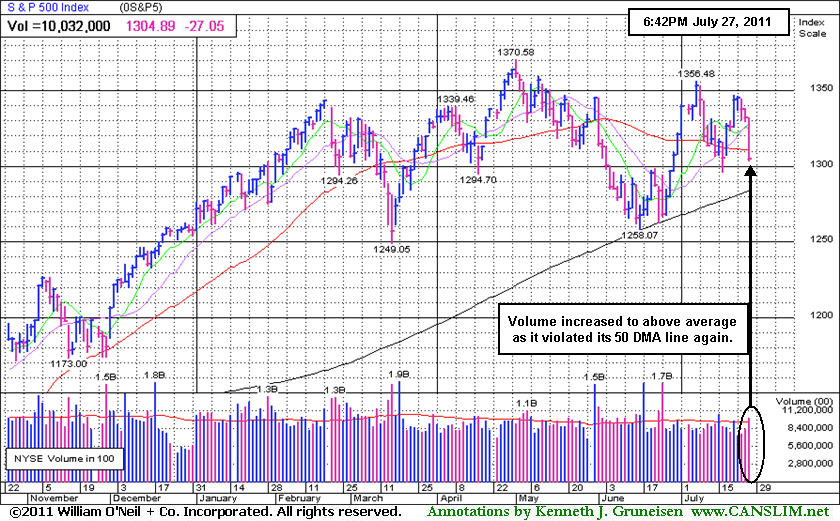
The S&P 500 Index and Dow Jones Industrial Average both suffered damaging losses as they sank below their respective 50-day moving average (DMA) lines again. Raising concerns that the increasing pressure on stocks could lead to a more damaging market correction, Wednesday's volume totals were reported higher than the prior session volume totals on the NYSE and on the Nasdaq exchange. That was a clear indication that institutional investors had a more pronounced bias toward unloading stocks. Declining issues swamped advancers by 12-1 on the NYSE and by 6-1 on the Nasdaq exchange. New 52-week lows solidly outnumbered new 52-week highs on the NYSE and on the Nasdaq exchange for a second consecutive session. There were only 11 high-ranked companies from the CANSLIM.net Leaders List that made new 52-week highs and appeared on the CANSLIM.net BreakOuts Page, down from Tuesday's total of 21 stocks. Only 1 gainer was among the 18 high-ranked leaders currently included on the Featured Stocks Page.
Economic data suggested companies lost some confidence in the strength of the recovery as the second quarter ended. June durable goods orders unexpectedly fell 2.1%. Wall Street still had a negative bias as the stalemate over the federal deficit persisted, pushing the government closer to default. Losses intensified after a government auction of five-year notes saw weaker demand and the Federal Reserve's monthly Beige Book survey revealed that economic activity expanded at a slower pace in June. Energy shares fell along with oil prices after U.S. supplies of crude unexpectedly increased in the latest week.
Disappointing corporate profits made technology stocks some of Wednesday's biggest losers. Juniper Networks Inc's (JNPR -20.89%) shares dove in the wake of a disappointing quarter. Cisco Systems Inc (CSCO -3.68%) fell in sympathy. Corning Inc (GLW -7.23%) reduced its outlook for glass demand amid lower projections for television sales. Emerson Electric Co (EMR -6.70%) said order growth slowed.
Investors warmly welcomed the debut of Dunkin' Brands Group Inc (DNKN +46.58%), operator of Dunkin’ Donuts its first day of trading. Amazon.com Inc (AMZN +3.89%) gapped up and hit a new all-time high after earnings beat forecasts. Boeing Co (BA +0.67%) was a standout on the Dow as the plane maker raised its earnings forecast for the year.
Distribution days have been adding up in recent weeks, indicating some problems for the current rally. Financial stocks, considered very important leading indicators, have also continued to struggle. Subsequent losses leading the major averages to violate their recent lows would bode poorly for the market outlook (M criteria).
PICTURED: The S&P 500 Index violated its 50-day moving average again with a considerable loss on above average volume.
|
 Kenneth J. Gruneisen started out as a licensed stockbroker in August 1987, a couple of months prior to the historic stock market crash that took the Dow Jones Industrial Average down -22.6% in a single day. He has published daily fact-based fundamental and technical analysis on high-ranked stocks online for two decades. Through FACTBASEDINVESTING.COM, Kenneth provides educational articles, news, market commentary, and other information regarding proven investment systems that work in good times and bad.
Comments contained in the body of this report are technical opinions only and are not necessarily those of Gruneisen Growth Corp. The material herein has been obtained from sources believed to be reliable and accurate, however, its accuracy and completeness cannot be guaranteed. Our firm, employees, and customers may effect transactions, including transactions contrary to any recommendation herein, or have positions in the securities mentioned herein or options with respect thereto. Any recommendation contained in this report may not be suitable for all investors and it is not to be deemed an offer or solicitation on our part with respect to the purchase or sale of any securities. |
|
 |
Tech, Healthcare, Commodity-Linked Groups led Decliners
Kenneth J. Gruneisen - Passed the CAN SLIM® Master's Exam
The Networking Index ($NWX -7.33%) led the tech sector's losses as the Semiconductor Index ($SOX -3.77%) and Biotechnology Index ($BTK -3.42%) followed with large losses of greater than -3% while the Internet Index ($IIX -2.86%) did not fare much better. The Healthcare Index ($HMO -4.32%) was also among the day's biggest decliners. Financial shares were weak as the Broker/Dealer Index ($XBD -3.38%) and Bank Index ($BKX -2.34%) slumped from their 50-day moving average lines which acted as resistance lately. Commodity-linked areas fell and the Gold & Silver Index ($XAU -2.97%), Oil Services Index ($OSX -2.40%), and Integrated Oil Index ($XOI -2.25%) ended lower. The Retail Index's ($RLX -1.05%) relatively small loss actually made it a standout on the thoroughly negative session.
Charts courtesy www.stockcharts.com
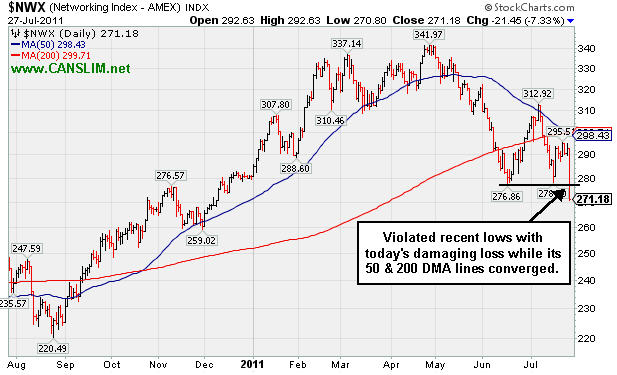
PICTURED: The Networking Index ($NWX -7.33%) violated recent lows with today's damaging loss while its 50-day moving average (DMA) line and 200 DMA line converged.
| Oil Services |
$OSX |
272.36 |
-6.69 |
-2.40% |
+11.11% |
| Healthcare |
$HMO |
2,275.23 |
-102.72 |
-4.32% |
+34.47% |
| Integrated Oil |
$XOI |
1,305.17 |
-30.00 |
-2.25% |
+7.58% |
| Semiconductor |
$SOX |
391.13 |
-15.34 |
-3.77% |
-5.02% |
| Networking |
$NWX |
271.18 |
-21.45 |
-7.33% |
-3.34% |
| Internet |
$IIX |
310.04 |
-9.12 |
-2.86% |
+0.75% |
| Broker/Dealer |
$XBD |
104.72 |
-3.66 |
-3.38% |
-13.82% |
| Retail |
$RLX |
539.89 |
-5.75 |
-1.05% |
+6.20% |
| Gold & Silver |
$XAU |
212.35 |
-6.49 |
-2.97% |
-6.28% |
| Bank |
$BKX |
46.29 |
-1.11 |
-2.34% |
-11.34% |
| Biotech |
$BTK |
1,348.56 |
-47.75 |
-3.42% |
+3.92% |
|
|
|
 |
Holding Gains Following Breakaway Gap
Kenneth J. Gruneisen - Passed the CAN SLIM® Master's Exam
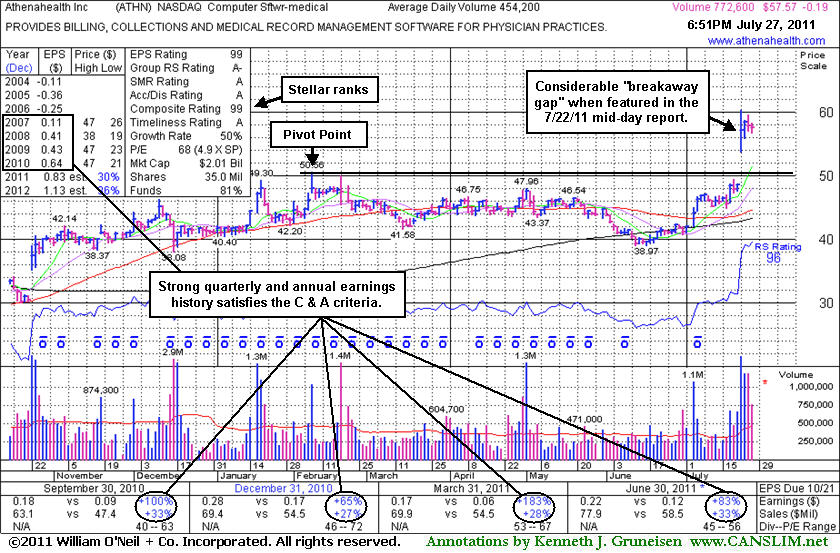
Athenahealth Inc (ATHN -$0.19 or -0.33% to $57.57) has been holding its ground stubbornly at all-time highs since highlighted in yellow in the 7/22/11 mid-day report (read here), a session marked by 11 times average volume as its considerable "breakaway gap" cleared previously noted resistance in the $50 area. It reported earnings +83% on +33% sales revenues for the quarter ended June 30, 2011 versus the year ago period. The C criteria is satisfied by the past 4 quarterly comparisons showing solid sales and earnings increases above the +25% guideline. Its strong annual earnings satisfies the A criteria. It rallied above its 50 and 200 DMA lines with considerable volume-driven gains in recent weeks during its long base pattern.
Color code was quickly changed to green. Disciplined investors are careful to not chase extended stocks, however a breakaway gap is one noted exception to the regular guidelines for buying stocks no more than 5% above a prior high or pivot point. Always limit losses if a stock falls -7% from your buy price. Considering the broader market's deterioration (M criteria) of late, the poor environment is not likely to offer gutsy investors many great rewards for the near term.
|
|
|
Color Codes Explained :
Y - Better candidates highlighted by our
staff of experts.
G - Previously featured
in past reports as yellow but may no longer be buyable under the
guidelines.
***Last / Change / Volume data in this table is the closing quote data***
Symbol/Exchange
Company Name
Industry Group |
PRICE |
CHANGE
(%Change) |
Day High |
Volume
(% DAV)
(% 50 day avg vol) |
52 Wk Hi
% From Hi |
Featured
Date |
Price
Featured |
Pivot Featured |
|
Max Buy |
ATHN
-
NASDAQ
Athenahealth Inc
DIVERSIFIED SERVICES - Business/Management Services
|
$57.57
|
-0.19
-0.33% |
$58.30
|
776,081
170.87% of 50 DAV
50 DAV is 454,200
|
$60.29
-4.51%
|
7/22/2011
|
$57.30
|
PP = $50.66
|
|
MB = $53.19
|
 Most Recent Note - 7/27/2011 7:08:50 PM
G - Holding its ground stubbornly at all-time highs since highlighted in yellow in the 7/22/11 mid-day report (read here), a session marked by 11 times average volume as its considerable "breakaway gap" cleared previously noted resistance in the $50 area. See the latest FSU analysis for more details and an annotated graph.
>>> The latest Featured Stock Update with an annotated graph appeared on 7/27/2011. Click here.
View all notes |
Alert me of new notes |
CANSLIM.net Company Profile |
SEC |
Zacks Reports |
StockTalk |
News |
Chart |
Request a new note
C
A N
S L
I M


|
BIDU
-
NASDAQ
Baidu Inc Ads
INTERNET - Internet Information Providers
|
$161.24
|
-3.12
-1.90% |
$165.89
|
9,787,092
107.54% of 50 DAV
50 DAV is 9,100,900
|
$165.96
-2.84%
|
7/26/2011
|
$164.32
|
PP = $156.14
|
|
MB = $163.95
|
Most Recent Note - 7/27/2011 12:07:12 PM
Y - Holding its ground today following a gap up on the prior session for a new 52-week high, rising from a 14-week cup shaped base without a handle. No resistance remains due to overhead supply after its small "breakaway gap" triggered a technical buy signal. Color code was changed to yellow when featured in the 7/26/11 mid-day report (read here) with pivot point cited based on its 4/28/11 high plus 10 cents. After this high-ranked Internet - Content firm was dropped from the Featured Stocks list on 5/13/11 it subsequently fell from $131 to $114 and tested support at its long-term 200 DMA line before rebounding impressively. It has maintained a track record of strong quarterly sales revenues and earnings increases.
>>> The latest Featured Stock Update with an annotated graph appeared on 5/9/2011. Click here.
View all notes |
Alert me of new notes |
CANSLIM.net Company Profile |
SEC |
Zacks Reports |
StockTalk |
News |
Chart |
Request a new note
C
A N
S L
I M
|
CACC
-
NASDAQ
Credit Acceptance Corp
FINANCIAL SERVICES - Credit Services
|
$78.12
|
-2.70
-3.34% |
$80.76
|
20,894
55.13% of 50 DAV
50 DAV is 37,900
|
$86.87
-10.07%
|
6/2/2011
|
$76.10
|
PP = $82.39
|
|
MB = $86.51
|
Most Recent Note - 7/27/2011 5:27:58 PM
G - Today's 4th consecutive loss on light volume led to a violation and close below its 50 DMA line, raising more serious concerns. Its color code is changed to green based on its technical deterioration. A prompt rebound above its short-term average is needed for its outlook to improve. The next support level is prior chart lows in the $75 area. Due to report earnings results on Monday, August 1st.
>>> The latest Featured Stock Update with an annotated graph appeared on 6/27/2011. Click here.
View all notes |
Alert me of new notes |
CANSLIM.net Company Profile |
SEC |
Zacks Reports |
StockTalk |
News |
Chart |
Request a new note
C
A N
S L
I M
|
CMG
-
NYSE
Chipotle Mexican Grill
LEISURE - Restaurants
|
$322.74
|
-8.66
-2.61% |
$329.79
|
828,079
104.06% of 50 DAV
50 DAV is 795,800
|
$337.32
-4.32%
|
4/1/2011
|
$274.00
|
PP = $275.10
|
|
MB = $288.86
|
Most Recent Note - 7/26/2011 4:47:45 PM
G - Quietly hovering at all-time highs this week, extended from any sound base pattern. Reported earnings per share +12% on +22% sales revenues for the quarter ended June 30, 2011 versus the year ago period. Fundamentals have raised concern with its 2nd consecutive quarterly comparison with earnings below the +25% guideline.
>>> The latest Featured Stock Update with an annotated graph appeared on 7/8/2011. Click here.
View all notes |
Alert me of new notes |
CANSLIM.net Company Profile |
SEC |
Zacks Reports |
StockTalk |
News |
Chart |
Request a new note
C
A N
S L
I M
|
EZPW
-
NASDAQ
Ezcorp Inc Cl A
SPECIALTY RETAIL - Specialty Retail, Other
|
$32.12
|
-0.62
-1.89% |
$32.74
|
875,923
184.09% of 50 DAV
50 DAV is 475,800
|
$38.66
-16.92%
|
6/13/2011
|
$31.18
|
PP = $33.41
|
|
MB = $35.08
|
Most Recent Note - 7/26/2011 2:57:05 PM
G - Down again today with above average volume behind a 3rd consecutive loss. Raising concerns while slumping under its 50 DMA line and near prior highs previously noted as a support level to watch.
>>> The latest Featured Stock Update with an annotated graph appeared on 7/5/2011. Click here.
View all notes |
Alert me of new notes |
CANSLIM.net Company Profile |
SEC |
Zacks Reports |
StockTalk |
News |
Chart |
Request a new note
C
A N
S L
I M
|
Symbol/Exchange
Company Name
Industry Group |
PRICE |
CHANGE
(%Change) |
Day High |
Volume
(% DAV)
(% 50 day avg vol) |
52 Wk Hi
% From Hi |
Featured
Date |
Price
Featured |
Pivot Featured |
|
Max Buy |
FCFS
-
NASDAQ
First Cash Financial Svs
SPECIALTY RETAIL - Specialty Retail, Other
|
$41.93
|
-1.14
-2.65% |
$43.24
|
306,660
154.49% of 50 DAV
50 DAV is 198,500
|
$44.84
-6.49%
|
5/31/2011
|
$42.00
|
PP = $40.23
|
|
MB = $42.24
|
Most Recent Note - 7/27/2011 5:30:38 PM
G - Loss on above average volume today led to a pullback near recent chart lows and its 50 DMA line which define important near-term support to watch.
>>> The latest Featured Stock Update with an annotated graph appeared on 7/18/2011. Click here.
View all notes |
Alert me of new notes |
CANSLIM.net Company Profile |
SEC |
Zacks Reports |
StockTalk |
News |
Chart |
Request a new note
C
A N
S L
I M
|
FOSL
-
NASDAQ
Fossil Inc
CONSUMER DURABLES - Recreational Goods, Other
|
$125.02
|
-5.41
-4.15% |
$130.11
|
957,505
137.41% of 50 DAV
50 DAV is 696,800
|
$134.98
-7.38%
|
2/1/2011
|
$73.30
|
PP = $74.44
|
|
MB = $78.16
|
Most Recent Note - 7/27/2011 5:32:33 PM
G - Pulled back today with above average volume, retreating from all-time highs. It has been repeatedly noted as very extended from its 50 DMA line and prior highs in the $107 area that define support.
>>> The latest Featured Stock Update with an annotated graph appeared on 7/21/2011. Click here.
View all notes |
Alert me of new notes |
CANSLIM.net Company Profile |
SEC |
Zacks Reports |
StockTalk |
News |
Chart |
Request a new note
C
A N
S L
I M
|
HS
-
NYSE
Healthspring Inc
HEALTH SERVICES - Health Care Plans
|
$42.00
|
-2.47
-5.55% |
$44.14
|
1,694,410
212.15% of 50 DAV
50 DAV is 798,700
|
$48.95
-14.20%
|
6/16/2011
|
$42.44
|
PP = $45.21
|
|
MB = $47.47
|
Most Recent Note - 7/27/2011 5:35:54 PM
G - Finished near the session low after a gap down violated its 50 DMA line, raising concerns and triggering a technical sell signal with above average volume behind today's 4th consecutive damaging loss. Color code is changed to green after slumping more than -7% below its latest pivot point. Due to report earnings on the morning of Tuesday, August 2nd for the latest quarter ended June 30, 2011.
>>> The latest Featured Stock Update with an annotated graph appeared on 7/11/2011. Click here.
View all notes |
Alert me of new notes |
CANSLIM.net Company Profile |
SEC |
Zacks Reports |
StockTalk |
News |
Chart |
Request a new note
C
A N
S L
I M
|
IPCM
-
NASDAQ
I P C The Hospitalist Co
HEALTH SERVICES - Hospitals
|
$49.87
|
-1.06
-2.08% |
$50.85
|
134,236
152.20% of 50 DAV
50 DAV is 88,200
|
$52.25
-4.56%
|
7/25/2011
|
$51.40
|
PP = $52.35
|
|
MB = $54.97
|
Most Recent Note - 7/27/2011 5:37:55 PM
Y - Today marked its 3rd consecutive small loss with above average volume, encountering distributional pressure while churning near its all-time high. Due to report earnings after the close on Thursday, July 28th. Formed an orderly saucer shaped base. In the 7/25/11 mid-day report its color code was changed to yellow with pivot point cited based on its 52-week high plus 10 cents. Small supply (S criteria) of only 16.4 million outstanding shares can contribute to greater volatility. See the latest FSU analysis for more details and an annotated graph.
>>> The latest Featured Stock Update with an annotated graph appeared on 7/25/2011. Click here.
View all notes |
Alert me of new notes |
CANSLIM.net Company Profile |
SEC |
Zacks Reports |
StockTalk |
News |
Chart |
Request a new note
C
A N
S L
I M
|
LULU
-
NASDAQ
Lululemon Athletica
MANUFACTURING - Textile Manufacturing
|
$61.00
|
-1.86
-2.96% |
$62.45
|
2,705,824
65.44% of 50 DAV
50 DAV is 4,134,800
|
$64.49
-5.41%
|
6/21/2011
|
$102.95
|
PP = $101.14
|
|
MB = $106.20
|
Most Recent Note - 7/27/2011 5:40:22 PM
G - Still hovering near its all-time high with volume totals generally cooling, very extended from a sound base. Its 50 DMA line and prior resistance define support in the $51-52 area. A 2:1 split effective 7/12/11 impacted prices (prior Featured Price, Pivot Point, and Max Buy levels will soon be adjusted).
>>> The latest Featured Stock Update with an annotated graph appeared on 7/15/2011. Click here.
View all notes |
Alert me of new notes |
CANSLIM.net Company Profile |
SEC |
Zacks Reports |
StockTalk |
News |
Chart |
Request a new note
C
A N
S L
I M
|
Symbol/Exchange
Company Name
Industry Group |
PRICE |
CHANGE
(%Change) |
Day High |
Volume
(% DAV)
(% 50 day avg vol) |
52 Wk Hi
% From Hi |
Featured
Date |
Price
Featured |
Pivot Featured |
|
Max Buy |
MWIV
-
NASDAQ
M W I Veterinary Supply
HEALTH SERVICES - Medical Instruments and; Supplies
|
$80.20
|
+0.71
0.89% |
$81.12
|
186,875
309.40% of 50 DAV
50 DAV is 60,400
|
$86.99
-7.81%
|
7/11/2011
|
$83.39
|
PP = $84.67
|
|
MB = $88.90
|
Most Recent Note - 7/27/2011 5:42:02 PM
G - Posted a gain today with heavy volume three times average. Distributional pressure led to a slump below its 50 DMA line recently raising concerns, and its color code was changed to green. Volume-driven gains did not recently confirm a proper technical buy signal. Due to report earnings on the morning of Thursday, July 28th.
>>> The latest Featured Stock Update with an annotated graph appeared on 6/30/2011. Click here.
View all notes |
Alert me of new notes |
CANSLIM.net Company Profile |
SEC |
Zacks Reports |
StockTalk |
News |
Chart |
Request a new note
C
A N
S L
I M
|
OTEX
-
NASDAQ
Open Text Corp
INTERNET - Internet Software and Services
|
$68.03
|
-1.37
-1.97% |
$69.23
|
271,032
95.57% of 50 DAV
50 DAV is 283,600
|
$72.32
-5.93%
|
6/1/2011
|
$65.86
|
PP = $67.18
|
|
MB = $70.54
|
Most Recent Note - 7/27/2011 5:43:06 PM
Y - Still stubbornly holding its ground above its pivot point yet below its "max buy" level. It stalled after its 7/13/11 technical buy signal, with volume totals cooling since its negative reversal at its all-time high. Prior resistance near $66 defines important chart support to watch above its 50 DMA line.
>>> The latest Featured Stock Update with an annotated graph appeared on 7/20/2011. Click here.
View all notes |
Alert me of new notes |
CANSLIM.net Company Profile |
SEC |
Zacks Reports |
StockTalk |
News |
Chart |
Request a new note
C
A N
S L
I M
|
PRGO
-
NASDAQ
Perrigo Co
DRUGS - Drug Related Products
|
$91.22
|
-2.46
-2.63% |
$93.64
|
440,348
98.45% of 50 DAV
50 DAV is 447,300
|
$94.61
-3.58%
|
7/13/2011
|
$92.89
|
PP = $92.40
|
|
MB = $97.02
|
Most Recent Note - 7/27/2011 5:45:43 PM
Y - A loss today with average volume led to a slump back just under its pivot point, raising concerns. A gain with sufficient volume did not recently confirm a proper technical buy signal. This riskier late-stage setup stalled after rallying to a new 52-week high. Some may have considered its 7/13/11 gain a technical breakout from a cup shaped base without a handle, but its close in the middle of the day's range left it short of its pivot point.
>>> The latest Featured Stock Update with an annotated graph appeared on 7/13/2011. Click here.
View all notes |
Alert me of new notes |
CANSLIM.net Company Profile |
SEC |
Zacks Reports |
StockTalk |
News |
Chart |
Request a new note
C
A N
S L
I M
|
PSMT
-
NASDAQ
Pricesmart Inc
RETAIL - Drug Stores
|
$57.39
|
-3.24
-5.34% |
$60.42
|
300,221
131.04% of 50 DAV
50 DAV is 229,100
|
$62.27
-7.84%
|
7/22/2011
|
$60.04
|
PP = $61.14
|
|
MB = $64.20
|
Most Recent Note - 7/27/2011 5:48:08 PM
Y - Concerns were raised while it was down considerably today with above average volume. Weak action along with a negative bias in the broader market (M criteria) hurts the near-term outlook. It did not trigger a proper buy signal since recently featured.
>>> The latest Featured Stock Update with an annotated graph appeared on 7/22/2011. Click here.
View all notes |
Alert me of new notes |
CANSLIM.net Company Profile |
SEC |
Zacks Reports |
StockTalk |
News |
Chart |
Request a new note
C
A N
S L
I M
|
QSII
-
NASDAQ
Quality Systems Inc
COMPUTER SOFTWARE and SERVICES - Healthcare Information Service
|
$86.17
|
-3.08
-3.45% |
$88.46
|
206,100
87.44% of 50 DAV
50 DAV is 235,700
|
$92.38
-6.72%
|
7/6/2011
|
$91.26
|
PP = $91.67
|
|
MB = $96.25
|
Most Recent Note - 7/27/2011 5:50:59 PM
G - Small gap down today for a 3rd consecutive loss with below average volume. Consolidating after failing to trigger a recent technical buy signal. Finished -6.7% from its all-time high, trading near its 50 DMA line and last week's lows defining important near-term support.
>>> The latest Featured Stock Update with an annotated graph appeared on 7/6/2011. Click here.
View all notes |
Alert me of new notes |
CANSLIM.net Company Profile |
SEC |
Zacks Reports |
StockTalk |
News |
Chart |
Request a new note
C
A N
S L
I M
|
Symbol/Exchange
Company Name
Industry Group |
PRICE |
CHANGE
(%Change) |
Day High |
Volume
(% DAV)
(% 50 day avg vol) |
52 Wk Hi
% From Hi |
Featured
Date |
Price
Featured |
Pivot Featured |
|
Max Buy |
UA
-
NYSE
Under Armour Inc Cl A
CONSUMER NON-DURABLES - Textile - Apparel Clothing
|
$72.05
|
-3.40
-4.51% |
$75.63
|
1,552,764
120.00% of 50 DAV
50 DAV is 1,294,000
|
$82.95
-13.14%
|
7/19/2011
|
$81.33
|
PP = $81.52
|
|
MB = $85.60
|
Most Recent Note - 7/27/2011 5:21:32 PM
G - Fell to its 50 DMA line today with a 6th consecutive loss. Did not confirm a proper technical buy signal since recently featured in yellow. Reported earnings +71% on +42% sales revenues for the quarter ended June 30, 2011 versus the year ago period, showing impressive acceleration in sales and earnings increases, sequentially. See latest FSU analysis for more details and a new annotated graph.
>>> The latest Featured Stock Update with an annotated graph appeared on 7/26/2011. Click here.
View all notes |
Alert me of new notes |
CANSLIM.net Company Profile |
SEC |
Zacks Reports |
StockTalk |
News |
Chart |
Request a new note
C
A N
S L
I M
|
ULTA
-
NASDAQ
Ulta Salon Cosm & Frag
SPECIALTY RETAIL - Specialty Retail, Other
|
$62.08
|
-2.86
-4.40% |
$64.66
|
691,061
75.77% of 50 DAV
50 DAV is 912,100
|
$68.80
-9.77%
|
1/6/2011
|
$36.12
|
PP = $37.34
|
|
MB = $39.21
|
Most Recent Note - 7/27/2011 5:23:45 PM
G - Volume picked up but was still below average behind today's loss while it slumped under prior lows toward its 50 DMA line. It rallied +200% since first featured in yellow at $22.81 in the 3/12/10 mid-day report.
>>> The latest Featured Stock Update with an annotated graph appeared on 7/14/2011. Click here.
View all notes |
Alert me of new notes |
CANSLIM.net Company Profile |
SEC |
Zacks Reports |
StockTalk |
News |
Chart |
Request a new note
C
A N
S L
I M
|
ZAGG
-
NASDAQ
Zagg Inc
SPECIALTY RETAIL - Specialty Retail, Other
|
$15.35
|
-1.04
-6.35% |
$16.35
|
2,091,532
86.76% of 50 DAV
50 DAV is 2,410,600
|
$16.90
-9.17%
|
6/1/2011
|
$10.92
|
PP = $10.59
|
|
MB = $11.12
|
Most Recent Note - 7/27/2011 5:19:31 PM
G - Down today with higher (near average) volume. Extended from a sound base. No overhead supply remains to act as resistance, however its short V shaped consolidation in recent weeks is not recognized as a sound base pattern. Its 50 DMA line and recent lows define chart support.
>>> The latest Featured Stock Update with an annotated graph appeared on 7/19/2011. Click here.
View all notes |
Alert me of new notes |
CANSLIM.net Company Profile |
SEC |
Zacks Reports |
StockTalk |
News |
Chart |
Request a new note
C
A N
S L
I M
|
|
|
|
THESE ARE NOT BUY RECOMMENDATIONS!
Comments contained in the body of this report are technical
opinions only. The material herein has been obtained
from sources believed to be reliable and accurate, however,
its accuracy and completeness cannot be guaranteed.
This site is not an investment advisor, hence it does
not endorse or recommend any securities or other investments.
Any recommendation contained in this report may not
be suitable for all investors and it is not to be deemed
an offer or solicitation on our part with respect to
the purchase or sale of any securities. All trademarks,
service marks and trade names appearing in this report
are the property of their respective owners, and are
likewise used for identification purposes only.
This report is a service available
only to active Paid Premium Members.
You may opt-out of receiving report notifications
at any time. Questions or comments may be submitted
by writing to Premium Membership Services 665 S.E. 10 Street, Suite 201 Deerfield Beach, FL 33441-5634 or by calling 1-800-965-8307
or 954-785-1121.
|
|
|

