You are not logged in.
This means you
CAN ONLY VIEW reports that were published prior to Monday, April 14, 2025.
You
MUST UPGRADE YOUR MEMBERSHIP if you want to see any current reports.
AFTER MARKET UPDATE - THURSDAY, JULY 26TH, 2012
Previous After Market Report Next After Market Report >>>
|
|
|
|
DOW |
+211.65 |
12,887.70 |
+1.67% |
|
Volume |
897,886,300 |
+15% |
|
Volume |
1,880,071,270 |
+11% |
|
NASDAQ |
+39.01 |
2,893.25 |
+1.37% |
|
Advancers |
2,247 |
71% |
|
Advancers |
1,615 |
62% |
|
S&P 500 |
+22.12 |
1,360.01 |
+1.65% |
|
Decliners |
823 |
26% |
|
Decliners |
852 |
33% |
|
Russell 2000 |
+7.80 |
777.11 |
+1.01% |
|
52 Wk Highs |
170 |
|
|
52 Wk Highs |
44 |
|
|
S&P 600 |
+4.20 |
436.35 |
+0.97% |
|
52 Wk Lows |
58 |
|
|
52 Wk Lows |
83 |
|
|
 |
Major Averages Posted Solid Gains With Volume Increase
Kenneth J. Gruneisen - Passed the CAN SLIM® Master's Exam
The major averages ended with solid gains at the closing bell on Thursday. The volume totals behind the gains were reported higher on the NYSE and on the Nasdaq exchange versus the prior session totals, indicating that institutional investors were accumulating shares. Advancing issues led decliners by nearly a 3-1 margin on the NYSE and by almost a 2-1 ratio on the Nasdaq exchange. The total number of new 52-week highs led new 52-week lows on the NYSE, however new lows solidly outnumbered new highs on the Nasdaq exchange again. There were 36 high-ranked companies from the CANSLIM.net Leaders List made new 52-week highs and appeared on the CANSLIM.net BreakOuts Page, up considerably from the prior session total of 9 stocks. There were gains for 8 of the 13 high-ranked companies currently included on the Featured Stocks Page.
The major averages jumped at the opening bell as investors responded to positive comments from the ECB, stronger-than-expected economic data. In Europe, Central Bank President Mario Draghi said policy makers will do everything in their power to defend the euro, leading some to speculate on further bond buying. On our shores, economic data boosted optimism after weekly jobless claims unexpectedly declined and durable goods orders rose more than expected.
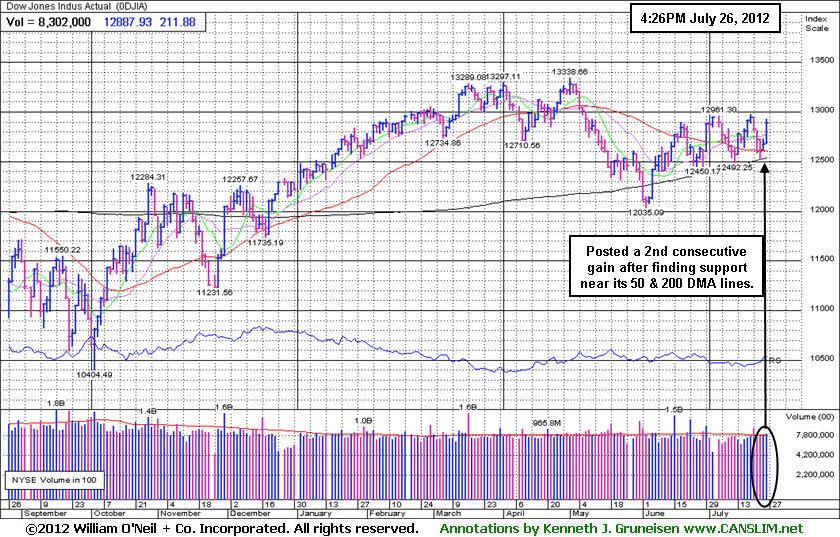
The Nasdaq Composite Index and S&P 500 Index's gains may be considered "Day 1" of a new rally attempt, meanwhile the Dow posted a 2nd consecutive gain. All of the major averages are trading above their respective 50-day moving average lines. All 10 sectors on the S&P finished higher, led by a rally in telecom stocks. Shares of Sprint Nextel Corp (S +20.18%) rallied after the company posted a better-than-expected earnings report. Also among earnings, Whole Foods Market Inc (WFM +11.32%) and Visa Inc (V +3.74%) advanced following their quarterly reports. On the downside, shares of Dow Chemical Co (DOW -3.60%) fell and Zynga Inc (ZNGA -37.48%) fell following their weaker-than-projected profit tallies.
Turning to fixed income, Treasuries were lower along the curve. The benchmark 10-year note was down 5/16 of a point to yield 1.44% and the 30-year bond gave up a point to yield 2.50%.
Damaging distribution coupled with waning leadership has cut short the market's latest confirmed rally and arguably put the major averages back into a "correction". In terms of the M criteria, investors will need to watch for the major averages to produce a new follow-through day to again confirm that odds are favorable for new buying efforts. In the meanwhile, investors are reminded to ALWAYS limit losses if ever any stock falls more than -7% from their purchase price to steadfastly protect precious capital. Following strict selling rules forces investors to reduce their market exposure and raise cash levels during market downturns.
In August we will begin providing all currently upgraded members access to new monthly webcasts! A new "Market's Leading Groups" archives tab will also soon be added on the Premium Member Homepage. These changes are aimed at satisfying member requests and improving the service. If you have questions, comments or suggestions please let us know via the inquiry form here. The most recent WEBCAST (Q2 2012) is available "ON DEMAND" - CLICK HERE.
PICTURED: The Dow Jones Industrial Average posted a 2nd consecutive gain since finding support near its 50-day moving average (DMA) line and 200 DMA line defining an important support level well above its June 4th low.
|
 Kenneth J. Gruneisen started out as a licensed stockbroker in August 1987, a couple of months prior to the historic stock market crash that took the Dow Jones Industrial Average down -22.6% in a single day. He has published daily fact-based fundamental and technical analysis on high-ranked stocks online for two decades. Through FACTBASEDINVESTING.COM, Kenneth provides educational articles, news, market commentary, and other information regarding proven investment systems that work in good times and bad.
Comments contained in the body of this report are technical opinions only and are not necessarily those of Gruneisen Growth Corp. The material herein has been obtained from sources believed to be reliable and accurate, however, its accuracy and completeness cannot be guaranteed. Our firm, employees, and customers may effect transactions, including transactions contrary to any recommendation herein, or have positions in the securities mentioned herein or options with respect thereto. Any recommendation contained in this report may not be suitable for all investors and it is not to be deemed an offer or solicitation on our part with respect to the purchase or sale of any securities. |
|
 |
Energy-Related Groups Led Widespread Gains
Kenneth J. Gruneisen - Passed the CAN SLIM® Master's Exam
The Healthcare Index ($HMO -0.38%) edged lower on Thursday while most industry groups traded higher. The Retail Index ($RLX +1.43%) was on the rise along with financial shares as the Broker/Dealer Index ($XBD +1.23%) and Bank Index ($BKX +1.66%) also helped underpin the major averages' gains. The tech sector saw solid gains from the Internet Index ($IIX +2.02%), Semiconductor Index ($SOX +2.29%), and the Biotechnology Index ($BTK +1.70%) while the Networking Index ($NWX +0.38%) lagged. Commodity-linked groups were on the rise and the Gold & Silver Index ($XAU +1.97%) and Integrated Oil Index ($XOI +2.35%) tallied solid gains.
Charts courtesy www.stockcharts.com
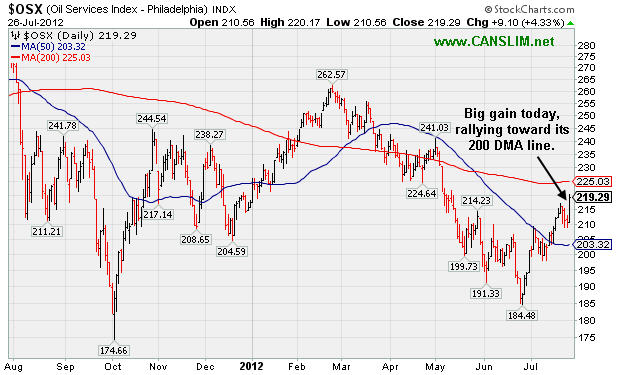
PICTURED: The Oil Services Index ($OSX +4.33%) was a standout with a big gain helping it rally toward its 200-day moving average (DMA) line.
| Oil Services |
$OSX |
219.29 |
+9.10 |
+4.33% |
+1.39% |
| Healthcare |
$HMO |
2,281.87 |
-8.80 |
-0.38% |
+0.01% |
| Integrated Oil |
$XOI |
1,191.14 |
+27.33 |
+2.35% |
-3.09% |
| Semiconductor |
$SOX |
375.54 |
+8.41 |
+2.29% |
+3.05% |
| Networking |
$NWX |
188.44 |
+0.71 |
+0.38% |
-12.42% |
| Internet |
$IIX |
294.69 |
+5.83 |
+2.02% |
+4.60% |
| Broker/Dealer |
$XBD |
81.35 |
+0.99 |
+1.23% |
-2.30% |
| Retail |
$RLX |
611.02 |
+8.60 |
+1.43% |
+16.79% |
| Gold & Silver |
$XAU |
149.98 |
+2.90 |
+1.97% |
-16.97% |
| Bank |
$BKX |
45.40 |
+0.74 |
+1.66% |
+15.29% |
| Biotech |
$BTK |
1,485.85 |
+24.82 |
+1.70% |
+36.14% |
|
|
|
 |
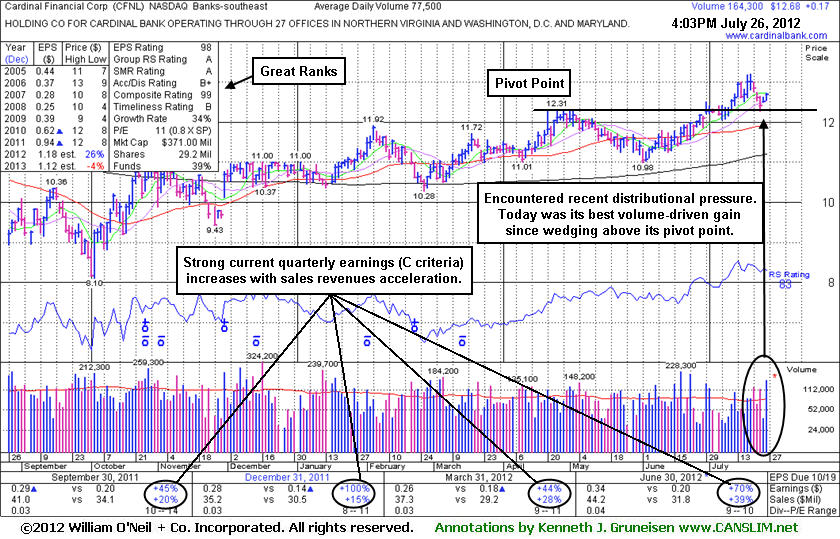
Posted Volume-Driven Gain Following Strong Earnings
Kenneth J. Gruneisen - Passed the CAN SLIM® Master's Exam
Cardinal Financial Corp (CFNL +$0.17 or +1.36% to $12.68) had encountered some distributional pressure since featured in the 7/20/12 mid-day report (read here). Today was its best volume-driven gain above its pivot point thus far, and no resistance remains due to overhead supply. It reported earnings +70% on +39% sales revenues for the quarter ended June 30, 2012 versus the year ago period. Sequentially, its recent quarterly comparisons show encouraging sales revenues acceleration. It has earned high ranks and matches favorably with the C and A criteria. The number of top-rated funds owning its shares rose from 172 in Sep '11 to 184 in Jun '12, a reassuring sign concerning the I criteria. Its current Up/Down Volume Ratio of 2.0 is an unbiased indication its shares have been under accumulation over the past 50 days. Its small supply (S criteria) of only 29.2 millions shares outstanding is a favorable characteristic, yet it can contribute to greater price volatility in the event of institutional accumulation or distributional pressure.
Careful investors may consider a tactic they teach in the Certification called "pyramiding" to let market action dictate buying efforts. One overriding concern, however, is that the M criteria now argues against any new buying efforts until the major averages confirm a new rally with another follow-through day.
|
|
|
Color Codes Explained :
Y - Better candidates highlighted by our
staff of experts.
G - Previously featured
in past reports as yellow but may no longer be buyable under the
guidelines.
***Last / Change / Volume data in this table is the closing quote data***
Symbol/Exchange
Company Name
Industry Group |
PRICE |
CHANGE
(%Change) |
Day High |
Volume
(% DAV)
(% 50 day avg vol) |
52 Wk Hi
% From Hi |
Featured
Date |
Price
Featured |
Pivot Featured |
|
Max Buy |
ALXN
-
NASDAQ
Alexion Pharmaceuticals
DRUGS - Drug Manufacturers - Other
|
$106.14
|
+1.01
0.96% |
$108.87
|
2,629,905
115.15% of 50 DAV
50 DAV is 2,283,900
|
$105.32
0.78%
|
5/1/2012
|
$91.73
|
PP = $95.11
|
|
MB = $99.87
|
Most Recent Note - 7/25/2012 5:00:17 PM
G - Finished near the session high with a considerable gain backed by +40% above average volume. Color code is changed to green after rallying well above its "max buy"level. Reported earnings +62% on +48% sales revenues for the quarter ended June 30, 2012 versus the year ago period. Found support near its 50 DMA line and prior resistance in the $95 area. See the latest FSU analysis for more details and a new annotated graph.
>>> The latest Featured Stock Update with an annotated graph appeared on 7/25/2012. Click here.
View all notes |
Alert me of new notes |
CANSLIM.net Company Profile |
SEC |
Zacks Reports |
StockTalk |
News |
Chart |
Request a new note
C
A N
S L
I M


|
ASPS
-
NASDAQ
Altisource Ptf Sltns Sa
REAL ESTATE - Property Management/Developmen
|
$72.80
|
-1.62
-2.18% |
$75.28
|
185,729
144.20% of 50 DAV
50 DAV is 128,800
|
$76.40
-4.71%
|
6/5/2012
|
$60.01
|
PP = $63.00
|
|
MB = $66.15
|
 Most Recent Note - 7/26/2012 3:44:52 PM
G - Down today with above average volume. It is extended from its prior base, and its recent low and its 50 DMA line define near-term support to watch. Reported earnings +117% on +55% sales revenues for the quarter ended June 30, 2012 versus the year ago period.
>>> The latest Featured Stock Update with an annotated graph appeared on 7/3/2012. Click here.
View all notes |
Alert me of new notes |
CANSLIM.net Company Profile |
SEC |
Zacks Reports |
StockTalk |
News |
Chart |
Request a new note
C
A N
S L
I M
|
CFNL
-
NASDAQ
Cardinal Financial Corp
BANKING - Regional - Southeast Banks
|
$12.68
|
+0.17
1.36% |
$12.72
|
167,111
215.63% of 50 DAV
50 DAV is 77,500
|
$13.21
-4.01%
|
7/20/2012
|
$12.85
|
PP = $12.41
|
|
MB = $13.03
|
Most Recent Note - 7/26/2012 5:05:24 PM
Y - Today was its best volume-driven gain above its pivot point thus far. It encountered distributional pressure after featured in the 7/20/12 mid-day report. See the latest FSU analysis for more details and a new annotated graph.
>>> The latest Featured Stock Update with an annotated graph appeared on 7/26/2012. Click here.
View all notes |
Alert me of new notes |
CANSLIM.net Company Profile |
SEC |
Zacks Reports |
StockTalk |
News |
Chart |
Request a new note
C
A N
S L
I M
|
CMCSA
-
NASDAQ
Comcast Corp Cl A
MEDIA - CATV Systems
|
$31.61
|
+0.25
0.78% |
$32.25
|
17,483,544
131.66% of 50 DAV
50 DAV is 13,279,300
|
$32.78
-3.58%
|
6/11/2012
|
$29.94
|
PP = $30.98
|
|
MB = $32.53
|
Most Recent Note - 7/25/2012 5:55:05 PM
Y - Volume totals have been quiet or average while recently holding its ground above its pivot point. No overhead supply remains to act as resistance and it is still trading below its "max buy" level.
>>> The latest Featured Stock Update with an annotated graph appeared on 7/11/2012. Click here.
View all notes |
Alert me of new notes |
CANSLIM.net Company Profile |
SEC |
Zacks Reports |
StockTalk |
News |
Chart |
Request a new note
C
A N
S L
I M
|
DG
-
NYSE
Dollar General Corp
RETAIL - Discount, Variety Stores
|
$51.28
|
-0.01
-0.02% |
$51.97
|
4,110,565
104.20% of 50 DAV
50 DAV is 3,945,000
|
$56.04
-8.49%
|
7/16/2012
|
$54.68
|
PP = $56.14
|
|
MB = $58.95
|
Most Recent Note - 7/25/2012 5:57:33 PM
Y - Gapped down today for as loss but rebounded to finish near the session high and closed just above its 50 DMA line after encountering distributional pressure. It did not register volume-driven gains above its new pivot point to trigger a new (or add-on) technical buy signal.
>>> The latest Featured Stock Update with an annotated graph appeared on 7/12/2012. Click here.
View all notes |
Alert me of new notes |
CANSLIM.net Company Profile |
SEC |
Zacks Reports |
StockTalk |
News |
Chart |
Request a new note
C
A N
S L
I M
|
Symbol/Exchange
Company Name
Industry Group |
PRICE |
CHANGE
(%Change) |
Day High |
Volume
(% DAV)
(% 50 day avg vol) |
52 Wk Hi
% From Hi |
Featured
Date |
Price
Featured |
Pivot Featured |
|
Max Buy |
EXPE
-
NASDAQ
Expedia Inc
INTERNET - Internet Information Providers
|
$45.71
|
+1.46
3.30% |
$45.94
|
6,388,251
171.63% of 50 DAV
50 DAV is 3,722,200
|
$50.66
-9.77%
|
4/27/2012
|
$41.80
|
PP = $35.57
|
|
MB = $37.35
|
Most Recent Note - 7/26/2012 3:40:33 PM
G - Rebounding today with above average volume behind its gain while approaching its 50 DMA line which may now act as a resistance level. Prior low ($43.44 on 7/13/12) defines the next important support level to watch.
>>> The latest Featured Stock Update with an annotated graph appeared on 7/10/2012. Click here.
View all notes |
Alert me of new notes |
CANSLIM.net Company Profile |
SEC |
Zacks Reports |
StockTalk |
News |
Chart |
Request a new note
C
A N
S L
I M
|
GNC
-
NYSE
G N C Holdings Inc
RETAIL - Drug Stores
|
$37.11
|
-0.78
-2.06% |
$41.01
|
9,676,739
421.63% of 50 DAV
50 DAV is 2,295,100
|
$42.70
-13.09%
|
6/29/2012
|
$39.20
|
PP = $40.00
|
|
MB = $42.00
|
Most Recent Note - 7/26/2012 11:44:25 AM
G - Trading in a wide range today after it reported earnings that beat expectations and raised guidance for FY '12. Now consolidating under its 50 DMA line which may act as a resistance level. Disciplined investors always limit losses if any stock falls more than -7% from their purchase price.
>>> The latest Featured Stock Update with an annotated graph appeared on 7/5/2012. Click here.
View all notes |
Alert me of new notes |
CANSLIM.net Company Profile |
SEC |
Zacks Reports |
StockTalk |
News |
Chart |
Request a new note
C
A N
S L
I M
|
GPX
-
NYSE
G P Strategies Corp
DIVERSIFIED SERVICES - Education and Training Services
|
$17.18
|
+0.05
0.29% |
$17.60
|
46,170
80.86% of 50 DAV
50 DAV is 57,100
|
$18.99
-9.53%
|
6/29/2012
|
$18.01
|
PP = $18.15
|
|
MB = $19.06
|
Most Recent Note - 7/26/2012 3:50:30 PM
Y - Volume totals have been cooling while consolidating above its 50 DMA line. Recent losses completely negated the prior breakout and raised concerns. Disciplined investors always limit losses by selling any stock if it falls more than -7% from their purchase price.
>>> The latest Featured Stock Update with an annotated graph appeared on 7/6/2012. Click here.
View all notes |
Alert me of new notes |
CANSLIM.net Company Profile |
SEC |
Zacks Reports |
StockTalk |
News |
Chart |
Request a new note
C
A N
S L
I M
|
N
-
NYSE
Netsuite Inc
DIVERSIFIED SERVICES - Business/Management Services
|
$49.42
|
+0.43
0.88% |
$50.65
|
819,218
143.22% of 50 DAV
50 DAV is 572,000
|
$56.06
-11.84%
|
6/20/2012
|
$51.83
|
PP = $51.88
|
|
MB = $54.47
|
Most Recent Note - 7/26/2012 3:52:17 PM
Y - Holding its ground today near its 50 DMA line which defines important near-term support. More damaging losses would raise serious concerns and trigger a worrisome technical sell signal.
>>> The latest Featured Stock Update with an annotated graph appeared on 7/19/2012. Click here.
View all notes |
Alert me of new notes |
CANSLIM.net Company Profile |
SEC |
Zacks Reports |
StockTalk |
News |
Chart |
Request a new note
C
A N
S L
I M
|
NSM
-
NYSE
Nationstar Mtg Hldgs Inc
FINANCIAL SERVICES - Credit Services
|
$21.90
|
-0.62
-2.75% |
$22.87
|
805,372
99.95% of 50 DAV
50 DAV is 805,800
|
$25.11
-12.78%
|
6/27/2012
|
$20.29
|
PP = $20.46
|
|
MB = $21.48
|
Most Recent Note - 7/26/2012 3:48:30 PM
G - Pulling back for a 3rd consecutive loss since proposing an Offering of $100 million of Senior Notes. It has recently been noted - "Extended from its prior base. Prior highs and its 50 DMA line in the $20 area define important support to watch on pullbacks."
>>> The latest Featured Stock Update with an annotated graph appeared on 6/27/2012. Click here.
View all notes |
Alert me of new notes |
CANSLIM.net Company Profile |
SEC |
Zacks Reports |
StockTalk |
News |
Chart |
Request a new note
C
A N
S L
I M
|
Symbol/Exchange
Company Name
Industry Group |
PRICE |
CHANGE
(%Change) |
Day High |
Volume
(% DAV)
(% 50 day avg vol) |
52 Wk Hi
% From Hi |
Featured
Date |
Price
Featured |
Pivot Featured |
|
Max Buy |
SWI
-
NYSE
Solarwinds Inc
COMPUTER SOFTWARE and SERVICES - Application Software
|
$52.91
|
+3.43
6.93% |
$53.11
|
2,847,269
268.56% of 50 DAV
50 DAV is 1,060,200
|
$50.00
5.82%
|
7/25/2012
|
$47.82
|
PP = $47.89
|
|
MB = $50.28
|
Most Recent Note - 7/26/2012 12:40:54 PM
G - Gapped up today and rallied beyond its "max buy" level with above average volume behind its 2nd consecutive gain, and its color code was changed to green after quickly getting extended. Reported earnings +50% on +40% sales revenues for the quarter ended June 30, 2012 versus the year ago period. Gapped up on the prior session and spiked to a new 52-week high, finishing strong with a considerable gain backed by 4 times average volume. It was rallying above its 50 DMA line and on the rise when highlighted in yellow in 7/25/12 mid-day report (read here) with new pivot point cited based on its 6/19/12 high while rallying from a "double bottom" base pattern and noted - "It has shown resilience since dropped on 7/09/12 from the Featured Stocks list. A strong finish above its pivot point may clinch a technical buy signal, however the M criteria now argues against any new buying efforts until the major averages confirm a new rally with another follow-through day."
>>> The latest Featured Stock Update with an annotated graph appeared on 6/15/2012. Click here.
View all notes |
Alert me of new notes |
CANSLIM.net Company Profile |
SEC |
Zacks Reports |
StockTalk |
News |
Chart |
Request a new note
C
A N
S L
I M
|
TDG
-
NYSE
Transdigm Group Inc
AEROSPACE/DEFENSE - Aerospace/Defense Products and; Services
|
$120.07
|
-0.18
-0.15% |
$122.68
|
352,896
70.88% of 50 DAV
50 DAV is 497,900
|
$136.34
-11.93%
|
6/18/2012
|
$127.00
|
PP = $132.79
|
|
MB = $139.43
|
Most Recent Note - 7/25/2012 5:51:08 PM
G - Held its ground today following a damaging loss on 7/24/12 with heavy volume that violated its 50 DMA line triggering a technical sell signal.
>>> The latest Featured Stock Update with an annotated graph appeared on 7/18/2012. Click here.
View all notes |
Alert me of new notes |
CANSLIM.net Company Profile |
SEC |
Zacks Reports |
StockTalk |
News |
Chart |
Request a new note
C
A N
S L
I M
|
VSI
-
NYSE
Vitamin Shoppe Inc
SPECIALTY RETAIL - Specialty Retail, Other
|
$56.98
|
+1.51
2.72% |
$58.49
|
511,215
137.98% of 50 DAV
50 DAV is 370,500
|
$58.22
-2.13%
|
6/29/2012
|
$54.93
|
PP = $55.03
|
|
MB = $57.78
|
Most Recent Note - 7/26/2012 12:50:18 PM
Y - Erased most of today's early gain after touching a new high and briefly trading above its "max buy" level. Found support at its 50 DMA line this week, but any damaging violation would raise concerns and trigger a technical sell signal. Recent gains after forming an 8-week cup-with-handle base lacked the volume required to trigger a proper new (or add-on) technical buy signal.
>>> The latest Featured Stock Update with an annotated graph appeared on 7/2/2012. Click here.
View all notes |
Alert me of new notes |
CANSLIM.net Company Profile |
SEC |
Zacks Reports |
StockTalk |
News |
Chart |
Request a new note
C
A N
S L
I M
|
|
|
|
THESE ARE NOT BUY RECOMMENDATIONS!
Comments contained in the body of this report are technical
opinions only. The material herein has been obtained
from sources believed to be reliable and accurate, however,
its accuracy and completeness cannot be guaranteed.
This site is not an investment advisor, hence it does
not endorse or recommend any securities or other investments.
Any recommendation contained in this report may not
be suitable for all investors and it is not to be deemed
an offer or solicitation on our part with respect to
the purchase or sale of any securities. All trademarks,
service marks and trade names appearing in this report
are the property of their respective owners, and are
likewise used for identification purposes only.
This report is a service available
only to active Paid Premium Members.
You may opt-out of receiving report notifications
at any time. Questions or comments may be submitted
by writing to Premium Membership Services 665 S.E. 10 Street, Suite 201 Deerfield Beach, FL 33441-5634 or by calling 1-800-965-8307
or 954-785-1121.
|
|
|

