You are not logged in.
This means you
CAN ONLY VIEW reports that were published prior to Monday, April 14, 2025.
You
MUST UPGRADE YOUR MEMBERSHIP if you want to see any current reports.
AFTER MARKET UPDATE - FRIDAY, JULY 23RD, 2010
Previous After Market Report Next After Market Report >>>
|
|
|
|
DOW |
+102.32 |
10,424.62 |
+0.99% |
|
Volume |
1,151,013,290 |
-2% |
|
Volume |
2,383,305,450 |
+10% |
|
NASDAQ |
+23.58 |
2,269.47 |
+1.05% |
|
Advancers |
2,438 |
78% |
|
Advancers |
2,033 |
74% |
|
S&P 500 |
+8.99 |
1,102.66 |
+0.82% |
|
Decliners |
600 |
19% |
|
Decliners |
590 |
21% |
|
Russell 2000 |
+15.17 |
650.65 |
+2.39% |
|
52 Wk Highs |
185 |
|
|
52 Wk Highs |
78 |
|
|
S&P 600 |
+7.28 |
349.22 |
+2.13% |
|
52 Wk Lows |
15 |
|
|
52 Wk Lows |
41 |
|
|
 |
Breadth Positive As Leadership Expands To Sustain New Rally
Adam Sarhan, Contributing Writer,
Stocks ended higher this week as investors digested a slew of earnings and economic data. Volume, an important indicator of institutional sponsorship, was reported slightly higher than Thursday's totals on the Nasdaq exchange but slightly lower on the NYSE while the major averages ended unanimously higher. Advancers trumped decliners by a 4-to-1 ratio and new 52-week highs outnumbered new 52-week lows on both major exchanges. There were 39 high-ranked companies from the CANSLIM.net Leaders List that made a new 52-week high and appeared on the CANSLIM.net BreakOuts Page, higher from the 23 issues that appeared on the prior session.
Stocks ended higher on Monday after the National Association of Home Builders/Wells Fargo confidence index slid to 14 in July which is the the lowest reading since April 2009 and down from last month's reading of 16. Any reading below 50 means that respondents consider the current environment as poor. Over the next few weeks, it will be very interesting to see how companies fared last quarter and, equally important, to see how the market reacts to the numbers. Analysts believe that Q2 earnings for S&P 500 companies rose +34%. So far, the reaction has been positive.
Stocks ended higher on Tuesday after several high profile companies released their Q2 results. Initially, stocks opened lower due to a general disappointment with their numbers but the bulls showed up in the second half of the session which was an encouraging sign. A slew of housing stocks rallied after building permits rose last month. However, housing starts, which measure new production, fell in June to their lowest level since October after the government tax incentive expired.
Stocks got hit on Wednesday after President Obama signed into law the Dodd-Frank Wall Street Reform and Consumer Protection Act while Federal Reserve Chairman Ben Bernanke testified on Capitol Hill and a slew of earnings were released. On Thursday, the major averages vaulted above their two month downward trendlines and their respective 50 DMA lines which was a very healthy sign. The large rally was sparked after healthy economic data was released from Europe. The strong economic data helped allay concerns that an economic slowdown may derail the global recovery. Stocks ended higher on Friday after the latest round of large cap earnings were released and the results of the European "stress test" were mild.
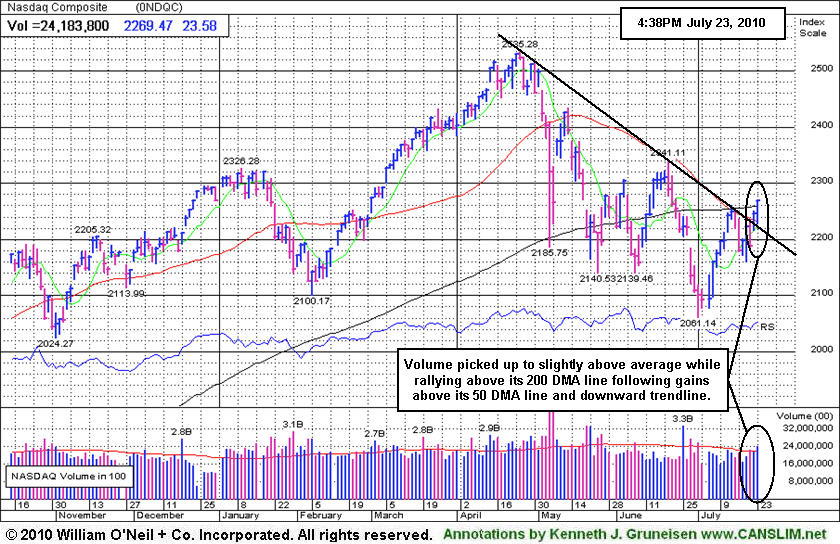
It was a very constructive week on Wall Street as all the major averages traded above their respective 2-month downward trendlines and their respective 50-day moving average (DMA) lines. It was also encouraging to see the Dow Jones Industrial Average & and the tech-heavy Nasdaq Composite rally for closes above their longer term downward sloping 200 DMA lines. There is no point in fighting the tape, as the bulls deserve the bullish benefit of the doubt for now. Trade accordingly.
PICTURED: The Nasdaq Composite Index saw volume increase to an above average total as the tech-heavy index rallied to close above its 200 DMA after clearing its 50 DMA and downward trendline on the prior session.
|
|
|
 |
Financial Indexes Not As Technically Strong As Broader Averages
Kenneth J. Gruneisen - Passed the CAN SLIM® Master's Exam
Influential gains from the Broker/Dealer Index ($XBD +0.75%) and Bank Index ($BKX +0.61%) helped underpin the major averages' gains on Friday. The Retail Index ($RLX +0.88%) and tech shares also rose as the Biotechnology Index ($BTK +1.53%) and Internet Index ($IIX +1.61%) outpaced the Semiconductor Index ($SOX +0.52%) and Networking Index ($NWX +0.64%). Defensive areas showed relatively sluggish performances as the Healthcare Index ($HMO +0.22%) and Gold & Silver Index ($XAU +0.63%) posted modest gains. Meanwhile, energy-related shares were mixed with the Oil Services Index ($OSX -0.32%) edging lower and Integrated Oil Index ($XOI +0.71%) finishing higher.
Charts courtesy www.stockcharts.com
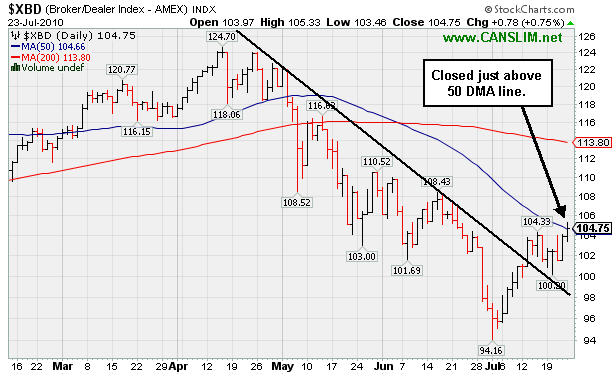
PICTURED: The Broker/Dealer Index ($XBD +0.75%) closed just above its 50-day moving average (DMA) line. Keep in mind that the Bank Index ($BKX +0.61%) is still struggling below its 50 and 200 DMA lines today. When financial stocks are in technically weak shape, the broader market has a greater tendency to get into trouble.
| Oil Services |
$OSX |
179.53 |
-0.57 |
-0.32% |
-7.90% |
| Healthcare |
$HMO |
1,418.50 |
+3.18 |
+0.22% |
-3.70% |
| Integrated Oil |
$XOI |
969.86 |
+6.82 |
+0.71% |
-9.21% |
| Semiconductor |
$SOX |
364.53 |
+1.87 |
+0.52% |
+1.28% |
| Networking |
$NWX |
246.64 |
+1.57 |
+0.64% |
+6.74% |
| Internet |
$IIX |
246.95 |
+3.92 |
+1.61% |
+5.60% |
| Broker/Dealer |
$XBD |
104.75 |
+0.78 |
+0.75% |
-8.96% |
| Retail |
$RLX |
408.17 |
+3.55 |
+0.88% |
-0.72% |
| Gold & Silver |
$XAU |
173.42 |
+1.08 |
+0.63% |
+3.07% |
| Bank |
$BKX |
47.93 |
+0.29 |
+0.61% |
+12.22% |
| Biotech |
$BTK |
1,052.12 |
+15.82 |
+1.53% |
+11.68% |
|
|
|
 |
V-Shaped Pattern Not An Ideal Base
Kenneth J. Gruneisen - Passed the CAN SLIM® Master's Exam
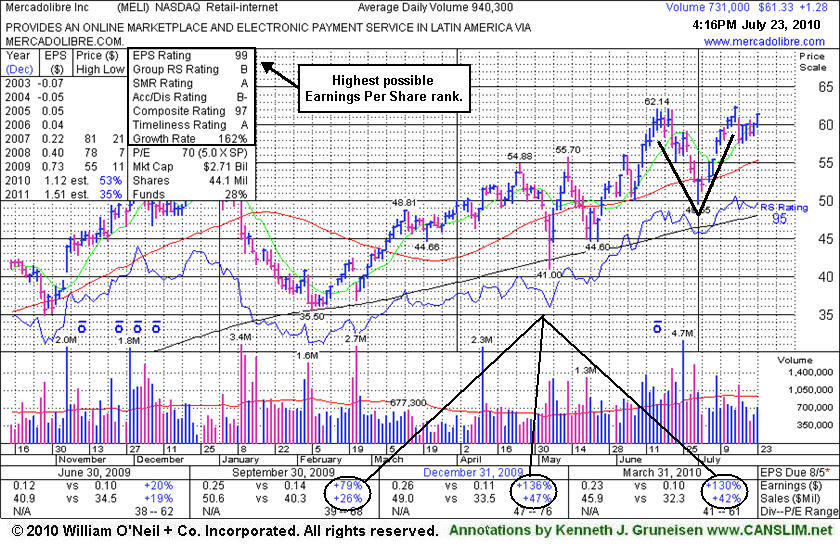
Mercadolibre Inc. (MELI +$1.42 or +2.36% to $61.47) finished at its second highest close of the year. Gains with light volume have followed a considerable 7/16/10 loss with above average volume. Recently it was noted as it wedged to new 52-week high territory with quiet volume behind its gains. Its current chart pattern has a sloppy "V" shape and is not a sound base of sufficient length, so patience is needed to see if a proper base will form. Meanwhile, the number of top-rated funds owning an interest fell from 95 in Mar '10 to 89 in Jun '10, a somewhat discouraging sign concerning the I criteria.
It found prompt support near its 50-day moving average (DMA) line, an encouraging sign after it encountered distributional pressure in late June. Worrisome action had erased all of its gains since it was shown in this FSU section on 6/10/10 under the headline Strong Finish On High Volume Triggers Technical Buy an annotated graph illustrated the bullish action as it "surged in the final hour of today's session and hit a new 52-week high with a considerable gain above its pivot point on volume backed by +79% above average, triggering a technical buy signal."
The Latin American Internet - eCommerce firm was featured in yellow in the 5/13/10 mid-day report (read here). It found great support at its long-term 200-day moving average (DMA) line on pullbacks this year, an encouraging sign. Its strong quarterly earnings and annual earnings history satisfy the C and A criteria.
|
|
|
Color Codes Explained :
Y - Better candidates highlighted by our
staff of experts.
G - Previously featured
in past reports as yellow but may no longer be buyable under the
guidelines.
***Last / Change / Volume data in this table is the closing quote data***
Symbol/Exchange
Company Name
Industry Group |
PRICE |
CHANGE
(%Change) |
Day High |
Volume
(% DAV)
(% 50 day avg vol) |
52 Wk Hi
% From Hi |
Featured
Date |
Price
Featured |
Pivot Featured |
|
Max Buy |
AAPL
-
NASDAQ
Apple Inc
COMPUTER HARDWARE - Personal Computers
|
$259.94
|
+0.92
0.35% |
$260.38
|
19,038,341
65.97% of 50 DAV
50 DAV is 28,859,700
|
$279.01
-6.83%
|
6/17/2010
|
$270.95
|
PP = $272.56
|
|
MB = $286.19
|
 Most Recent Note - 7/23/2010 4:11:22 PM
G - Gains with light volume helped it close the week above its 50 DMA line. Its recent low near $240 defines an important chart support level to watch, where any subsequent deterioration would raise greater concerns and might trigger a more worrisome technical sell signal.
>>> The latest Featured Stock Update with an annotated graph appeared on 7/12/2010. Click here.
View all notes |
Alert me of new notes |
CANSLIM.net Company Profile |
SEC |
Zacks Reports |
StockTalk |
News |
Chart |
Request a new note
C
A N
S L
I M


|
ABV
-
NYSE
Comp De Bebidas Adr
FOOD and BEVERAGE - Beverages - Brewers
|
$108.61
|
-1.05
-0.96% |
$109.70
|
734,045
100.44% of 50 DAV
50 DAV is 730,800
|
$109.78
-1.07%
|
6/29/2010
|
$104.74
|
PP = $109.33
|
|
MB = $114.80
|
Most Recent Note - 7/23/2010 4:13:06 PM
Y - This Brazil-based beverage firm pulled back today after reaching a new 52-week high with its prior gain on light volume. It found support near its 50 DMA line recently after it was featured in the 6/29/10 mid-day report (read here).
>>> The latest Featured Stock Update with an annotated graph appeared on 7/20/2010. Click here.
View all notes |
Alert me of new notes |
CANSLIM.net Company Profile |
SEC |
Zacks Reports |
StockTalk |
News |
Chart |
Request a new note
C
A N
S L
I M
|
BIDU
-
NASDAQ
Baidu Inc Ads
INTERNET - Internet Information Providers
|
$78.06
|
+3.61
4.85% |
$78.20
|
13,306,302
94.30% of 50 DAV
50 DAV is 14,111,300
|
$82.29
-5.14%
|
7/14/2010
|
$75.03
|
PP = $78.59
|
|
MB = $82.52
|
Most Recent Note - 7/23/2010 3:46:53 PM
Y - Considerable gain with near average volume today has it rallying near its best close ever after recently finding support near its 50 DMA line.
>>> The latest Featured Stock Update with an annotated graph appeared on 7/14/2010. Click here.
View all notes |
Alert me of new notes |
CANSLIM.net Company Profile |
SEC |
Zacks Reports |
StockTalk |
News |
Chart |
Request a new note
C
A N
S L
I M
|
CRM
-
NYSE
Salesforce.Com Inc
INTERNET - Internet Software and Services
|
$99.77
|
+3.84
4.00% |
$100.30
|
3,135,653
108.93% of 50 DAV
50 DAV is 2,878,600
|
$97.94
1.87%
|
6/2/2010
|
$88.44
|
PP = $89.60
|
|
MB = $94.08
|
Most Recent Note - 7/23/2010 3:50:39 PM
G - Rising to a new 52-week high today with a considerable gain on near average volume, clearing a choppy 7-week base.
>>> The latest Featured Stock Update with an annotated graph appeared on 7/15/2010. Click here.
View all notes |
Alert me of new notes |
CANSLIM.net Company Profile |
SEC |
Zacks Reports |
StockTalk |
News |
Chart |
Request a new note
C
A N
S L
I M
|
FFIV
-
NASDAQ
F 5 Networks Inc
INTERNET - Internet Software and Services
|
$87.21
|
+3.81
4.57% |
$87.35
|
2,952,572
178.09% of 50 DAV
50 DAV is 1,657,900
|
$83.85
4.01%
|
6/16/2010
|
$74.50
|
PP = $74.10
|
|
MB = $77.81
|
Most Recent Note - 7/23/2010 1:01:02 PM
G - Hitting another new 52-week high and getting more extended from a sound base today following a considerable 7/22/10 gap up gain on very heavy volume after reporting strong results for the latest quarter ended June 30, 2010. As we have often noted in the past, volume and volatility increase near earnings news. Be sure to check headlines via the "News" links for greater visibility or contact the companies directly if pending earnings news is not otherwise noted.
>>> The latest Featured Stock Update with an annotated graph appeared on 7/7/2010. Click here.
View all notes |
Alert me of new notes |
CANSLIM.net Company Profile |
SEC |
Zacks Reports |
StockTalk |
News |
Chart |
Request a new note
C
A N
S L
I M
|
Symbol/Exchange
Company Name
Industry Group |
PRICE |
CHANGE
(%Change) |
Day High |
Volume
(% DAV)
(% 50 day avg vol) |
52 Wk Hi
% From Hi |
Featured
Date |
Price
Featured |
Pivot Featured |
|
Max Buy |
MELI
-
NASDAQ
Mercadolibre Inc
INTERNET - Internet Software and; Services
|
$61.47
|
+1.42
2.36% |
$61.55
|
789,055
83.17% of 50 DAV
50 DAV is 948,700
|
$62.46
-1.59%
|
5/13/2010
|
$54.21
|
PP = $55.85
|
|
MB = $58.64
|
Most Recent Note - 7/23/2010 4:01:49 PM
G - Finished at its second highest close of the year. Gains with light volume have followed a considerable 7/16/10 loss with above average volume. Recently it was noted as it wedged to new 52-week high territory with quiet volume behind its gains.
>>> The latest Featured Stock Update with an annotated graph appeared on 7/23/2010. Click here.
View all notes |
Alert me of new notes |
CANSLIM.net Company Profile |
SEC |
Zacks Reports |
StockTalk |
News |
Chart |
Request a new note
C
A N
S L
I M
|
NEM
-
NYSE
Newmont Mining Corp
METALS and MINING - Gold
|
$59.05
|
+0.04
0.07% |
$59.59
|
5,926,841
61.39% of 50 DAV
50 DAV is 9,654,000
|
$63.38
-6.83%
|
6/22/2010
|
$59.60
|
PP = $59.67
|
|
MB = $62.65
|
Most Recent Note - 7/23/2010 4:02:23 PM
G - Posted yet another small gain today with lighter volume, sputtering just above its 50 DMA line and prior chart highs that define support to watch.
>>> The latest Featured Stock Update with an annotated graph appeared on 7/9/2010. Click here.
View all notes |
Alert me of new notes |
CANSLIM.net Company Profile |
SEC |
Zacks Reports |
StockTalk |
News |
Chart |
Request a new note
C
A N
S L
I M
|
NEOG
-
NASDAQ
Neogen Corp
DRUGS - Diagnostic Substances
|
$28.31
|
+0.72
2.61% |
$28.35
|
115,388
133.09% of 50 DAV
50 DAV is 86,700
|
$27.90
1.47%
|
7/22/2010
|
$27.19
|
PP = $27.87
|
|
MB = $29.26
|
Most Recent Note - 7/23/2010 4:04:58 PM
Y - Today's gain helped it rise above its pivot point but the volume total was below guidelines for a proper technical buy signal. Featured in yellow the 7/22/10 mid-day report (read here). Since noted in the mid-day report on 6/18/10 it had been churning near all-time highs. It faces no resistance due to overhead supply. NEOG has a history of slow steady annual earnings growth (A criteria). The 2 most recent quarterly comparisons have shown improving sales revenues growth with earnings per share increases above the investment system's +25% guideline.
>>> The latest Featured Stock Update with an annotated graph appeared on 7/22/2010. Click here.
View all notes |
Alert me of new notes |
CANSLIM.net Company Profile |
SEC |
Zacks Reports |
StockTalk |
News |
Chart |
Request a new note
C
A N
S L
I M
|
ROVI
-
NASDAQ
Rovi Corp
COMPUTER SOFTWARE andamp; SERVICES - Security Software andamp; Services
|
$43.54
|
+0.45
1.04% |
$44.02
|
874,689
64.11% of 50 DAV
50 DAV is 1,364,300
|
$43.67
-0.30%
|
6/3/2010
|
$38.70
|
PP = $40.16
|
|
MB = $42.17
|
Most Recent Note - 7/23/2010 4:06:10 PM
G - Hit a new 52-week high today. Earnings news is due 7/29/10 after the close. Support is defined by prior resistance in the $40 area and its 50 DMA line.
>>> The latest Featured Stock Update with an annotated graph appeared on 7/21/2010. Click here.
View all notes |
Alert me of new notes |
CANSLIM.net Company Profile |
SEC |
Zacks Reports |
StockTalk |
News |
Chart |
Request a new note
C
A N
S L
I M
|
THOR
-
NASDAQ
Thoratec Corp
HEALTH SERVICES - Medical Instruments and Supplies
|
$42.81
|
+1.32
3.18% |
$43.02
|
633,865
64.96% of 50 DAV
50 DAV is 975,800
|
$47.93
-10.68%
|
6/3/2010
|
$44.38
|
PP = $45.35
|
|
MB = $47.62
|
Most Recent Note - 7/23/2010 4:08:35 PM
G - This high-ranked Medical Products firm has posted gains on light volume after recent violations of its 50 DMA line and prior chart low. A prompt rebound above its short-term average would help its outlook.
>>> The latest Featured Stock Update with an annotated graph appeared on 7/16/2010. Click here.
View all notes |
Alert me of new notes |
CANSLIM.net Company Profile |
SEC |
Zacks Reports |
StockTalk |
News |
Chart |
Request a new note
C
A N
S L
I M
|
Symbol/Exchange
Company Name
Industry Group |
PRICE |
CHANGE
(%Change) |
Day High |
Volume
(% DAV)
(% 50 day avg vol) |
52 Wk Hi
% From Hi |
Featured
Date |
Price
Featured |
Pivot Featured |
|
Max Buy |
ULTA
-
NASDAQ
Ulta Salon Cosm & Frag
SPECIALTY RETAIL - Specialty Retail, Other
|
$24.74
|
+0.62
2.57% |
$24.76
|
423,844
60.09% of 50 DAV
50 DAV is 705,300
|
$26.75
-7.51%
|
5/28/2010
|
$25.58
|
PP = $25.86
|
|
MB = $27.15
|
Most Recent Note - 7/23/2010 4:10:06 PM
G - Gains with light volume helped it close the week above its 50 DMA line. Its May - June chart lows in the $21 area define the next support level just above its 200 DMA line.
>>> The latest Featured Stock Update with an annotated graph appeared on 7/19/2010. Click here.
View all notes |
Alert me of new notes |
CANSLIM.net Company Profile |
SEC |
Zacks Reports |
StockTalk |
News |
Chart |
Request a new note
C
A N
S L
I M
|
VIT
-
NYSE
Vanceinfo Tech Inc Ads
COMPUTER SOFTWARE and SERVICES - Business Software and Services
|
$27.40
|
+1.23
4.70% |
$27.59
|
566,912
89.87% of 50 DAV
50 DAV is 630,800
|
$26.90
1.86%
|
7/8/2010
|
$25.20
|
PP = $26.58
|
|
MB = $27.91
|
Most Recent Note - 7/23/2010 3:58:25 PM
Y - Hit a new 52-week high today with a considerable gain, however volume is near average, not sufficient (+50% above average volume or greater is required) to trigger a proper technical buy signal. It did not yet trigger a technical buy signal with respect to the pivot point cited after gapping up on 7/08/10, when it briefly matched its all-time high and appeared in the mid-day report (read here).
>>> The latest Featured Stock Update with an annotated graph appeared on 7/8/2010. Click here.
View all notes |
Alert me of new notes |
CANSLIM.net Company Profile |
SEC |
Zacks Reports |
StockTalk |
News |
Chart |
Request a new note
C
A N
S L
I M
|
|
|
|
THESE ARE NOT BUY RECOMMENDATIONS!
Comments contained in the body of this report are technical
opinions only. The material herein has been obtained
from sources believed to be reliable and accurate, however,
its accuracy and completeness cannot be guaranteed.
This site is not an investment advisor, hence it does
not endorse or recommend any securities or other investments.
Any recommendation contained in this report may not
be suitable for all investors and it is not to be deemed
an offer or solicitation on our part with respect to
the purchase or sale of any securities. All trademarks,
service marks and trade names appearing in this report
are the property of their respective owners, and are
likewise used for identification purposes only.
This report is a service available
only to active Paid Premium Members.
You may opt-out of receiving report notifications
at any time. Questions or comments may be submitted
by writing to Premium Membership Services 665 S.E. 10 Street, Suite 201 Deerfield Beach, FL 33441-5634 or by calling 1-800-965-8307
or 954-785-1121.
|
|
|


