You are not logged in.
This means you
CAN ONLY VIEW reports that were published prior to Tuesday, April 15, 2025.
You
MUST UPGRADE YOUR MEMBERSHIP if you want to see any current reports.
AFTER MARKET UPDATE - THURSDAY, JULY 22ND, 2010
Previous After Market Report Next After Market Report >>>
|
|
|
|
DOW |
+201.77 |
10,322.30 |
+1.99% |
|
Volume |
1,177,077,180 |
-2% |
|
Volume |
2,165,030,830 |
-1% |
|
NASDAQ |
+58.56 |
2,245.89 |
+2.68% |
|
Advancers |
2,678 |
85% |
|
Advancers |
2,234 |
81% |
|
S&P 500 |
+24.08 |
1,093.67 |
+2.25% |
|
Decliners |
407 |
13% |
|
Decliners |
446 |
16% |
|
Russell 2000 |
+22.84 |
635.48 |
+3.73% |
|
52 Wk Highs |
177 |
|
|
52 Wk Highs |
40 |
|
|
S&P 600 |
+11.41 |
341.94 |
+3.45% |
|
52 Wk Lows |
17 |
|
|
52 Wk Lows |
41 |
|
|
 |
Breadth Very Positive As Stocks Rally
Adam Sarhan, Contributing Writer,
Stocks rallied smartly on Thursday as investors digested the latest round of earnings and economic data. Volume, an important indicator of institutional sponsorship, was reported slightly lighter than Wednesday's totals on both exchanges while the major averages ended unanimously higher. Advancers led decliners by nearly a 6-to-1 ratio on the NYSE and by nearly a 5-to-1 ratio on the Nasdaq exchange. New 52-week highs solidly outnumbered new 52-week lows on the NYSE but were evenly matched on the Nasdaq exchange. There were 23 high-ranked companies from the CANSLIM.net Leaders List that made a new 52-week high and appeared on the CANSLIM.net BreakOuts Page, higher from the 18 issues that appeared on the prior session. For the rally to have ongoing success it will be critical for a healthy crop of leaders to continue showing up hitting new 52-week highs.
It was encouraging to see stocks rally after the latest round of earnings were released. Overnight, stocks rallied after the eurozone reported stronger than expected economic growth. This helped allay concerns of an economic slowdown that may derail the global recovery. In the US, United Parcel Service Inc. (UPS +5.23%) and AT&T Inc. (T +2.27%) were some of the well-known companies that reported solid Q2 results. The dollar fell which also helped oil top $79 a barrel and copper rally from deeply oversold levels. Copper climbed over +2% to $3.1555 a pound in New York, which was the highest level since May. Investors are not waiting for Europe to release the results of their much anticipated stress tests which are slated to be released on Friday.
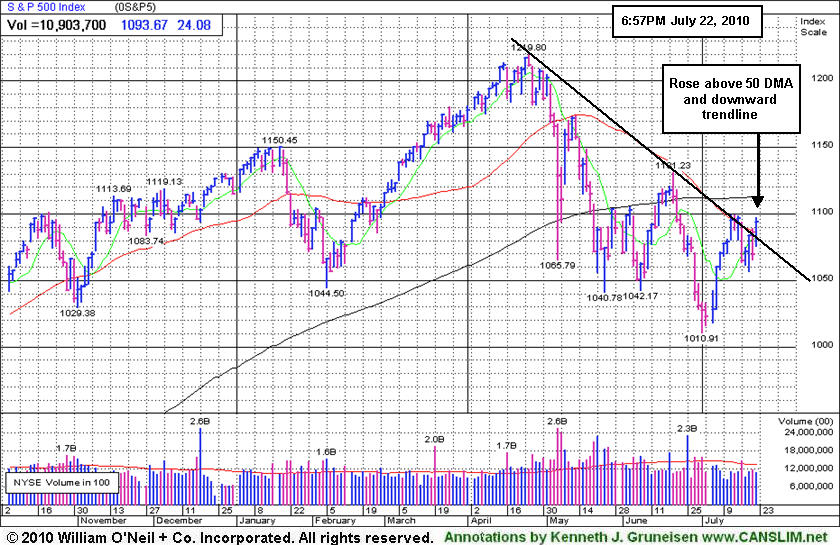
All the major averages traded above their respective two month downward trendlines and their 50 DMA lines on Thursday which was a healthy sign. It is also important to note that the major averages are rallying up to an area where they encountered resistance several times in recent weeks and they are still below their longer term 200 DMA lines. That said, there is no point in fighting the tape and the bulls deserve the bullish benefit of the doubt until this "breakout" is negated. Trade accordingly.
PICTURED: The S&P 500 Index rallied above its 50-day moving average line and downward trendline.
|
|
|
 |
Widespread Gains Boosted Every Industry Group
Kenneth J. Gruneisen - Passed the CAN SLIM® Master's Exam
Big gains from the Bank Index ($BKX +3.90%), Broker/Dealer Index ($XBD +2.36%), and Retail Index ($RLX +2.92%) provided some influential backbone to the rally on Thursday. Gains were clearly widespread, however, and there was solid leadership the tech sector as the Internet Index ($IIX +3.02%), Semiconductor Index ($SOX +3.28%), Networking Index ($NWX +3.41%) charged higher. The Healthcare Index ($HMO +1.70%) and Biotechnology Index ($BTK +1.74%) posted decent but smaller gains. Commodity linked areas also had a positive bias as the Oil Services Index ($OSX +1.99%), Integrated Oil Index ($XOI +2.44%), Gold & Silver Index ($XAU +2.16%) were buoyed by broad-based buying demand.
Charts courtesy www.stockcharts.com
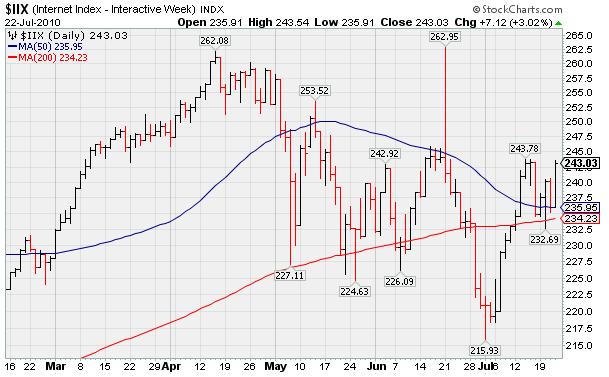
PICTURED: The Internet Index ($IIX +3.02%) is fighting to stay above its 50-day and 200-day moving average (DMA) line.
| Oil Services |
$OSX |
180.10 |
+3.52 |
+1.99% |
-7.60% |
| Healthcare |
$HMO |
1,415.31 |
+23.68 |
+1.70% |
-3.91% |
| Integrated Oil |
$XOI |
963.04 |
+22.93 |
+2.44% |
-9.85% |
| Semiconductor |
$SOX |
362.66 |
+11.53 |
+3.28% |
+0.76% |
| Networking |
$NWX |
245.07 |
+8.07 |
+3.41% |
+6.06% |
| Internet |
$IIX |
243.03 |
+7.12 |
+3.02% |
+3.92% |
| Broker/Dealer |
$XBD |
103.97 |
+2.39 |
+2.36% |
-9.63% |
| Retail |
$RLX |
404.62 |
+11.47 |
+2.92% |
-1.58% |
| Gold & Silver |
$XAU |
172.34 |
+3.65 |
+2.16% |
+2.43% |
| Bank |
$BKX |
47.64 |
+1.79 |
+3.90% |
+11.54% |
| Biotech |
$BTK |
1,036.30 |
+17.73 |
+1.74% |
+10.00% |
|
|
|
 |
Medical - Products Firm Returns To Featured Stocks List
Kenneth J. Gruneisen - Passed the CAN SLIM® Master's Exam
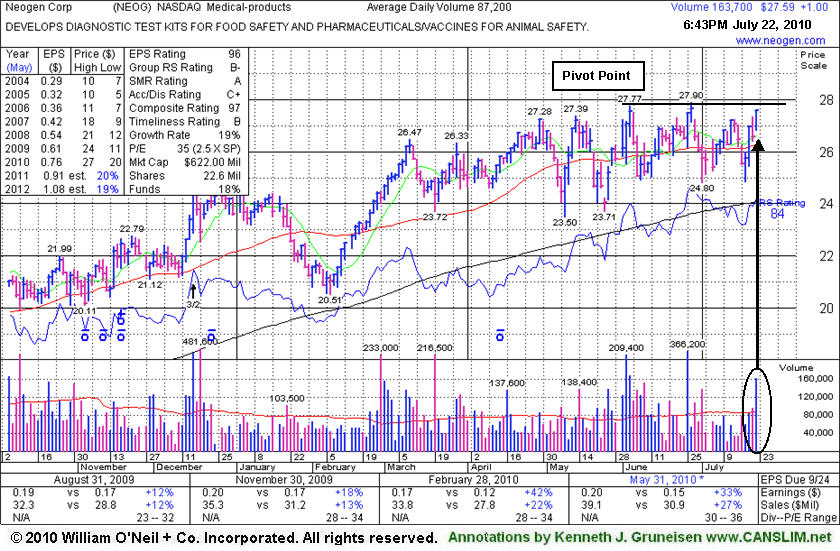
Neogen Corp. (NEOG +$1.00 or +3.76% to $27.59) closed at the session high today with a solid gain on nearly 2 times average volume after featured in yellow the mid-day report (read here). Since last noted in the mid-day report on 6/18/10 it has been churning near all-time highs. The pivot point cited is based upon its June 3, 2010 high plus ten cents. Its brief rally above that mark on 6/28/10 lacked volume and then it endured distributional pressure. Now it faces no resistance due to overhead supply. NEOG has a history of steady annual earnings growth (A criteria). The 2 most recent quarterly comparisons have shown improving sales revenues growth with earnings per share increases above the investment system's +25% guideline. The stock is still building a long flat base and should remain on an active watch list until the stock triggers a fresh technical buy signal. Remember to always limit losses per the 7-8% sell rule, and never hold a stock if it falls more than that much from your purchase price. Years ago, this stock was first featured on Thursday, February 21, 2008 in the CANSLIM.net Mid Day Breakouts Report (read here) and it was later dropped from the Featured Stocks list.
|
|
|
Color Codes Explained :
Y - Better candidates highlighted by our
staff of experts.
G - Previously featured
in past reports as yellow but may no longer be buyable under the
guidelines.
***Last / Change / Volume data in this table is the closing quote data***
Symbol/Exchange
Company Name
Industry Group |
PRICE |
CHANGE
(%Change) |
Day High |
Volume
(% DAV)
(% 50 day avg vol) |
52 Wk Hi
% From Hi |
Featured
Date |
Price
Featured |
Pivot Featured |
|
Max Buy |
AAPL
-
NASDAQ
Apple Inc
COMPUTER HARDWARE - Personal Computers
|
$259.02
|
+4.78
1.88% |
$260.00
|
23,024,054
79.78% of 50 DAV
50 DAV is 28,859,700
|
$279.01
-7.16%
|
6/17/2010
|
$270.95
|
PP = $272.56
|
|
MB = $286.19
|
 Most Recent Note - 7/22/2010 6:03:54 PM
G - Gain today with light volume helped it close above its 50 DMA line. Its recent low near $240 defines an important chart support level to watch, where any subsequent deterioration would raise greater concerns and might trigger a more worrisome technical sell signal.
>>> The latest Featured Stock Update with an annotated graph appeared on 7/12/2010. Click here.
View all notes |
Alert me of new notes |
CANSLIM.net Company Profile |
SEC |
Zacks Reports |
StockTalk |
News |
Chart |
Request a new note
C
A N
S L
I M


|
ABV
-
NYSE
Comp De Bebidas Adr
FOOD and BEVERAGE - Beverages - Brewers
|
$109.66
|
+3.35
3.15% |
$109.78
|
642,625
87.93% of 50 DAV
50 DAV is 730,800
|
$109.33
0.30%
|
6/29/2010
|
$104.74
|
PP = $109.33
|
|
MB = $114.80
|
Most Recent Note - 7/22/2010 6:13:25 PM
Y - This Brazil-based beverage firm rallied to a new 52-week high and above its pivot point, but with below average volume. It found support near its 50 DMA line recently after it was featured in the 6/29/10 mid-day report (read here).
>>> The latest Featured Stock Update with an annotated graph appeared on 7/20/2010. Click here.
View all notes |
Alert me of new notes |
CANSLIM.net Company Profile |
SEC |
Zacks Reports |
StockTalk |
News |
Chart |
Request a new note
C
A N
S L
I M
|
BIDU
-
NASDAQ
Baidu Inc Ads
INTERNET - Internet Information Providers
|
$74.45
|
+1.14
1.56% |
$76.46
|
19,746,637
139.93% of 50 DAV
50 DAV is 14,111,300
|
$82.29
-9.53%
|
7/14/2010
|
$75.03
|
PP = $78.59
|
|
MB = $82.52
|
Most Recent Note - 7/22/2010 6:16:07 PM
Y - Gain today with above average volume helped it fight to stay above its 50 DMA line. Disciplined investors avoid the temptation to get in "early" and watch for a proper technical buy signal.
>>> The latest Featured Stock Update with an annotated graph appeared on 7/14/2010. Click here.
View all notes |
Alert me of new notes |
CANSLIM.net Company Profile |
SEC |
Zacks Reports |
StockTalk |
News |
Chart |
Request a new note
C
A N
S L
I M
|
CRM
-
NYSE
Salesforce.Com Inc
INTERNET - Internet Software and Services
|
$95.93
|
+3.77
4.09% |
$96.43
|
1,593,593
55.36% of 50 DAV
50 DAV is 2,878,600
|
$97.94
-2.05%
|
6/2/2010
|
$88.44
|
PP = $89.60
|
|
MB = $94.08
|
Most Recent Note - 7/22/2010 6:21:44 PM
G - Small gain on light volume today as it approached its 52-week high. Technically it has not formed a sound new base.
>>> The latest Featured Stock Update with an annotated graph appeared on 7/15/2010. Click here.
View all notes |
Alert me of new notes |
CANSLIM.net Company Profile |
SEC |
Zacks Reports |
StockTalk |
News |
Chart |
Request a new note
C
A N
S L
I M
|
FFIV
-
NASDAQ
F 5 Networks Inc
INTERNET - Internet Software and Services
|
$83.40
|
+10.29
14.07% |
$83.85
|
5,529,288
333.51% of 50 DAV
50 DAV is 1,657,900
|
$79.21
5.29%
|
6/16/2010
|
$74.50
|
PP = $74.10
|
|
MB = $77.81
|
Most Recent Note - 7/22/2010 12:36:18 PM
G - Following a weak finish on the prior session FFIV gapped up today for a considerable gain on very heavy volume to reach a new 52-week high after reporting strong results for the latest quarter ended June 30, 2010. Color code was changed to green after quickly leaping above its "max buy" level. As we have often noted in the past, volume and volatility increase near earnings news. Check headlines via the "News" link for greater visibility or contact the companies directly if pending earnings news is not otherwise noted.
>>> The latest Featured Stock Update with an annotated graph appeared on 7/7/2010. Click here.
View all notes |
Alert me of new notes |
CANSLIM.net Company Profile |
SEC |
Zacks Reports |
StockTalk |
News |
Chart |
Request a new note
C
A N
S L
I M
|
Symbol/Exchange
Company Name
Industry Group |
PRICE |
CHANGE
(%Change) |
Day High |
Volume
(% DAV)
(% 50 day avg vol) |
52 Wk Hi
% From Hi |
Featured
Date |
Price
Featured |
Pivot Featured |
|
Max Buy |
MELI
-
NASDAQ
Mercadolibre Inc
INTERNET - Internet Software and; Services
|
$60.05
|
+1.13
1.92% |
$60.25
|
588,323
62.01% of 50 DAV
50 DAV is 948,700
|
$62.46
-3.86%
|
5/13/2010
|
$54.21
|
PP = $55.85
|
|
MB = $58.64
|
Most Recent Note - 7/22/2010 6:25:07 PM
G - Gains with ever-lighter volume have followed a considerable 7/16/10 loss with above average volume. Recently it was noted as it wedged to new 52-week high territory with quiet volume behind its gains.
>>> The latest Featured Stock Update with an annotated graph appeared on 6/30/2010. Click here.
View all notes |
Alert me of new notes |
CANSLIM.net Company Profile |
SEC |
Zacks Reports |
StockTalk |
News |
Chart |
Request a new note
C
A N
S L
I M
|
NEM
-
NYSE
Newmont Mining Corp
METALS and MINING - Gold
|
$59.01
|
+0.84
1.44% |
$59.52
|
6,265,494
64.90% of 50 DAV
50 DAV is 9,654,000
|
$63.38
-6.89%
|
6/22/2010
|
$59.60
|
PP = $59.67
|
|
MB = $62.65
|
Most Recent Note - 7/22/2010 6:26:21 PM
G - Posted another small gain today with lighter volume, sputtering just above its 50 DMA line and prior chart highs that define support to watch.
>>> The latest Featured Stock Update with an annotated graph appeared on 7/9/2010. Click here.
View all notes |
Alert me of new notes |
CANSLIM.net Company Profile |
SEC |
Zacks Reports |
StockTalk |
News |
Chart |
Request a new note
C
A N
S L
I M
|
NEOG
-
NASDAQ
Neogen Corp
DRUGS - Diagnostic Substances
|
$27.59
|
+1.00
3.76% |
$27.62
|
236,263
272.51% of 50 DAV
50 DAV is 86,700
|
$27.90
-1.11%
|
7/22/2010
|
$27.19
|
PP = $27.87
|
|
MB = $29.26
|
Most Recent Note - 7/22/2010 6:30:21 PM
Y - Closed at the session high today with a solid gain on nearly 2 times average volume after featured in yellow the mid-day report (read here). Since last noted in the mid-day report on 6/18/10 it it has been churning near all-time highs. It faces no resistance due to overhead supply. NEOG has a history of slow steady annual earnings growth (A criteria). The 2 most recent quarterly comparisons have shown improving sales revenues growth with earnings per share increases above the investment system's +25% guideline.
>>> The latest Featured Stock Update with an annotated graph appeared on 7/22/2010. Click here.
View all notes |
Alert me of new notes |
CANSLIM.net Company Profile |
SEC |
Zacks Reports |
StockTalk |
News |
Chart |
Request a new note
C
A N
S L
I M
|
ROVI
-
NASDAQ
Rovi Corp
COMPUTER SOFTWARE andamp; SERVICES - Security Software andamp; Services
|
$43.09
|
+0.67
1.58% |
$43.38
|
1,162,346
85.20% of 50 DAV
50 DAV is 1,364,300
|
$43.67
-1.33%
|
6/3/2010
|
$38.70
|
PP = $40.16
|
|
MB = $42.17
|
Most Recent Note - 7/22/2010 6:32:13 PM
G - Earnings news is due 7/29/10 after the close. Closed today's session 11 cents off its best ever close today. Support defined by prior resistance in the $40 area and its 50 DMA line.
>>> The latest Featured Stock Update with an annotated graph appeared on 7/21/2010. Click here.
View all notes |
Alert me of new notes |
CANSLIM.net Company Profile |
SEC |
Zacks Reports |
StockTalk |
News |
Chart |
Request a new note
C
A N
S L
I M
|
THOR
-
NASDAQ
Thoratec Corp
HEALTH SERVICES - Medical Instruments and Supplies
|
$41.49
|
+0.33
0.80% |
$42.06
|
770,617
78.97% of 50 DAV
50 DAV is 975,800
|
$47.93
-13.44%
|
6/3/2010
|
$44.38
|
PP = $45.35
|
|
MB = $47.62
|
Most Recent Note - 7/22/2010 6:32:51 PM
G - Held its ground today after a streak of 4 consecutive losses with below average volume included violations of its 50 DMA line and prior chart low. A prompt rebound above its short-term average would help its outlook, meanwhile the path of least resistance may lead this high-ranked Medical Products firm lower.
>>> The latest Featured Stock Update with an annotated graph appeared on 7/16/2010. Click here.
View all notes |
Alert me of new notes |
CANSLIM.net Company Profile |
SEC |
Zacks Reports |
StockTalk |
News |
Chart |
Request a new note
C
A N
S L
I M
|
Symbol/Exchange
Company Name
Industry Group |
PRICE |
CHANGE
(%Change) |
Day High |
Volume
(% DAV)
(% 50 day avg vol) |
52 Wk Hi
% From Hi |
Featured
Date |
Price
Featured |
Pivot Featured |
|
Max Buy |
ULTA
-
NASDAQ
Ulta Salon Cosm & Frag
SPECIALTY RETAIL - Specialty Retail, Other
|
$24.12
|
+1.26
5.51% |
$24.17
|
477,190
67.66% of 50 DAV
50 DAV is 705,300
|
$26.75
-9.83%
|
5/28/2010
|
$25.58
|
PP = $25.86
|
|
MB = $27.15
|
Most Recent Note - 7/22/2010 6:34:03 PM
G - Gain today with light volume helped it close above its 50 DMA line. Its May - June chart lows in the $21 area define the next support level just above its 200 DMA line.
>>> The latest Featured Stock Update with an annotated graph appeared on 7/19/2010. Click here.
View all notes |
Alert me of new notes |
CANSLIM.net Company Profile |
SEC |
Zacks Reports |
StockTalk |
News |
Chart |
Request a new note
C
A N
S L
I M
|
VIT
-
NYSE
Vanceinfo Tech Inc Ads
COMPUTER SOFTWARE and SERVICES - Business Software and Services
|
$26.17
|
+0.66
2.59% |
$26.29
|
300,409
47.62% of 50 DAV
50 DAV is 630,800
|
$26.90
-2.71%
|
7/8/2010
|
$25.20
|
PP = $26.58
|
|
MB = $27.91
|
Most Recent Note - 7/22/2010 6:35:44 PM
Y - Small gain on light volume today for its second best close. It did not yet trigger a technical buy signal with respect to the pivot point cited after gapping up on 7/08/10, when it briefly matched its all-time high and appeared in the mid-day report (read here).
>>> The latest Featured Stock Update with an annotated graph appeared on 7/8/2010. Click here.
View all notes |
Alert me of new notes |
CANSLIM.net Company Profile |
SEC |
Zacks Reports |
StockTalk |
News |
Chart |
Request a new note
C
A N
S L
I M
|
|
|
|
THESE ARE NOT BUY RECOMMENDATIONS!
Comments contained in the body of this report are technical
opinions only. The material herein has been obtained
from sources believed to be reliable and accurate, however,
its accuracy and completeness cannot be guaranteed.
This site is not an investment advisor, hence it does
not endorse or recommend any securities or other investments.
Any recommendation contained in this report may not
be suitable for all investors and it is not to be deemed
an offer or solicitation on our part with respect to
the purchase or sale of any securities. All trademarks,
service marks and trade names appearing in this report
are the property of their respective owners, and are
likewise used for identification purposes only.
This report is a service available
only to active Paid Premium Members.
You may opt-out of receiving report notifications
at any time. Questions or comments may be submitted
by writing to Premium Membership Services 665 S.E. 10 Street, Suite 201 Deerfield Beach, FL 33441-5634 or by calling 1-800-965-8307
or 954-785-1121.
|
|
|


