You are not logged in.
This means you
CAN ONLY VIEW reports that were published prior to Tuesday, April 15, 2025.
You
MUST UPGRADE YOUR MEMBERSHIP if you want to see any current reports.
AFTER MARKET UPDATE - MONDAY, JULY 26TH, 2010
Previous After Market Report Next After Market Report >>>
|
|
|
|
DOW |
+100.81 |
10,525.43 |
+0.97% |
|
Volume |
1,018,311,000 |
-12% |
|
Volume |
2,126,615,620 |
-11% |
|
NASDAQ |
+26.96 |
2,296.43 |
+1.19% |
|
Advancers |
2,456 |
78% |
|
Advancers |
2,058 |
74% |
|
S&P 500 |
+12.35 |
1,115.01 |
+1.12% |
|
Decliners |
584 |
19% |
|
Decliners |
651 |
23% |
|
Russell 2000 |
+14.57 |
665.22 |
+2.24% |
|
52 Wk Highs |
244 |
|
|
52 Wk Highs |
121 |
|
|
S&P 600 |
+7.35 |
356.57 |
+2.10% |
|
52 Wk Lows |
12 |
|
|
52 Wk Lows |
29 |
|
|
 |
Leadership Expands As Major Averages Make More Important Progress
Adam Sarhan, Contributing Writer,
The major averages ended higher on Monday after FedEx Corp (FDX +5.61%) reported solid results and raised its 2010 outlook, meanwhile a positive report from the troubled housing sector was released. Volume, an important indicator of institutional sponsorship, was reported lower than Friday's totals on the NYSE and Nasdaq exchange. Advancers trumped decliners by a 4-to-1 ratio on the NYSE and a 3-to-1 ratio on the Nasdaq exchange and new 52-week highs easily outnumbered new 52-week lows on both major exchanges. There were 64 high-ranked companies from the CANSLIM.net Leaders List that made a new 52-week high and appeared on the CANSLIM.net BreakOuts Page, higher from the 39 issues that appeared on the prior session. The sign of expanding leadership bodes well for the current confirmed rally.
Before Monday's open, FedEx raised their 2010 outlook and said earnings soared +108% while sales grew by +20% last quarter. The second largest package-delivery company's shares gapped up on monstrous trade as investors welcomed the positive news. Normally, transportation stocks are a good proxy for general economic activity. Therefore, the fact that earnings soared last quarter bodes well for the ongoing global recovery. Elsewhere, the Commerce Department said new home sales topped estimates and rose in June, following an unprecedented decline in the previous month. New home sales rose by +24% from May to an annual pace of 330,000. The market has rebounded nicely over the past few weeks after investor sentiment fell to the lowest level since July 2009. The American Association of Individual Investors' ratio of bullish to bearish respondents fell to 0.68 (four week average) which normally corresponds with counter trend rallies. The converse is also true, market's tend to pullback when the survey becomes too bullish.
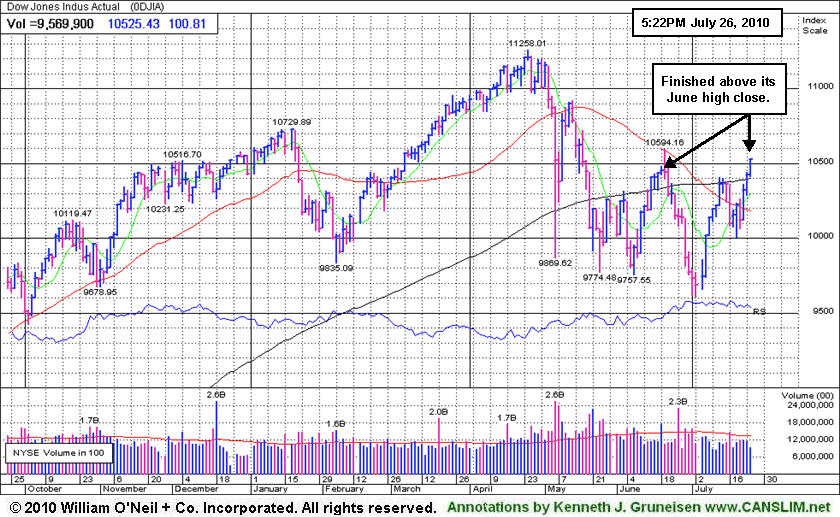
It was encouraging to see the major averages continue rallying after breaking above their their respective 2-month downward trendlines and their respective 50-day moving average (DMA) lines on Friday. It was also healthy to see the benchmark S&P 500 close above its 200 DMA line which is another healthy sign. At this point, the window remains open for for high ranked stocks to be accumulated when they trigger fresh technical buy signals. If you are interested in learning more, feel free to contact us for a full list of high ranked candidates. Trade accordingly.
PICTURED: The Dow Jones Industrial Average finished above its June high close. Recent gains have come with lackluster volume, but the progress being made above the 50 and 200 DMA lines is still an encouraging sign.
|
|
|
 |
Biotechnology Index Rallying Above 50-Day Average
Kenneth J. Gruneisen - Passed the CAN SLIM® Master's Exam
Financial shares were among Monday's important influences as the Bank Index ($BKX +2.61%) and Broker/Dealer Index ($XBD +1.28%) posted solid gains. The Retail Index ($RLX +1.84%) and broad strength in tech sector also underpinned the rally's gains as the Networking Index ($NWX +2.01%) and Semiconductor Index ($SOX +1.36%) outpaced the Internet Index ($IIX +0.65%). The Healthcare Index ($HMO +2.21%) was also among the session's strongest gainers, and gains in energy-related shares boosted the Oil Services Index ($OSX +1.11%) and Integrated Oil Index ($XOI +1.55%). Meanwhile, the Gold & Silver Index ($XAU -0.92%) was clearly a laggard as it ended with a loss.
Charts courtesy www.stockcharts.com
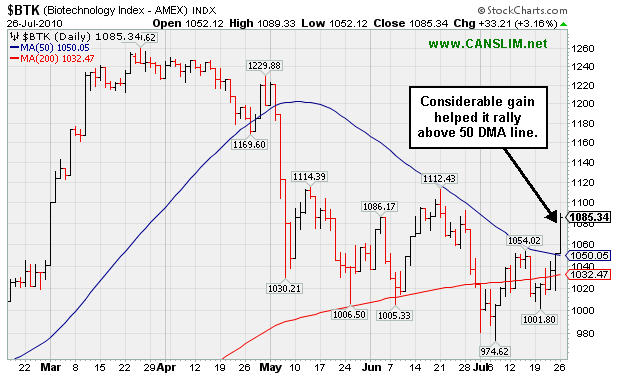
PICTURED: The Biotechnology Index ($BTK +3.16%) was a standout gainer as it posted a solid gain and rallied above its 50-day moving average (DMA) line.
| Oil Services |
$OSX |
181.52 |
+1.99 |
+1.11% |
-6.87% |
| Healthcare |
$HMO |
1,449.80 |
+31.30 |
+2.21% |
-1.57% |
| Integrated Oil |
$XOI |
984.91 |
+15.05 |
+1.55% |
-7.80% |
| Semiconductor |
$SOX |
369.50 |
+4.97 |
+1.36% |
+2.66% |
| Networking |
$NWX |
251.61 |
+4.97 |
+2.01% |
+8.90% |
| Internet |
$IIX |
248.56 |
+1.61 |
+0.65% |
+6.29% |
| Broker/Dealer |
$XBD |
106.09 |
+1.34 |
+1.28% |
-7.79% |
| Retail |
$RLX |
415.68 |
+7.51 |
+1.84% |
+1.11% |
| Gold & Silver |
$XAU |
171.82 |
-1.60 |
-0.92% |
+2.12% |
| Bank |
$BKX |
49.18 |
+1.25 |
+2.61% |
+15.15% |
| Biotech |
$BTK |
1,085.34 |
+33.21 |
+3.16% |
+15.20% |
|
|
|
 |
Prior Session's Light Volume Breakout Promptly Negated
Kenneth J. Gruneisen - Passed the CAN SLIM® Master's Exam
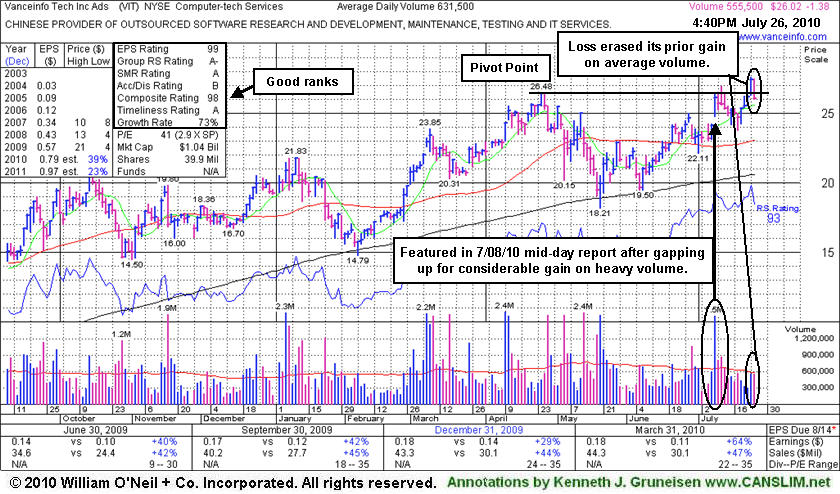
Considerable gains above a prior chart high with heavy volume are a very important part of a solid technical buy signal under the fact-based investment system's guidelines. Keep in mind that if a stock is going to rally substantially, its price/volume chart usually will show a powerful move into new high territory, clearing old resistance levels with great conviction that clearly suggests it is under heavy accumulation from the institutional crowd.
Vanceinfo Tech Inc Ads (VIT -$1.26 or -4.60% to $26.14) suffered a large loss today. That loss erased all of the prior session's gain for a new 52-week high with volume near average, not sufficient (+50% above average volume or greater is required) to trigger a proper technical buy signal. In fact, VIT did not yet trigger a technical buy signal with respect to the pivot point cited when it made its last appearance in this FSU section on 7/08/10 under the headline "Gap Up Gain Worth Noting As Sign Of Accumulation". When it met the 7/08/10 mid-day report screen parameters and was highlighted in yellow (read here) we observed that it also drew some headlines in the newspaper. Our analysis stated - "Some may consider it a 'cup-with-handle' or a 'double bottom' pattern with a sightly lower pivot point, however the new pivot point now being cited is based upon its 4/26/10 all-time high (which it matched earlier today to the penny) plus ten cents. A powerful breakout to a new high would be a very reassuring technical buy signal, meanwhile one may consider it a high-ranked leader that is currently challenging a previous resistance level where heavy distributional pressure was encountered not long ago. Volume should be +50% above average or greater with a gain above its pivot point to confirm any technical buy signal."
This China-based Computer - Tech Services firm found impressive support near its 200 DMA line in May-June. Since then its weekly chart remains marked by several big down weeks with above average volume and not a single up week marked by substantially above average volume since April. Based on weak action it was dropped from the Featured Stocks list on 5/19/10.
 |
|
|
Color Codes Explained :
Y - Better candidates highlighted by our
staff of experts.
G - Previously featured
in past reports as yellow but may no longer be buyable under the
guidelines.
***Last / Change / Volume data in this table is the closing quote data***
Symbol/Exchange
Company Name
Industry Group |
PRICE |
CHANGE
(%Change) |
Day High |
Volume
(% DAV)
(% 50 day avg vol) |
52 Wk Hi
% From Hi |
Featured
Date |
Price
Featured |
Pivot Featured |
|
Max Buy |
AAPL
-
NASDAQ
Apple Inc
COMPUTER HARDWARE - Personal Computers
|
$259.28
|
-0.66
-0.25% |
$260.10
|
14,885,540
51.74% of 50 DAV
50 DAV is 28,770,700
|
$279.01
-7.07%
|
6/17/2010
|
$270.95
|
PP = $272.56
|
|
MB = $286.19
|
Most Recent Note - 7/23/2010 4:11:22 PM
G - Gains with light volume helped it close the week above its 50 DMA line. Its recent low near $240 defines an important chart support level to watch, where any subsequent deterioration would raise greater concerns and might trigger a more worrisome technical sell signal.
>>> The latest Featured Stock Update with an annotated graph appeared on 7/12/2010. Click here.
View all notes |
Alert me of new notes |
CANSLIM.net Company Profile |
SEC |
Zacks Reports |
StockTalk |
News |
Chart |
Request a new note
C
A N
S L
I M


|
ABV
-
NYSE
Comp De Bebidas Adr
FOOD and BEVERAGE - Beverages - Brewers
|
$108.05
|
-0.56
-0.52% |
$108.09
|
573,201
78.25% of 50 DAV
50 DAV is 732,500
|
$109.78
-1.58%
|
6/29/2010
|
$104.74
|
PP = $109.33
|
|
MB = $114.80
|
Most Recent Note - 7/23/2010 4:13:06 PM
Y - This Brazil-based beverage firm pulled back today after reaching a new 52-week high with its prior gain on light volume. It found support near its 50 DMA line recently after it was featured in the 6/29/10 mid-day report (read here).
>>> The latest Featured Stock Update with an annotated graph appeared on 7/20/2010. Click here.
View all notes |
Alert me of new notes |
CANSLIM.net Company Profile |
SEC |
Zacks Reports |
StockTalk |
News |
Chart |
Request a new note
C
A N
S L
I M
|
BIDU
-
NASDAQ
Baidu Inc Ads
INTERNET - Internet Information Providers
|
$80.37
|
+2.31
2.96% |
$80.87
|
13,910,918
102.69% of 50 DAV
50 DAV is 13,546,800
|
$82.29
-2.33%
|
7/14/2010
|
$75.03
|
PP = $78.59
|
|
MB = $82.52
|
 Most Recent Note - 7/26/2010 2:19:00 PM
Y - Considerable gain today with volume running at an above average pace while on course to challenge its all-time high. Latest quarter ended June 30, 2010 showed sales revenues growth still accelerating and earnings increasing by triple digit percentages for the 2nd consecutive comparison.
>>> The latest Featured Stock Update with an annotated graph appeared on 7/14/2010. Click here.
View all notes |
Alert me of new notes |
CANSLIM.net Company Profile |
SEC |
Zacks Reports |
StockTalk |
News |
Chart |
Request a new note
C
A N
S L
I M
|
CRM
-
NYSE
Salesforce.Com Inc
INTERNET - Internet Software and Services
|
$100.07
|
+0.30
0.30% |
$101.49
|
2,703,318
94.98% of 50 DAV
50 DAV is 2,846,200
|
$100.30
-0.23%
|
6/2/2010
|
$88.44
|
PP = $89.60
|
|
MB = $94.08
|
Most Recent Note - 7/23/2010 3:50:39 PM
G - Rising to a new 52-week high today with a considerable gain on near average volume, clearing a choppy 7-week base.
>>> The latest Featured Stock Update with an annotated graph appeared on 7/15/2010. Click here.
View all notes |
Alert me of new notes |
CANSLIM.net Company Profile |
SEC |
Zacks Reports |
StockTalk |
News |
Chart |
Request a new note
C
A N
S L
I M
|
FFIV
-
NASDAQ
F 5 Networks Inc
INTERNET - Internet Software and Services
|
$87.48
|
+0.27
0.31% |
$87.69
|
1,785,762
99.77% of 50 DAV
50 DAV is 1,789,800
|
$87.35
0.15%
|
6/16/2010
|
$74.50
|
PP = $74.10
|
|
MB = $77.81
|
Most Recent Note - 7/23/2010 1:01:02 PM
G - Hitting another new 52-week high and getting more extended from a sound base today following a considerable 7/22/10 gap up gain on very heavy volume after reporting strong results for the latest quarter ended June 30, 2010. As we have often noted in the past, volume and volatility increase near earnings news. Be sure to check headlines via the "News" links for greater visibility or contact the companies directly if pending earnings news is not otherwise noted.
>>> The latest Featured Stock Update with an annotated graph appeared on 7/7/2010. Click here.
View all notes |
Alert me of new notes |
CANSLIM.net Company Profile |
SEC |
Zacks Reports |
StockTalk |
News |
Chart |
Request a new note
C
A N
S L
I M
|
Symbol/Exchange
Company Name
Industry Group |
PRICE |
CHANGE
(%Change) |
Day High |
Volume
(% DAV)
(% 50 day avg vol) |
52 Wk Hi
% From Hi |
Featured
Date |
Price
Featured |
Pivot Featured |
|
Max Buy |
MELI
-
NASDAQ
Mercadolibre Inc
INTERNET - Internet Software and; Services
|
$65.15
|
+3.68
5.99% |
$65.99
|
1,418,637
150.26% of 50 DAV
50 DAV is 944,100
|
$62.46
4.31%
|
5/13/2010
|
$54.21
|
PP = $55.85
|
|
MB = $58.64
|
Most Recent Note - 7/26/2010 1:38:05 PM
G - Gapped up today and cleared a choppy 6-week consolidation for a new 52-week high after finding prompt support near its 50 DMA line recently.
>>> The latest Featured Stock Update with an annotated graph appeared on 7/23/2010. Click here.
View all notes |
Alert me of new notes |
CANSLIM.net Company Profile |
SEC |
Zacks Reports |
StockTalk |
News |
Chart |
Request a new note
C
A N
S L
I M
|
NEM
-
NYSE
Newmont Mining Corp
METALS and MINING - Gold
|
$58.10
|
-0.95
-1.61% |
$59.50
|
6,298,470
68.61% of 50 DAV
50 DAV is 9,180,600
|
$63.38
-8.33%
|
6/22/2010
|
$59.60
|
PP = $59.67
|
|
MB = $62.65
|
Most Recent Note - 7/23/2010 4:02:23 PM
G - Posted yet another small gain today with lighter volume, sputtering just above its 50 DMA line and prior chart highs that define support to watch.
>>> The latest Featured Stock Update with an annotated graph appeared on 7/9/2010. Click here.
View all notes |
Alert me of new notes |
CANSLIM.net Company Profile |
SEC |
Zacks Reports |
StockTalk |
News |
Chart |
Request a new note
C
A N
S L
I M
|
NEOG
-
NASDAQ
Neogen Corp
DRUGS - Diagnostic Substances
|
$29.17
|
+0.86
3.04% |
$29.17
|
102,598
110.80% of 50 DAV
50 DAV is 92,600
|
$28.37
2.82%
|
7/22/2010
|
$27.19
|
PP = $27.87
|
|
MB = $29.26
|
Most Recent Note - 7/26/2010 4:01:42 PM
Y - Today's gain on lighter volume helped it rise further above its pivot point but the volume total was again below guidelines for a proper technical buy signal. It faces no resistance due to overhead supply. Featured in yellow the 7/22/10 mid-day report (read here).
>>> The latest Featured Stock Update with an annotated graph appeared on 7/22/2010. Click here.
View all notes |
Alert me of new notes |
CANSLIM.net Company Profile |
SEC |
Zacks Reports |
StockTalk |
News |
Chart |
Request a new note
C
A N
S L
I M
|
ROVI
-
NASDAQ
Rovi Corp
COMPUTER SOFTWARE andamp; SERVICES - Security Software andamp; Services
|
$44.66
|
+1.12
2.57% |
$44.77
|
1,110,182
83.65% of 50 DAV
50 DAV is 1,327,200
|
$44.02
1.45%
|
6/3/2010
|
$38.70
|
PP = $40.16
|
|
MB = $42.17
|
Most Recent Note - 7/26/2010 4:05:08 PM
G - Hit another new 52-week high today with its 3rd consecutive gain on light volume. Earnings news is due 7/29/10 after the close. Support is defined by prior resistance in the $40 area and its 50 DMA line.
>>> The latest Featured Stock Update with an annotated graph appeared on 7/21/2010. Click here.
View all notes |
Alert me of new notes |
CANSLIM.net Company Profile |
SEC |
Zacks Reports |
StockTalk |
News |
Chart |
Request a new note
C
A N
S L
I M
|
THOR
-
NASDAQ
Thoratec Corp
HEALTH SERVICES - Medical Instruments and Supplies
|
$44.01
|
+1.20
2.80% |
$44.06
|
677,343
69.75% of 50 DAV
50 DAV is 971,100
|
$47.93
-8.18%
|
6/3/2010
|
$44.38
|
PP = $45.35
|
|
MB = $47.62
|
Most Recent Note - 7/26/2010 4:10:11 PM
Y - This high-ranked Medical Products firm posted a 3rd consecutive gain on light volume and closed above its 50 DMA line today. Earnings news is due after the close on Thursday 7/29/10. Color code is changed to yellow as the prompt rebound above its short-term average, after briefly undercutting its prior chart low, helped its outlook improve.
>>> The latest Featured Stock Update with an annotated graph appeared on 7/16/2010. Click here.
View all notes |
Alert me of new notes |
CANSLIM.net Company Profile |
SEC |
Zacks Reports |
StockTalk |
News |
Chart |
Request a new note
C
A N
S L
I M
|
Symbol/Exchange
Company Name
Industry Group |
PRICE |
CHANGE
(%Change) |
Day High |
Volume
(% DAV)
(% 50 day avg vol) |
52 Wk Hi
% From Hi |
Featured
Date |
Price
Featured |
Pivot Featured |
|
Max Buy |
ULTA
-
NASDAQ
Ulta Salon Cosm & Frag
SPECIALTY RETAIL - Specialty Retail, Other
|
$25.43
|
+0.69
2.79% |
$25.50
|
444,298
62.49% of 50 DAV
50 DAV is 711,000
|
$26.75
-4.93%
|
5/28/2010
|
$25.58
|
PP = $25.86
|
|
MB = $27.15
|
Most Recent Note - 7/26/2010 4:16:57 PM
G - Closed -5% off its 52-week high after a 3rd consecutive gain today with light volume, but it has not formed a sound new base since its prior breakout attempt failed. Prior lows in the $22 area define the next support level just above its 200 DMA line.
>>> The latest Featured Stock Update with an annotated graph appeared on 7/19/2010. Click here.
View all notes |
Alert me of new notes |
CANSLIM.net Company Profile |
SEC |
Zacks Reports |
StockTalk |
News |
Chart |
Request a new note
C
A N
S L
I M
|
VIT
-
NYSE
Vanceinfo Tech Inc Ads
COMPUTER SOFTWARE and SERVICES - Business Software and Services
|
$26.14
|
-1.26
-4.60% |
$27.50
|
579,586
91.78% of 50 DAV
50 DAV is 631,500
|
$27.59
-5.26%
|
7/8/2010
|
$25.20
|
PP = $26.58
|
|
MB = $27.91
|
Most Recent Note - 7/26/2010 2:43:43 PM
Y - Today's loss is erasing most of its prior gain for a new 52-week high with volume near average, not sufficient (+50% above average volume or greater is required) to trigger a proper technical buy signal. It did not yet trigger a technical buy signal with respect to the pivot point cited after gapping up on 7/08/10, when it briefly matched its all-time high and appeared in the mid-day report (read here).
>>> The latest Featured Stock Update with an annotated graph appeared on 7/26/2010. Click here.
View all notes |
Alert me of new notes |
CANSLIM.net Company Profile |
SEC |
Zacks Reports |
StockTalk |
News |
Chart |
Request a new note
C
A N
S L
I M
|
|
|
|
THESE ARE NOT BUY RECOMMENDATIONS!
Comments contained in the body of this report are technical
opinions only. The material herein has been obtained
from sources believed to be reliable and accurate, however,
its accuracy and completeness cannot be guaranteed.
This site is not an investment advisor, hence it does
not endorse or recommend any securities or other investments.
Any recommendation contained in this report may not
be suitable for all investors and it is not to be deemed
an offer or solicitation on our part with respect to
the purchase or sale of any securities. All trademarks,
service marks and trade names appearing in this report
are the property of their respective owners, and are
likewise used for identification purposes only.
This report is a service available
only to active Paid Premium Members.
You may opt-out of receiving report notifications
at any time. Questions or comments may be submitted
by writing to Premium Membership Services 665 S.E. 10 Street, Suite 201 Deerfield Beach, FL 33441-5634 or by calling 1-800-965-8307
or 954-785-1121.
|
|
|


