You are not logged in.
This means you
CAN ONLY VIEW reports that were published prior to Monday, April 14, 2025.
You
MUST UPGRADE YOUR MEMBERSHIP if you want to see any current reports.
AFTER MARKET UPDATE - THURSDAY, JULY 21ST, 2011
Previous After Market Report Next After Market Report >>>
|
|
|
|
DOW |
+155.64 |
12,727.55 |
+1.24% |
|
Volume |
969,158,720 |
+22% |
|
Volume |
223,343,549 |
-88% |
|
NASDAQ |
+20.20 |
2,834.43 |
+0.72% |
|
Advancers |
2,430 |
78% |
|
Advancers |
1,763 |
66% |
|
S&P 500 |
+18.36 |
1,344.20 |
+1.38% |
|
Decliners |
590 |
19% |
|
Decliners |
832 |
31% |
|
Russell 2000 |
+8.66 |
841.00 |
+1.04% |
|
52 Wk Highs |
147 |
|
|
52 Wk Highs |
80 |
|
|
S&P 600 |
+4.97 |
453.34 |
+1.11% |
|
52 Wk Lows |
19 |
|
|
52 Wk Lows |
19 |
|
|
 |
Volume Increases Behind More Constructive Gains
Kenneth J. Gruneisen - Passed the CAN SLIM® Master's Exam
The major averages closed unanimously higher with higher volume totals on both major exchanges on Thursday, action suggesting that institutional investors were accumulating stocks. Advancing issues beat decliners by more than 4-1 on the NYSE and by 2-1 on the Nasdaq exchange. New 52-week highs outnumbered new 52-week lows on the NYSE and on the Nasdaq exchange again. There were 62 high-ranked companies from the CANSLIM.net Leaders List that made new 52-week highs and appeared on the CANSLIM.net BreakOuts Page, up from the total of 44 on the prior session. The action in high-ranked leaders was more evenly mixed as there were 9 gainers out of the 18 high-ranked leaders currently included on the Featured Stocks Page.
It was reported that European Financial Stability Facility plans to guarantee Greek bonds to make it easier for the European Central Bank to accept a default on Greek debt. The plan was designed to erect a firewall around Spain and Italy. Financial stocks led the advance as European banks soared on the news, including Royal Bank of Scotland Group Plc (RBS +7.06%). The euro rose to the highest in two weeks against the dollar. Meanwhile, two U.S. economic reports also boosted market sentiment. The index of leading economic indicators climbed 0.3% in June, ahead of expectations, and the July Philly Fed index expanded more than forecast.
Strong earnings, a major merger, and signs that a deal on the U.S. debt limit may be closer added to the market's optimism. Shares of Medco Health Solutions Inc (MHS +14.43%) surged after Express Scripts Inc (ESRX +5.33%) said it would buy the company for $29.1 billion. Dow components Intel Corp (INTC -0.78%) and American Express Co (AXP +0.90%) posted better-than-expected earnings. Intel dropped after forecasting the overall market for personal computers may grow less than expected. The Travelers Companies inc (TRV +1.10%) fought for a small gain after the company posted its first loss since 2004 following U.S. tornado claims. Morgan Stanley (MS +11.42%) advanced after its second quarter loss was less than expected.
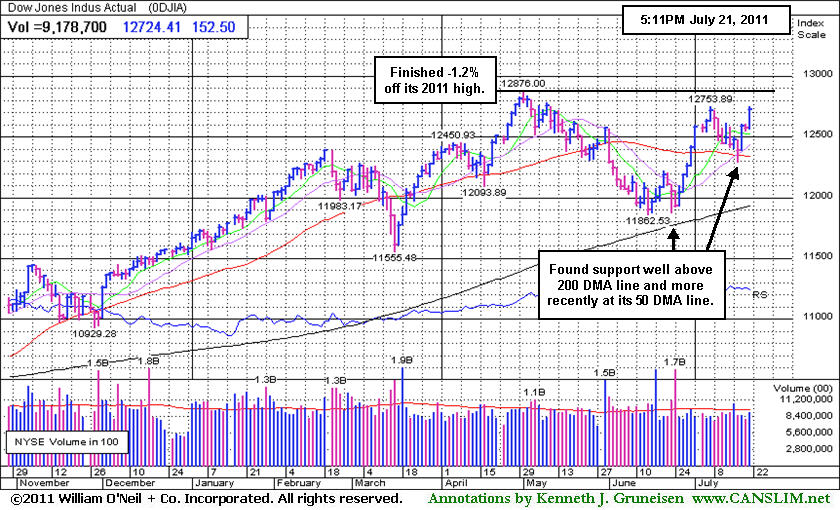
The S&P 500 Index, Dow Jones Industrial Average, and Nasdaq Composite Index all have found support at their respective 50-day moving average (DMA) lines. Any subsequent losses violating their short-term averages and recent lows would obviously bode poorly for the market outlook.
The July 2011 issue of CANSLIM.net News is now available (click here) and the Q2 2011 CANSLIM.net Webcast is also still available "ON DEMAND" to UPGRADED MEMBERS ONLY - (CLICK HERE).
PICTURED: The Dow Jones Industrial Average finished -1.2% off its 2011 high. It found support well above its 200-day moving average (DMA) line, and more recently found support at its 50 DMA line.
|
 Kenneth J. Gruneisen started out as a licensed stockbroker in August 1987, a couple of months prior to the historic stock market crash that took the Dow Jones Industrial Average down -22.6% in a single day. He has published daily fact-based fundamental and technical analysis on high-ranked stocks online for two decades. Through FACTBASEDINVESTING.COM, Kenneth provides educational articles, news, market commentary, and other information regarding proven investment systems that work in good times and bad.
Comments contained in the body of this report are technical opinions only and are not necessarily those of Gruneisen Growth Corp. The material herein has been obtained from sources believed to be reliable and accurate, however, its accuracy and completeness cannot be guaranteed. Our firm, employees, and customers may effect transactions, including transactions contrary to any recommendation herein, or have positions in the securities mentioned herein or options with respect thereto. Any recommendation contained in this report may not be suitable for all investors and it is not to be deemed an offer or solicitation on our part with respect to the purchase or sale of any securities. |
|
 |
Financial Groups Underpin Rally With Big Gains
Kenneth J. Gruneisen - Passed the CAN SLIM® Master's Exam
Financial shares were standout gainers as the Bank Index ($BKX +2.32%) and Broker/Dealer Index ($XBD +3.30%) rallied for a third consecutive session. Energy-related shares had a positive bias as the Integrated Oil Index ($XOI +1.96%) outpaced the Oil Services Index ($OSX +0.82%). The Healthcare Index ($HMO +1.20%) posted a solid gain and the Biotechnology Index ($BTK +1.77%) led the tech sector. The Semiconductor Index ($SOX +0.95%) posted a solid gain while the Networking Index ($NWX -0.35%) and Internet Index ($IIX -0.05%) finished slightly in the red. The Retail Index ($RLX +0.36%) posted a small gain, meanwhile the Gold & Silver Index ($XAU -0.52%) edged lower.
Charts courtesy www.stockcharts.com
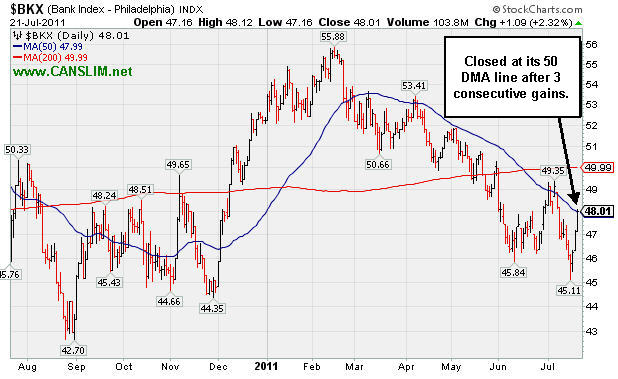
PICTURED: The Bank Index ($BKX +2.32%) closed at its 50-day moving average line after 3 consecutive gains. Its worrisome trend of lower highs and lower lows since February remains intact.
| Oil Services |
$OSX |
275.94 |
+2.24 |
+0.82% |
+12.57% |
| Healthcare |
$HMO |
2,449.80 |
+28.94 |
+1.20% |
+44.79% |
| Integrated Oil |
$XOI |
1,345.26 |
+25.81 |
+1.96% |
+10.89% |
| Semiconductor |
$SOX |
398.88 |
+3.77 |
+0.95% |
-3.14% |
| Networking |
$NWX |
289.42 |
-1.01 |
-0.35% |
+3.16% |
| Internet |
$IIX |
313.75 |
-0.15 |
-0.05% |
+1.96% |
| Broker/Dealer |
$XBD |
109.51 |
+3.51 |
+3.31% |
-9.87% |
| Retail |
$RLX |
547.80 |
+2.19 |
+0.40% |
+7.75% |
| Gold & Silver |
$XAU |
217.93 |
-1.13 |
-0.52% |
-3.82% |
| Bank |
$BKX |
48.06 |
+1.14 |
+2.43% |
-7.95% |
| Biotech |
$BTK |
1,454.76 |
+25.24 |
+1.77% |
+12.11% |
|
|
|
 |
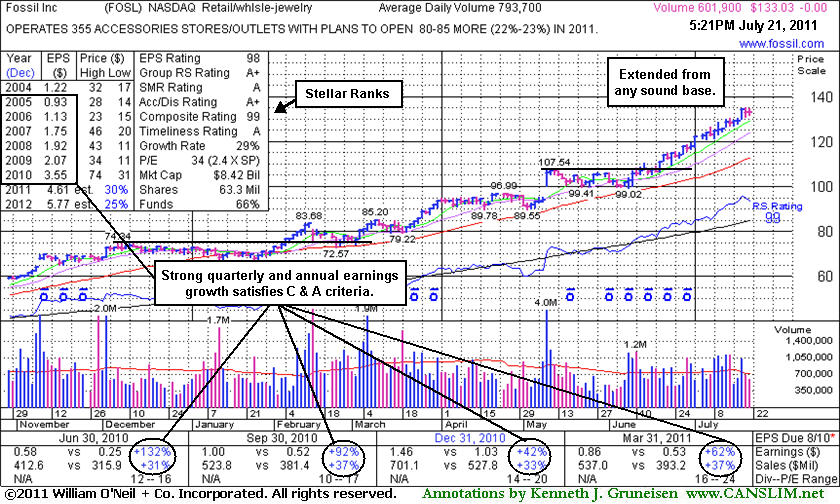
Extended From Any Sound Base After Steady Climb
Kenneth J. Gruneisen - Passed the CAN SLIM® Master's Exam
Fossil Inc (FOSL $133.03) finished unchanged today, perched at its all-time high. Its 50-day moving average (DMA) line and prior highs in the $107 area now define support to watch. Since last shown in this FSU section on 6/28/11 with an annotated graph under the headline, "Wedging Higher After Late Stage Base", it added more gains on lighter than average volume, then continued rallying with a spurt of gains in recent weeks backed by above average volume. It may go on to produce more climactic gains, however disciplined investors avoid chasing extended stocks. Success might be more likely with a fresh breakout, rather than one which has run up considerably after multiple bases.
The number of top-rated funds owning its shares rose from 523 in Sep '10 to 614 in Jun '11 a reassuring sign concerning the I criteria of the investment system. It reported strong earnings +62% on +37% sales revenues for the quarter ended March 31, 2011 versus the year ago period. Its strong earnings history satisfies the C and A criteria. Much earlier, FOSL appeared in this section near $44 on 8/11/10 under the headline, "Breakaway Gap On More Than Triple Average Volume". It was featured in yellow in the 8/10/10 mid-day report (read here) and has subsequently traded as much as +200% higher.
|
|
|
Color Codes Explained :
Y - Better candidates highlighted by our
staff of experts.
G - Previously featured
in past reports as yellow but may no longer be buyable under the
guidelines.
***Last / Change / Volume data in this table is the closing quote data***
Symbol/Exchange
Company Name
Industry Group |
PRICE |
CHANGE
(%Change) |
Day High |
Volume
(% DAV)
(% 50 day avg vol) |
52 Wk Hi
% From Hi |
Featured
Date |
Price
Featured |
Pivot Featured |
|
Max Buy |
CACC
-
NASDAQ
Credit Acceptance Corp
FINANCIAL SERVICES - Credit Services
|
$84.04
|
+1.44
1.74% |
$84.62
|
25,287
63.38% of 50 DAV
50 DAV is 39,900
|
$86.87
-3.26%
|
6/2/2011
|
$76.10
|
PP = $82.39
|
|
MB = $86.51
|
 Most Recent Note - 7/21/2011 3:21:09 PM
Y - Today's 3rd consecutive gain on light volume continues its quiet consolidation above prior high closes that define support to watch above its 50 DMA line.
>>> The latest Featured Stock Update with an annotated graph appeared on 6/27/2011. Click here.
View all notes |
Alert me of new notes |
CANSLIM.net Company Profile |
SEC |
Zacks Reports |
StockTalk |
News |
Chart |
Request a new note
C
A N
S L
I M


|
CMG
-
NYSE
Chipotle Mexican Grill
LEISURE - Restaurants
|
$328.22
|
-1.80
-0.55% |
$332.43
|
821,452
101.26% of 50 DAV
50 DAV is 811,200
|
$333.71
-1.65%
|
4/1/2011
|
$274.00
|
PP = $275.10
|
|
MB = $288.86
|
Most Recent Note - 7/20/2011 12:54:50 PM
G - Churning above average volume while hovering at all-time highs today, it reported earnings per share +12% on +22% sales revenues for the quarter ended June 30, 2011 versus the year ago period. Fundamentals have raised concern with its 2nd consecutive quarterly comparison with earnings below the +25% guideline. It is also extended from any sound base pattern.
>>> The latest Featured Stock Update with an annotated graph appeared on 7/8/2011. Click here.
View all notes |
Alert me of new notes |
CANSLIM.net Company Profile |
SEC |
Zacks Reports |
StockTalk |
News |
Chart |
Request a new note
C
A N
S L
I M
|
EW
-
NYSE
Edwards Lifesciences Cp
HEALTH SERVICES - Medical Appliances and Equipment
|
$82.55
|
-4.98
-5.69% |
$86.50
|
3,537,390
490.35% of 50 DAV
50 DAV is 721,400
|
$91.82
-10.10%
|
7/6/2011
|
$89.19
|
PP = $90.48
|
|
MB = $95.00
|
Most Recent Note - 7/21/2011 11:14:18 AM
G - Gapped down today, raising concerns while violating its 50 DMA line. Color code is charged to green while it is sinking near its prior lows in the $82 area that may act as support. Due to report earnings after today's close.
>>> The latest Featured Stock Update with an annotated graph appeared on 7/7/2011. Click here.
View all notes |
Alert me of new notes |
CANSLIM.net Company Profile |
SEC |
Zacks Reports |
StockTalk |
News |
Chart |
Request a new note
C
A N
S L
I M
|
EZPW
-
NASDAQ
Ezcorp Inc Cl A
SPECIALTY RETAIL - Specialty Retail, Other
|
$37.81
|
+0.81
2.19% |
$37.91
|
649,278
159.84% of 50 DAV
50 DAV is 406,200
|
$38.66
-2.20%
|
6/13/2011
|
$31.18
|
PP = $33.41
|
|
MB = $35.08
|
Most Recent Note - 7/21/2011 5:42:54 PM
G - Posted a gain today with above average volume. Reported after the close earnings +33% on +17% sales revenues for the quarter ended June 30, 2011. It is very extended from prior highs in the $33 area that define support to watch on pullbacks.
>>> The latest Featured Stock Update with an annotated graph appeared on 7/5/2011. Click here.
View all notes |
Alert me of new notes |
CANSLIM.net Company Profile |
SEC |
Zacks Reports |
StockTalk |
News |
Chart |
Request a new note
C
A N
S L
I M
|
FCFS
-
NASDAQ
First Cash Financial Svs
SPECIALTY RETAIL - Specialty Retail, Other
|
$43.97
|
+2.31
5.54% |
$44.29
|
302,001
159.87% of 50 DAV
50 DAV is 188,900
|
$44.84
-1.94%
|
5/31/2011
|
$42.00
|
PP = $40.23
|
|
MB = $42.24
|
Most Recent Note - 7/21/2011 5:43:28 PM
G - Small gap up today, rallying above its "max buy" level and its color code was changed to green. Reported earnings +45% on +27% sales revenues for the quarter ended June 30, 2011 versus the year ago period. Prior highs in the $40-42 area define initial support areas to watch along with its 50 DMA line.
>>> The latest Featured Stock Update with an annotated graph appeared on 7/18/2011. Click here.
View all notes |
Alert me of new notes |
CANSLIM.net Company Profile |
SEC |
Zacks Reports |
StockTalk |
News |
Chart |
Request a new note
C
A N
S L
I M
|
Symbol/Exchange
Company Name
Industry Group |
PRICE |
CHANGE
(%Change) |
Day High |
Volume
(% DAV)
(% 50 day avg vol) |
52 Wk Hi
% From Hi |
Featured
Date |
Price
Featured |
Pivot Featured |
|
Max Buy |
FOSL
-
NASDAQ
Fossil Inc
CONSUMER DURABLES - Recreational Goods, Other
|
$133.03
|
+0.00
0.00% |
$134.62
|
601,906
75.84% of 50 DAV
50 DAV is 793,700
|
$134.98
-1.44%
|
2/1/2011
|
$73.30
|
PP = $74.44
|
|
MB = $78.16
|
Most Recent Note - 7/21/2011 5:44:42 PM
G - Quietly perched at its all-time high. It may produce more climactic gains but it is very extended from its 50 DMA line and prior highs in the $107 area that define support.
>>> The latest Featured Stock Update with an annotated graph appeared on 7/21/2011. Click here.
View all notes |
Alert me of new notes |
CANSLIM.net Company Profile |
SEC |
Zacks Reports |
StockTalk |
News |
Chart |
Request a new note
C
A N
S L
I M
|
HS
-
NYSE
Healthspring Inc
HEALTH SERVICES - Health Care Plans
|
$45.47
|
+0.07
0.15% |
$46.37
|
613,974
73.68% of 50 DAV
50 DAV is 833,300
|
$48.95
-7.11%
|
6/16/2011
|
$42.44
|
PP = $45.21
|
|
MB = $47.47
|
Most Recent Note - 7/20/2011 6:30:09 PM
Y - Quietly consolidating above prior highs and its pivot point. Volume has been light behind all gains since 7/05/11. Prior resistance near $45 coinciding with its 50 DMA line defines an important support level to watch.
>>> The latest Featured Stock Update with an annotated graph appeared on 7/11/2011. Click here.
View all notes |
Alert me of new notes |
CANSLIM.net Company Profile |
SEC |
Zacks Reports |
StockTalk |
News |
Chart |
Request a new note
C
A N
S L
I M
|
INFA
-
NASDAQ
Informatica Corp
COMPUTER SOFTWARE and SERVICES - Business Software and Services
|
$51.40
|
-0.44
-0.85% |
$52.37
|
3,297,141
241.73% of 50 DAV
50 DAV is 1,364,000
|
$62.42
-17.65%
|
7/1/2011
|
$59.36
|
PP = $60.08
|
|
MB = $63.08
|
Most Recent Note - 7/21/2011 3:07:54 PM
Due to report earnings following today's close. Losses with above average volume have raised more concerns after its 50 DMA line acted as resistance. Based on recent technical weakness it will be dropped from the Featured Stocks list tonight.
>>> The latest Featured Stock Update with an annotated graph appeared on 7/12/2011. Click here.
View all notes |
Alert me of new notes |
CANSLIM.net Company Profile |
SEC |
Zacks Reports |
StockTalk |
News |
Chart |
Request a new note
C
A N
S L
I M
|
LULU
-
NASDAQ
Lululemon Athletica
MANUFACTURING - Textile Manufacturing
|
$63.01
|
-0.75
-1.18% |
$64.20
|
2,165,601
52.12% of 50 DAV
50 DAV is 4,155,100
|
$64.49
-2.29%
|
6/21/2011
|
$102.95
|
PP = $101.14
|
|
MB = $106.20
|
Most Recent Note - 7/19/2011 3:33:57 PM
G - Hitting a new all-time high today, very extended from a sound base and proper buy point. A 2:1 split effective 7/12/11 impacted prices (and prior Featured Price, Pivot Point, and Max Buy levels will soon be adjusted).
>>> The latest Featured Stock Update with an annotated graph appeared on 7/15/2011. Click here.
View all notes |
Alert me of new notes |
CANSLIM.net Company Profile |
SEC |
Zacks Reports |
StockTalk |
News |
Chart |
Request a new note
C
A N
S L
I M
|
MWIV
-
NASDAQ
M W I Veterinary Supply
HEALTH SERVICES - Medical Instruments and; Supplies
|
$82.37
|
+0.92
1.13% |
$82.50
|
32,197
50.86% of 50 DAV
50 DAV is 63,300
|
$86.99
-5.31%
|
7/11/2011
|
$83.39
|
PP = $84.67
|
|
MB = $88.90
|
Most Recent Note - 7/20/2011 1:29:53 PM
Y - Quietly hovering near its 50 DMA line and within -6.2% of all-time highs. Color code was changed to yellow with new pivot point cited based on its 5/20/11 high plus 10 cents. Volume-driven gains are needed to confirm a proper technical buy signal.
>>> The latest Featured Stock Update with an annotated graph appeared on 6/30/2011. Click here.
View all notes |
Alert me of new notes |
CANSLIM.net Company Profile |
SEC |
Zacks Reports |
StockTalk |
News |
Chart |
Request a new note
C
A N
S L
I M
|
Symbol/Exchange
Company Name
Industry Group |
PRICE |
CHANGE
(%Change) |
Day High |
Volume
(% DAV)
(% 50 day avg vol) |
52 Wk Hi
% From Hi |
Featured
Date |
Price
Featured |
Pivot Featured |
|
Max Buy |
OPNT
-
NASDAQ
Opnet Technologies
INTERNET - Internet Software and Services
|
$35.53
|
-1.49
-4.02% |
$37.85
|
268,017
206.33% of 50 DAV
50 DAV is 129,900
|
$42.51
-16.42%
|
6/28/2011
|
$40.87
|
PP = $42.61
|
|
MB = $44.74
|
Most Recent Note - 7/21/2011 2:47:51 PM
Down today with above average volume after violating its 50 DMA line on the prior session with a damaging loss on heavy volume. Raising more serious concerns as it undercuts prior lows in the $36 area previously noted as important near-term chart support. Based on technical weakness it will be dropped from the Featured Stocks list tonight. Gains above its 50 DMA line are needed for its outlook to improve.
>>> The latest Featured Stock Update with an annotated graph appeared on 7/1/2011. Click here.
View all notes |
Alert me of new notes |
CANSLIM.net Company Profile |
SEC |
Zacks Reports |
StockTalk |
News |
Chart |
Request a new note
C
A N
S L
I M
|
OTEX
-
NASDAQ
Open Text Corp
INTERNET - Internet Software and Services
|
$68.77
|
+0.57
0.84% |
$69.98
|
270,745
93.46% of 50 DAV
50 DAV is 289,700
|
$72.32
-4.91%
|
6/1/2011
|
$65.86
|
PP = $67.18
|
|
MB = $70.54
|
Most Recent Note - 7/20/2011 6:37:30 PM
Y - Holding its ground above its pivot point. Volume totals have been cooling since its negative reversal after hitting a new all-time high on 7/14/11. The 7/13/11 gain with volume +187% above average had confirmed a technical buy signal.
>>> The latest Featured Stock Update with an annotated graph appeared on 7/20/2011. Click here.
View all notes |
Alert me of new notes |
CANSLIM.net Company Profile |
SEC |
Zacks Reports |
StockTalk |
News |
Chart |
Request a new note
C
A N
S L
I M
|
PRGO
-
NASDAQ
Perrigo Co
DRUGS - Drug Related Products
|
$94.32
|
+1.84
1.99% |
$94.61
|
547,897
120.07% of 50 DAV
50 DAV is 456,300
|
$94.10
0.23%
|
7/13/2011
|
$92.89
|
PP = $92.40
|
|
MB = $97.02
|
Most Recent Note - 7/20/2011 6:40:01 PM
Y - Gapped up today touching a new high, but it lacked volume conviction and promptly reversed into the red for a quiet loss. A strong volume-driven gain and close above its pivot point may trigger a technical buy signal, however it is considered a riskier late-stage setup.
>>> The latest Featured Stock Update with an annotated graph appeared on 7/13/2011. Click here.
View all notes |
Alert me of new notes |
CANSLIM.net Company Profile |
SEC |
Zacks Reports |
StockTalk |
News |
Chart |
Request a new note
C
A N
S L
I M
|
QSII
-
NASDAQ
Quality Systems Inc
COMPUTER SOFTWARE and SERVICES - Healthcare Information Service
|
$89.75
|
+2.10
2.40% |
$89.90
|
220,881
96.58% of 50 DAV
50 DAV is 228,700
|
$92.38
-2.85%
|
7/6/2011
|
$91.26
|
PP = $91.67
|
|
MB = $96.25
|
Most Recent Note - 7/21/2011 3:01:34 PM
G - Small gap up gain today without great volume, rallying just -3% from its all-time high. Found support at its 50 DMA line during its recent consolidation after failing to trigger a technical buy signal.
>>> The latest Featured Stock Update with an annotated graph appeared on 7/6/2011. Click here.
View all notes |
Alert me of new notes |
CANSLIM.net Company Profile |
SEC |
Zacks Reports |
StockTalk |
News |
Chart |
Request a new note
C
A N
S L
I M
|
SWI
-
NYSE
Solarwinds Inc
COMPUTER SOFTWARE and SERVICES - Application Software
|
$22.49
|
-0.95
-4.05% |
$23.57
|
1,822,127
208.82% of 50 DAV
50 DAV is 872,600
|
$26.68
-15.70%
|
6/7/2011
|
$24.22
|
PP = $25.05
|
|
MB = $26.30
|
Most Recent Note - 7/21/2011 2:36:17 PM
Down today on above average volume for its 9th loss in the span of 10 sessions. Prior lows in the $22 area and its 200 DMA line may act as resistance, however due to its technical deterioration it will be dropped from the Featured Stocks list tonight. A rebound above its 50 DMA line is needed fro its outlook to improve.
>>> The latest Featured Stock Update with an annotated graph appeared on 6/29/2011. Click here.
View all notes |
Alert me of new notes |
CANSLIM.net Company Profile |
SEC |
Zacks Reports |
StockTalk |
News |
Chart |
Request a new note
C
A N
S L
I M
|
Symbol/Exchange
Company Name
Industry Group |
PRICE |
CHANGE
(%Change) |
Day High |
Volume
(% DAV)
(% 50 day avg vol) |
52 Wk Hi
% From Hi |
Featured
Date |
Price
Featured |
Pivot Featured |
|
Max Buy |
UA
-
NYSE
Under Armour Inc Cl A
CONSUMER NON-DURABLES - Textile - Apparel Clothing
|
$80.42
|
-0.77
-0.95% |
$82.95
|
1,308,402
109.27% of 50 DAV
50 DAV is 1,197,400
|
$82.66
-2.71%
|
7/19/2011
|
$81.33
|
PP = $81.52
|
|
MB = $85.60
|
Most Recent Note - 7/20/2011 6:26:40 PM
Y - Pulled back today on lighter volume. Its color code was changed to yellow in the 7/19/11 mid-day report with a new pivot point cited after forming a cup-with-handle base pattern. It rallied and closed well above its pivot point, however that session's volume total, at +29% above average, did not reach the minimum threshold to trigger a proper technical buy signal. Subsequent gains could help confirm the breakout. UA found support near earlier lows in the $62 area after it was dropped from the Featured Stocks list on 5/03/11 and it has rebounded impressively. It is due to report earnings on the morning of July 26th.

>>> The latest Featured Stock Update with an annotated graph appeared on 4/29/2011. Click here.
View all notes |
Alert me of new notes |
CANSLIM.net Company Profile |
SEC |
Zacks Reports |
StockTalk |
News |
Chart |
Request a new note
C
A N
S L
I M
|
ULTA
-
NASDAQ
Ulta Salon Cosm & Frag
SPECIALTY RETAIL - Specialty Retail, Other
|
$65.72
|
+0.41
0.63% |
$67.14
|
488,714
54.10% of 50 DAV
50 DAV is 903,300
|
$68.80
-4.48%
|
1/6/2011
|
$36.12
|
PP = $37.34
|
|
MB = $39.21
|
Most Recent Note - 7/19/2011 4:16:43 PM
G - Quiet volume was behind today's gain. It is extended from any sound base pattern and well above its 50 DMA line. It rallied +200% since first featured in yellow at $22.81 in the 3/12/10 mid-day report.
>>> The latest Featured Stock Update with an annotated graph appeared on 7/14/2011. Click here.
View all notes |
Alert me of new notes |
CANSLIM.net Company Profile |
SEC |
Zacks Reports |
StockTalk |
News |
Chart |
Request a new note
C
A N
S L
I M
|
ZAGG
-
NASDAQ
Zagg Inc
SPECIALTY RETAIL - Specialty Retail, Other
|
$15.92
|
-0.14
-0.87% |
$16.90
|
3,574,052
145.29% of 50 DAV
50 DAV is 2,459,900
|
$16.24
-1.97%
|
6/1/2011
|
$10.92
|
PP = $10.59
|
|
MB = $11.12
|
Most Recent Note - 7/21/2011 11:09:54 AM
G - Hit another new all-time high today, getting more extended. No overhead supply remains to act as resistance, however its short V shaped consolidation in recent weeks is not recognized as a sound base pattern. Its 50 DMA line and recent lows define chart support.
>>> The latest Featured Stock Update with an annotated graph appeared on 7/19/2011. Click here.
View all notes |
Alert me of new notes |
CANSLIM.net Company Profile |
SEC |
Zacks Reports |
StockTalk |
News |
Chart |
Request a new note
C
A N
S L
I M
|
|
|
|
THESE ARE NOT BUY RECOMMENDATIONS!
Comments contained in the body of this report are technical
opinions only. The material herein has been obtained
from sources believed to be reliable and accurate, however,
its accuracy and completeness cannot be guaranteed.
This site is not an investment advisor, hence it does
not endorse or recommend any securities or other investments.
Any recommendation contained in this report may not
be suitable for all investors and it is not to be deemed
an offer or solicitation on our part with respect to
the purchase or sale of any securities. All trademarks,
service marks and trade names appearing in this report
are the property of their respective owners, and are
likewise used for identification purposes only.
This report is a service available
only to active Paid Premium Members.
You may opt-out of receiving report notifications
at any time. Questions or comments may be submitted
by writing to Premium Membership Services 665 S.E. 10 Street, Suite 201 Deerfield Beach, FL 33441-5634 or by calling 1-800-965-8307
or 954-785-1121.
|
|
|

