You are not logged in.
This means you
CAN ONLY VIEW reports that were published prior to Tuesday, April 15, 2025.
You
MUST UPGRADE YOUR MEMBERSHIP if you want to see any current reports.
AFTER MARKET UPDATE - FRIDAY, JULY 22ND, 2011
Previous After Market Report Next After Market Report >>>
|
|
|
|
DOW |
-43.25 |
12,681.16 |
-0.34% |
|
Volume |
738,299,540 |
-24% |
|
Volume |
1,630,593,770 |
+630% |
|
NASDAQ |
+24.40 |
2,858.83 |
+0.86% |
|
Advancers |
1,400 |
45% |
|
Advancers |
1,273 |
47% |
|
S&P 500 |
+1.22 |
1,345.02 |
+0.09% |
|
Decliners |
1,546 |
50% |
|
Decliners |
1,306 |
48% |
|
Russell 2000 |
+0.56 |
841.82 |
+0.07% |
|
52 Wk Highs |
102 |
|
|
52 Wk Highs |
79 |
|
|
S&P 600 |
-0.82 |
452.61 |
-0.18% |
|
52 Wk Lows |
23 |
|
|
52 Wk Lows |
23 |
|
|
 |
Mixed Session Ends Constructive Week For Major Averages
Kenneth J. Gruneisen - Passed the CAN SLIM® Master's Exam
For the week, the Dow rose +1.6%, the S&P 500 gained +2.2%, and the Nasdaq rose +2.5%. On Friday the major averages finished the session mixed with much lighter volume totals on both major exchanges. New 52-week highs outnumbered new 52-week lows on the NYSE and on the Nasdaq exchange. Decliners narrowly led advancing issues on the NYSE and on the Nasdaq exchange. There were 42 high-ranked companies from the CANSLIM.net Leaders List that made new 52-week highs and appeared on the CANSLIM.net BreakOuts Page, down from Thursday's total of 62 stocks. There were 9 gainers out of the 17 high-ranked leaders currently included on the Featured Stocks Page, proving that the action in high-ranked leaders was also evenly mixed.
The market continues to be pressured by budget concerns in Washington as an agreement on the debt ceiling remains stubbornly out of reach. On the week, crude rallied +2.7% and posted gains for the fourth week in a row, trading near the $100 per barrel level. Gold traded to highs at $1,607 per ounce.
Technology companies led the tech-heavy Nasdaq Composite Index higher. Chip stocks and data storage firms were inspired by Advanced Micro Devices Inc (AMD +19.2%) Western Digital (WDC +8.28%), and SanDisk Corp (SNDK +9.62%) after all three companies posted earnings that easily topped expectations.
General Electric Co (GE -0.63%), Verizon (VZ -2.21%), and McDonald's Corp (MCD +2.33%) all reported better-than-expected earnings results for the latest quarter. The fast service food giant's shares pegged a new record high as sales increased in the U.S. and Europe. Microsoft Corp (MSFT +1.61%) also rose after beating estimates, countering Caterpillar's first profit miss in ten quarters. Caterpillar Inc (CAT -5.78%) subtracted over 50 points from the Dow Jones Industrial Average, single-handedly sending the blue chip index into the red.
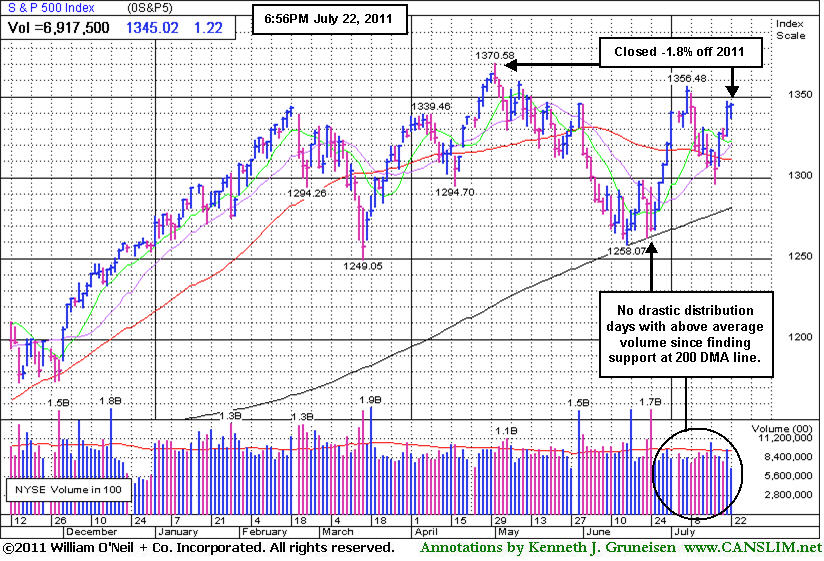
The S&P 500 Index, Dow Jones Industrial Average, and Nasdaq Composite Index all have found support at their respective 50-day moving average (DMA) lines. Any subsequent losses violating their short-term averages and recent lows would obviously bode poorly for the market outlook.
The July 2011 issue of CANSLIM.net News is now available (click here) and the Q2 2011 CANSLIM.net Webcast is also still available "ON DEMAND" to UPGRADED MEMBERS ONLY - (CLICK HERE).
PICTURED: The S&P 500 Index finished -1.8% off its 2011 high. There have been no drastic distribution days with above average volume since it found support at its long-term 200-day moving average (DMA) line.
|
 Kenneth J. Gruneisen started out as a licensed stockbroker in August 1987, a couple of months prior to the historic stock market crash that took the Dow Jones Industrial Average down -22.6% in a single day. He has published daily fact-based fundamental and technical analysis on high-ranked stocks online for two decades. Through FACTBASEDINVESTING.COM, Kenneth provides educational articles, news, market commentary, and other information regarding proven investment systems that work in good times and bad.
Comments contained in the body of this report are technical opinions only and are not necessarily those of Gruneisen Growth Corp. The material herein has been obtained from sources believed to be reliable and accurate, however, its accuracy and completeness cannot be guaranteed. Our firm, employees, and customers may effect transactions, including transactions contrary to any recommendation herein, or have positions in the securities mentioned herein or options with respect thereto. Any recommendation contained in this report may not be suitable for all investors and it is not to be deemed an offer or solicitation on our part with respect to the purchase or sale of any securities. |
|
 |
Semiconductor Group Led Friday's Tech Rally
Kenneth J. Gruneisen - Passed the CAN SLIM® Master's Exam
Weakness in the Bank Index ($BKX -0.40%) and Broker/Dealer Index ($XBD -0.27%) on Friday's session took back only a tiny part of their big gains achieved over the 3 previous sessions. The Healthcare Index ($HMO -0.97%) was a laggard and the Integrated Oil Index ($XOI -0.09%) finished flat, yet strength in commodity prices underpinned gains for the Oil Services Index ($OSX +1.40%) and Gold & Silver Index ($XAU +1.12%). The Retail Index ($RLX +0.28%) and Biotechnology Index ($BTK +0.10%) inched higher while the tech sectors strength gave the Internet Index ($IIX +1.39%) and Networking Index ($NWX +1.93%) a boost.
Charts courtesy www.stockcharts.com
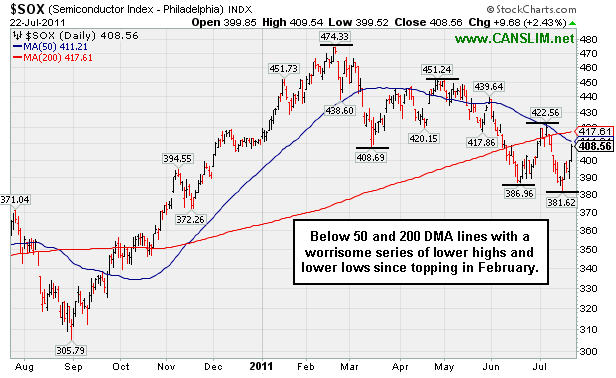
PICTURED: The Semiconductor Index ($SOX +2.43%) is still below its 50 DMA and 200 DMA lines with a worrisome series of lower highs and lower lows since topping in February. A subsequent rally above the most recent peak would help it also get on the right side of both of those important moving averages, which would be good news for tech stocks, technically speaking. When choosing individual stocks always start with companies with solid fundamentals (earnings history), and be sure they are in a strong group that is in healthy shape and leading. If you had a tough time making headway in any semiconductor-related stocks in recent months, this chart helps you get a visual on how the group has been doing, which explains a lot about the performance of chip stocks of late.
| Oil Services |
$OSX |
279.79 |
+3.85 |
+1.40% |
+14.14% |
| Healthcare |
$HMO |
2,425.96 |
-23.85 |
-0.97% |
+43.38% |
| Integrated Oil |
$XOI |
1,344.12 |
-1.18 |
-0.09% |
+10.79% |
| Semiconductor |
$SOX |
408.56 |
+9.68 |
+2.43% |
-0.79% |
| Networking |
$NWX |
294.99 |
+5.57 |
+1.93% |
+5.14% |
| Internet |
$IIX |
318.11 |
+4.37 |
+1.39% |
+3.37% |
| Broker/Dealer |
$XBD |
109.20 |
-0.30 |
-0.27% |
-10.13% |
| Retail |
$RLX |
549.13 |
+1.54 |
+0.28% |
+8.02% |
| Gold & Silver |
$XAU |
220.36 |
+2.43 |
+1.12% |
-2.75% |
| Bank |
$BKX |
47.82 |
-0.19 |
-0.40% |
-8.41% |
| Biotech |
$BTK |
1,456.09 |
+1.47 |
+0.10% |
+12.21% |
|
|
|
 |
Detailed Analysis of Advanced Chart Pattern
Kenneth J. Gruneisen - Passed the CAN SLIM® Master's Exam
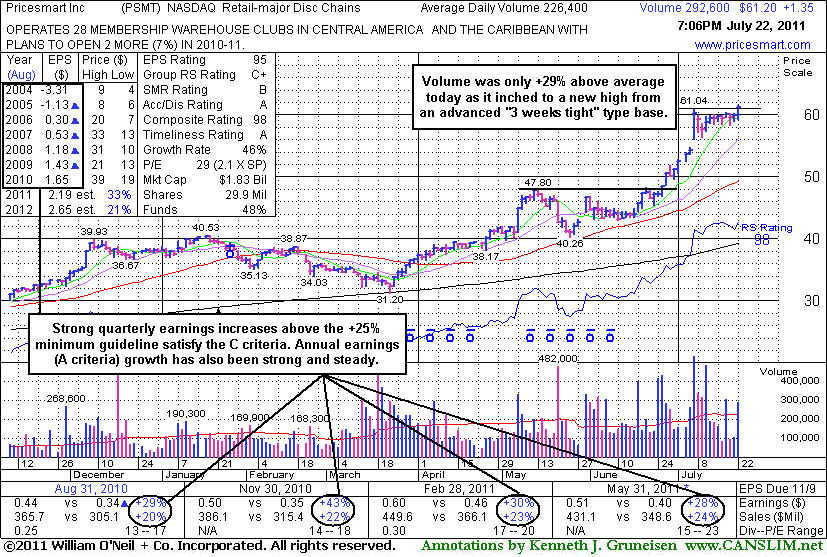
Pricesmart Inc (PSMT +$1.35 or +2.26% to $61.20) finished the session with a gain on +29% above average volume. The minimum volume threshold for a stock to trigger a technical buy signal is +40-50% above average. Most of the market's biggest winners have broken out with big gains on very heavy volume, they did not limp over their pivot points without great volume conviction. This high-ranked leader in the Retail - Major Discount Chains group had seen its volume totals cooling in recent weeks while staying confined to a tight range near its 52-week high, stubbornly holding its ground after an impressive spurt of volume-driven gains. In today's mid-day report (read here) it was highlighted because of an advanced "3-weeks tight" type pattern, and its color code was changed to yellow with pivot point cited based on its 52-week high plus 10 cents.
Volume-driven gains above its pivot point may confirm and trigger a new (or add-on) technical buy signal, however its weekly winning streak is already up to 6 weeks, and it looks like a 3rd stage base. Some breakouts from late-stage bases work, but they are considered riskier and more failure prone. Bullish action has continued since noted in the 6/27/11 mid-day report after rising from a 7-week base-on-base type pattern with no resistance due to overhead supply. Its small supply (S criteria) of only 17.9 million shares in the publicly traded float can contribute to greater volatility in the event of institutional buying or selling. The number of top-rated funds owning its shares rose from 199 in Sept '10 to 224 in Jun '11, which is a reassuring sign concerning the I criteria of the fact-based investment system.
It found support above its 50 DMA line and prior highs in the $40 area during prior consolidations. Recent quarterly comparisons (C criteria) show earnings increases above the +25% guideline versus the year earlier and slow sequential acceleration in its sales revenues increases. Its annual earnings (A criteria) growth has been strong and steady. Regular readers may have seen prior reference to blue triangles beside the yearly earnings numbers in each year from 2005-2009 on the chart below which indicate pre-tax, non-recurring items were included (where possible, such items are normally removed to provide data better suited for comparison).
|
|
|
Color Codes Explained :
Y - Better candidates highlighted by our
staff of experts.
G - Previously featured
in past reports as yellow but may no longer be buyable under the
guidelines.
***Last / Change / Volume data in this table is the closing quote data***
Symbol/Exchange
Company Name
Industry Group |
PRICE |
CHANGE
(%Change) |
Day High |
Volume
(% DAV)
(% 50 day avg vol) |
52 Wk Hi
% From Hi |
Featured
Date |
Price
Featured |
Pivot Featured |
|
Max Buy |
ATHN
-
NASDAQ
Athenahealth Inc
DIVERSIFIED SERVICES - Business/Management Services
|
$57.09
|
+8.51
17.52% |
$60.29
|
3,981,267
1,188.44% of 50 DAV
50 DAV is 335,000
|
$50.56
12.91%
|
7/22/2011
|
$57.30
|
PP = $50.66
|
|
MB = $53.19
|
 Most Recent Note - 7/22/2011 7:58:07 PM
Y - It was highlighted in yellow in today's mid-day report (read here) and finished the session with 11 times average volume. Reported earnings +83% on +33% sales revenues for the quarter ended June 30, 2011 versus the year ago period. The C criteria is satisfied by the past 4 quarterly comparisons showing solid sales and earnings increases above the +25% guideline. Its considerable "breakaway gap" up today for a new all-time high helped it blast above previously noted resistance in the $50 area. It rallied above its 50 and 200 DMA lines with considerable volume-driven gains in recent weeks during its long base pattern. Disciplined investors are careful to not chase extended stocks, however a breakaway gap is one noted exception to the regular guidelines for buying stocks no more than 5% above a prior high or pivot point. Always limit losses if a stock falls -7% from your buy price.
There are no Featured Stock Updates™ available for this stock at this time. You may request one by clicking the Request a New Note link below
View all notes |
Alert me of new notes |
CANSLIM.net Company Profile |
SEC |
Zacks Reports |
StockTalk |
News |
Chart |
Request a new note
C
A N
S L
I M


|
CACC
-
NASDAQ
Credit Acceptance Corp
FINANCIAL SERVICES - Credit Services
|
$82.91
|
-1.13
-1.34% |
$84.50
|
28,171
70.60% of 50 DAV
50 DAV is 39,900
|
$86.87
-4.56%
|
6/2/2011
|
$76.10
|
PP = $82.39
|
|
MB = $86.51
|
Most Recent Note - 7/21/2011 3:21:09 PM
Y - Today's 3rd consecutive gain on light volume continues its quiet consolidation above prior high closes that define support to watch above its 50 DMA line.
>>> The latest Featured Stock Update with an annotated graph appeared on 6/27/2011. Click here.
View all notes |
Alert me of new notes |
CANSLIM.net Company Profile |
SEC |
Zacks Reports |
StockTalk |
News |
Chart |
Request a new note
C
A N
S L
I M
|
CMG
-
NYSE
Chipotle Mexican Grill
LEISURE - Restaurants
|
$335.52
|
+7.30
2.22% |
$336.71
|
1,021,042
125.87% of 50 DAV
50 DAV is 811,200
|
$333.71
0.54%
|
4/1/2011
|
$274.00
|
PP = $275.10
|
|
MB = $288.86
|
Most Recent Note - 7/22/2011 12:55:26 PM
G - Churned above average volume while hovering at all-time highs this week. Reported earnings per share +12% on +22% sales revenues for the quarter ended June 30, 2011 versus the year ago period. Fundamentals have raised concern with its 2nd consecutive quarterly comparison with earnings below the +25% guideline. It is also extended from any sound base pattern.
>>> The latest Featured Stock Update with an annotated graph appeared on 7/8/2011. Click here.
View all notes |
Alert me of new notes |
CANSLIM.net Company Profile |
SEC |
Zacks Reports |
StockTalk |
News |
Chart |
Request a new note
C
A N
S L
I M
|
EW
-
NYSE
Edwards Lifesciences Cp
HEALTH SERVICES - Medical Appliances and Equipment
|
$77.91
|
-4.64
-5.62% |
$82.55
|
5,101,169
707.12% of 50 DAV
50 DAV is 721,400
|
$91.82
-15.15%
|
7/6/2011
|
$89.19
|
PP = $90.48
|
|
MB = $95.00
|
Most Recent Note - 7/22/2011 11:36:10 AM
Violated its 200 DMA line today with another damaging loss on above average volume. Weakness in recent days triggered technical sell signals after failing to confirm a solid buy signal following its latest sound base pattern. Reported earnings +7% on +18% sales revenues for the quarter ended June 30, 2011 versus the year ago period. Based on the fundamental disappointment and technical deterioration it will be dropped from the Featured Stocks list tonight.
>>> The latest Featured Stock Update with an annotated graph appeared on 7/7/2011. Click here.
View all notes |
Alert me of new notes |
CANSLIM.net Company Profile |
SEC |
Zacks Reports |
StockTalk |
News |
Chart |
Request a new note
C
A N
S L
I M
|
EZPW
-
NASDAQ
Ezcorp Inc Cl A
SPECIALTY RETAIL - Specialty Retail, Other
|
$34.24
|
-3.57
-9.44% |
$36.89
|
2,172,318
534.79% of 50 DAV
50 DAV is 406,200
|
$38.66
-11.43%
|
6/13/2011
|
$31.18
|
PP = $33.41
|
|
MB = $35.08
|
Most Recent Note - 7/22/2011 11:26:31 AM
G - Gapped down today and quickly traded near its 50 DMA line and prior highs previously noted as a support level to watch. EZPW reported earnings +33% on +17% sales revenues for the quarter ended June 30, 2011 versus the year ago period. Volume and volatility often increase near earnings announcements. Since late June it was repeatedly noted as "very extended from prior highs".
>>> The latest Featured Stock Update with an annotated graph appeared on 7/5/2011. Click here.
View all notes |
Alert me of new notes |
CANSLIM.net Company Profile |
SEC |
Zacks Reports |
StockTalk |
News |
Chart |
Request a new note
C
A N
S L
I M
|
Symbol/Exchange
Company Name
Industry Group |
PRICE |
CHANGE
(%Change) |
Day High |
Volume
(% DAV)
(% 50 day avg vol) |
52 Wk Hi
% From Hi |
Featured
Date |
Price
Featured |
Pivot Featured |
|
Max Buy |
FCFS
-
NASDAQ
First Cash Financial Svs
SPECIALTY RETAIL - Specialty Retail, Other
|
$43.11
|
-0.86
-1.96% |
$44.38
|
200,427
106.10% of 50 DAV
50 DAV is 188,900
|
$44.84
-3.86%
|
5/31/2011
|
$42.00
|
PP = $40.23
|
|
MB = $42.24
|
Most Recent Note - 7/21/2011 5:43:28 PM
G - Small gap up today, rallying above its "max buy" level and its color code was changed to green. Reported earnings +45% on +27% sales revenues for the quarter ended June 30, 2011 versus the year ago period. Prior highs in the $40-42 area define initial support areas to watch along with its 50 DMA line.
>>> The latest Featured Stock Update with an annotated graph appeared on 7/18/2011. Click here.
View all notes |
Alert me of new notes |
CANSLIM.net Company Profile |
SEC |
Zacks Reports |
StockTalk |
News |
Chart |
Request a new note
C
A N
S L
I M
|
FOSL
-
NASDAQ
Fossil Inc
CONSUMER DURABLES - Recreational Goods, Other
|
$133.01
|
-0.02
-0.02% |
$133.89
|
434,906
54.79% of 50 DAV
50 DAV is 793,700
|
$134.98
-1.46%
|
2/1/2011
|
$73.30
|
PP = $74.44
|
|
MB = $78.16
|
Most Recent Note - 7/21/2011 5:44:42 PM
G - Quietly perched at its all-time high. It may produce more climactic gains but it is very extended from its 50 DMA line and prior highs in the $107 area that define support.
>>> The latest Featured Stock Update with an annotated graph appeared on 7/21/2011. Click here.
View all notes |
Alert me of new notes |
CANSLIM.net Company Profile |
SEC |
Zacks Reports |
StockTalk |
News |
Chart |
Request a new note
C
A N
S L
I M
|
HS
-
NYSE
Healthspring Inc
HEALTH SERVICES - Health Care Plans
|
$45.27
|
-0.20
-0.44% |
$45.64
|
570,009
68.40% of 50 DAV
50 DAV is 833,300
|
$48.95
-7.52%
|
6/16/2011
|
$42.44
|
PP = $45.21
|
|
MB = $47.47
|
Most Recent Note - 7/20/2011 6:30:09 PM
Y - Quietly consolidating above prior highs and its pivot point. Volume has been light behind all gains since 7/05/11. Prior resistance near $45 coinciding with its 50 DMA line defines an important support level to watch.
>>> The latest Featured Stock Update with an annotated graph appeared on 7/11/2011. Click here.
View all notes |
Alert me of new notes |
CANSLIM.net Company Profile |
SEC |
Zacks Reports |
StockTalk |
News |
Chart |
Request a new note
C
A N
S L
I M
|
LULU
-
NASDAQ
Lululemon Athletica
MANUFACTURING - Textile Manufacturing
|
$63.44
|
+0.43
0.68% |
$63.84
|
1,589,776
38.26% of 50 DAV
50 DAV is 4,155,100
|
$64.49
-1.63%
|
6/21/2011
|
$102.95
|
PP = $101.14
|
|
MB = $106.20
|
Most Recent Note - 7/19/2011 3:33:57 PM
G - Hitting a new all-time high today, very extended from a sound base and proper buy point. A 2:1 split effective 7/12/11 impacted prices (and prior Featured Price, Pivot Point, and Max Buy levels will soon be adjusted).
>>> The latest Featured Stock Update with an annotated graph appeared on 7/15/2011. Click here.
View all notes |
Alert me of new notes |
CANSLIM.net Company Profile |
SEC |
Zacks Reports |
StockTalk |
News |
Chart |
Request a new note
C
A N
S L
I M
|
MWIV
-
NASDAQ
M W I Veterinary Supply
HEALTH SERVICES - Medical Instruments and; Supplies
|
$83.11
|
+0.74
0.90% |
$83.40
|
29,090
45.96% of 50 DAV
50 DAV is 63,300
|
$86.99
-4.46%
|
7/11/2011
|
$83.39
|
PP = $84.67
|
|
MB = $88.90
|
Most Recent Note - 7/20/2011 1:29:53 PM
Y - Quietly hovering near its 50 DMA line and within -6.2% of all-time highs. Color code was changed to yellow with new pivot point cited based on its 5/20/11 high plus 10 cents. Volume-driven gains are needed to confirm a proper technical buy signal.
>>> The latest Featured Stock Update with an annotated graph appeared on 6/30/2011. Click here.
View all notes |
Alert me of new notes |
CANSLIM.net Company Profile |
SEC |
Zacks Reports |
StockTalk |
News |
Chart |
Request a new note
C
A N
S L
I M
|
Symbol/Exchange
Company Name
Industry Group |
PRICE |
CHANGE
(%Change) |
Day High |
Volume
(% DAV)
(% 50 day avg vol) |
52 Wk Hi
% From Hi |
Featured
Date |
Price
Featured |
Pivot Featured |
|
Max Buy |
OTEX
-
NASDAQ
Open Text Corp
INTERNET - Internet Software and Services
|
$69.48
|
+0.71
1.03% |
$69.54
|
241,798
83.46% of 50 DAV
50 DAV is 289,700
|
$72.32
-3.93%
|
6/1/2011
|
$65.86
|
PP = $67.18
|
|
MB = $70.54
|
Most Recent Note - 7/20/2011 6:37:30 PM
Y - Holding its ground above its pivot point. Volume totals have been cooling since its negative reversal after hitting a new all-time high on 7/14/11. The 7/13/11 gain with volume +187% above average had confirmed a technical buy signal.
>>> The latest Featured Stock Update with an annotated graph appeared on 7/20/2011. Click here.
View all notes |
Alert me of new notes |
CANSLIM.net Company Profile |
SEC |
Zacks Reports |
StockTalk |
News |
Chart |
Request a new note
C
A N
S L
I M
|
PRGO
-
NASDAQ
Perrigo Co
DRUGS - Drug Related Products
|
$93.68
|
-0.64
-0.68% |
$94.42
|
229,166
50.22% of 50 DAV
50 DAV is 456,300
|
$94.61
-0.98%
|
7/13/2011
|
$92.89
|
PP = $92.40
|
|
MB = $97.02
|
Most Recent Note - 7/20/2011 6:40:01 PM
Y - Gapped up today touching a new high, but it lacked volume conviction and promptly reversed into the red for a quiet loss. A strong volume-driven gain and close above its pivot point may trigger a technical buy signal, however it is considered a riskier late-stage setup.
>>> The latest Featured Stock Update with an annotated graph appeared on 7/13/2011. Click here.
View all notes |
Alert me of new notes |
CANSLIM.net Company Profile |
SEC |
Zacks Reports |
StockTalk |
News |
Chart |
Request a new note
C
A N
S L
I M
|
PSMT
-
NASDAQ
Pricesmart Inc
RETAIL - Drug Stores
|
$61.20
|
+1.35
2.26% |
$61.58
|
294,541
129.70% of 50 DAV
50 DAV is 227,100
|
$61.04
0.26%
|
7/22/2011
|
$60.04
|
PP = $61.14
|
|
MB = $64.20
|
Most Recent Note - 7/22/2011 7:53:56 PM
Y - Volume was only +29% above average as it inched above its pivot point for today's close. Bullish action has continued since noted in the 6/27/11 mid-day report after rising from a 7-week base-on-base type pattern with no resistance due to overhead supply. See the latest FSU analysis for more details and an annotated graph.
>>> The latest Featured Stock Update with an annotated graph appeared on 7/22/2011. Click here.
View all notes |
Alert me of new notes |
CANSLIM.net Company Profile |
SEC |
Zacks Reports |
StockTalk |
News |
Chart |
Request a new note
C
A N
S L
I M
|
QSII
-
NASDAQ
Quality Systems Inc
COMPUTER SOFTWARE and SERVICES - Healthcare Information Service
|
$90.79
|
+1.04
1.16% |
$90.90
|
254,354
111.22% of 50 DAV
50 DAV is 228,700
|
$92.38
-1.72%
|
7/6/2011
|
$91.26
|
PP = $91.67
|
|
MB = $96.25
|
Most Recent Note - 7/21/2011 3:01:34 PM
G - Small gap up gain today without great volume, rallying just -3% from its all-time high. Found support at its 50 DMA line during its recent consolidation after failing to trigger a technical buy signal.
>>> The latest Featured Stock Update with an annotated graph appeared on 7/6/2011. Click here.
View all notes |
Alert me of new notes |
CANSLIM.net Company Profile |
SEC |
Zacks Reports |
StockTalk |
News |
Chart |
Request a new note
C
A N
S L
I M
|
UA
-
NYSE
Under Armour Inc Cl A
CONSUMER NON-DURABLES - Textile - Apparel Clothing
|
$79.67
|
-0.75
-0.93% |
$80.93
|
1,491,403
124.55% of 50 DAV
50 DAV is 1,197,400
|
$82.95
-3.95%
|
7/19/2011
|
$81.33
|
PP = $81.52
|
|
MB = $85.60
|
Most Recent Note - 7/20/2011 6:26:40 PM
Y - Pulled back today on lighter volume. Its color code was changed to yellow in the 7/19/11 mid-day report with a new pivot point cited after forming a cup-with-handle base pattern. It rallied and closed well above its pivot point, however that session's volume total, at +29% above average, did not reach the minimum threshold to trigger a proper technical buy signal. Subsequent gains could help confirm the breakout. UA found support near earlier lows in the $62 area after it was dropped from the Featured Stocks list on 5/03/11 and it has rebounded impressively. It is due to report earnings on the morning of July 26th.

>>> The latest Featured Stock Update with an annotated graph appeared on 4/29/2011. Click here.
View all notes |
Alert me of new notes |
CANSLIM.net Company Profile |
SEC |
Zacks Reports |
StockTalk |
News |
Chart |
Request a new note
C
A N
S L
I M
|
Symbol/Exchange
Company Name
Industry Group |
PRICE |
CHANGE
(%Change) |
Day High |
Volume
(% DAV)
(% 50 day avg vol) |
52 Wk Hi
% From Hi |
Featured
Date |
Price
Featured |
Pivot Featured |
|
Max Buy |
ULTA
-
NASDAQ
Ulta Salon Cosm & Frag
SPECIALTY RETAIL - Specialty Retail, Other
|
$66.02
|
+0.30
0.46% |
$66.44
|
499,117
55.25% of 50 DAV
50 DAV is 903,300
|
$68.80
-4.04%
|
1/6/2011
|
$36.12
|
PP = $37.34
|
|
MB = $39.21
|
Most Recent Note - 7/19/2011 4:16:43 PM
G - Quiet volume was behind today's gain. It is extended from any sound base pattern and well above its 50 DMA line. It rallied +200% since first featured in yellow at $22.81 in the 3/12/10 mid-day report.
>>> The latest Featured Stock Update with an annotated graph appeared on 7/14/2011. Click here.
View all notes |
Alert me of new notes |
CANSLIM.net Company Profile |
SEC |
Zacks Reports |
StockTalk |
News |
Chart |
Request a new note
C
A N
S L
I M
|
ZAGG
-
NASDAQ
Zagg Inc
SPECIALTY RETAIL - Specialty Retail, Other
|
$16.20
|
+0.28
1.76% |
$16.40
|
1,112,360
45.22% of 50 DAV
50 DAV is 2,459,900
|
$16.90
-4.14%
|
6/1/2011
|
$10.92
|
PP = $10.59
|
|
MB = $11.12
|
Most Recent Note - 7/21/2011 11:09:54 AM
G - Hit another new all-time high today, getting more extended. No overhead supply remains to act as resistance, however its short V shaped consolidation in recent weeks is not recognized as a sound base pattern. Its 50 DMA line and recent lows define chart support.
>>> The latest Featured Stock Update with an annotated graph appeared on 7/19/2011. Click here.
View all notes |
Alert me of new notes |
CANSLIM.net Company Profile |
SEC |
Zacks Reports |
StockTalk |
News |
Chart |
Request a new note
C
A N
S L
I M
|
|
|
|
THESE ARE NOT BUY RECOMMENDATIONS!
Comments contained in the body of this report are technical
opinions only. The material herein has been obtained
from sources believed to be reliable and accurate, however,
its accuracy and completeness cannot be guaranteed.
This site is not an investment advisor, hence it does
not endorse or recommend any securities or other investments.
Any recommendation contained in this report may not
be suitable for all investors and it is not to be deemed
an offer or solicitation on our part with respect to
the purchase or sale of any securities. All trademarks,
service marks and trade names appearing in this report
are the property of their respective owners, and are
likewise used for identification purposes only.
This report is a service available
only to active Paid Premium Members.
You may opt-out of receiving report notifications
at any time. Questions or comments may be submitted
by writing to Premium Membership Services 665 S.E. 10 Street, Suite 201 Deerfield Beach, FL 33441-5634 or by calling 1-800-965-8307
or 954-785-1121.
|
|
|

