You are not logged in.
This means you
CAN ONLY VIEW reports that were published prior to Tuesday, April 15, 2025.
You
MUST UPGRADE YOUR MEMBERSHIP if you want to see any current reports.
AFTER MARKET UPDATE - WEDNESDAY, JULY 20TH, 2011
Previous After Market Report Next After Market Report >>>
|
|
|
|
DOW |
-15.51 |
12,571.91 |
-0.12% |
|
Volume |
795,556,470 |
-8% |
|
Volume |
1,814,685,490 |
-1% |
|
NASDAQ |
-12.29 |
2,814.23 |
-0.43% |
|
Advancers |
1,634 |
53% |
|
Advancers |
1,038 |
39% |
|
S&P 500 |
-0.89 |
1,325.84 |
-0.07% |
|
Decliners |
1,357 |
44% |
|
Decliners |
1,546 |
58% |
|
Russell 2000 |
-2.28 |
832.34 |
-0.27% |
|
52 Wk Highs |
95 |
|
|
52 Wk Highs |
71 |
|
|
S&P 600 |
-1.72 |
448.37 |
-0.38% |
|
52 Wk Lows |
19 |
|
|
52 Wk Lows |
34 |
|
|
This is an extra reminder that the July 2011 issue of CANSLIM.net News is now available (click here). A separate email notification was sent earlier today, except to any members who may have unchecked the box for email notifications on the account settings page.
|
 |
High-Ranked Firms Lag While Major Averages Edge Lower
Kenneth J. Gruneisen - Passed the CAN SLIM® Master's Exam
The major averages closed lower with lighter volume totals on Wednesday. Advancing issues beat decliners by 5-4 on the NYSE while declining issues outpaced advancers by 3-2 on the Nasdaq exchange. New 52-week highs outnumbered new 52-week lows on the NYSE and on the Nasdaq exchange again. There were 44 high-ranked companies from the CANSLIM.net Leaders List that made new 52-week highs and appeared on the CANSLIM.net BreakOuts Page, down from the total of 50 on the prior session. The action in high-ranked leaders was disconcertingly negative as there were only 3 gainers out of the 18 high-ranked leaders currently included on the Featured Stocks Page.
Unresolved debt issues in Washington and weak housing data offset earnings reports and merger news. Sales of previously owned U.S. homes unexpectedly declined in June to a seven-month low, a disappointment after Tuesday's numbers on new home sales. Real estate website Zillow Inc (Z +78.85%) spiked higher in its first day of trading.
Declines in health care and consumer companies overshadowed higher-than-estimated earnings at Apple. Apple Inc (AAPL +2.67%) was a standout gainer as sales and earnings easily beat forecasts. Nalco Holding Co (NLC +24.25%) rallied after it agreed to be bought by Ecolab Inc (ECL -7.37%), the largest maker of cleaning chemicals for hotels and restaurants, for $5.4 billion. The Clorox Co (CLX +2.44%) rose after its biggest investor raised his bid for the company.
Dow component United Technologies Corp (UTX -1.80%) hiked its profit forecast for the year, but investors were unimpressed and shares fell. Meanwhile, Boeing Co (BA +2.18%) picked United Tech's competing jet-engine maker to upgrade its 737 model aircraft. Boeing rose after winning an order for 200 planes from AMR Corp (AMR -0.20%) which will buy a combined total of 460 single-aisle jets from Airbus and Boeing. It was hailed as the industry's biggest-ever order, and it allowed Airbus to break Boeing's two-decade hold over the U.S. airline.
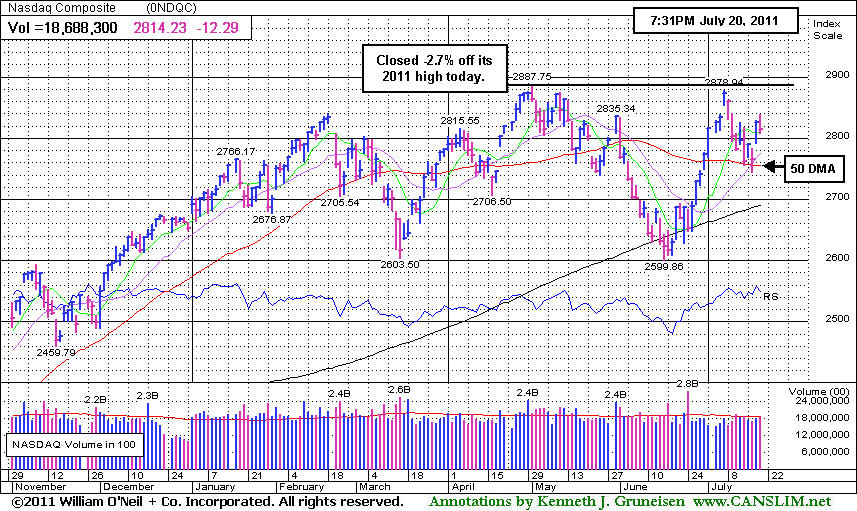
The S&P 500 Index, Dow Jones Industrial Average, and Nasdaq Composite Index all have found support at their respective 50-day moving average (DMA) lines. Any subsequent losses violating their short-term averages and recent lows would obviously bode poorly for the market outlook.
The July 2011 issue of CANSLIM.net News is now available (click here) and the Q2 2011 CANSLIM.net Webcast is also still available "ON DEMAND" to UPGRADED MEMBERS ONLY - (CLICK HERE).
PICTURED: The Nasdaq Composite Index is perched -2.7% off its 2011 high after recent finding support near its 50-day moving average (DMA) line.
|
 Kenneth J. Gruneisen started out as a licensed stockbroker in August 1987, a couple of months prior to the historic stock market crash that took the Dow Jones Industrial Average down -22.6% in a single day. He has published daily fact-based fundamental and technical analysis on high-ranked stocks online for two decades. Through FACTBASEDINVESTING.COM, Kenneth provides educational articles, news, market commentary, and other information regarding proven investment systems that work in good times and bad.
Comments contained in the body of this report are technical opinions only and are not necessarily those of Gruneisen Growth Corp. The material herein has been obtained from sources believed to be reliable and accurate, however, its accuracy and completeness cannot be guaranteed. Our firm, employees, and customers may effect transactions, including transactions contrary to any recommendation herein, or have positions in the securities mentioned herein or options with respect thereto. Any recommendation contained in this report may not be suitable for all investors and it is not to be deemed an offer or solicitation on our part with respect to the purchase or sale of any securities. |
|
 |
Broker/Dealer Index Posts Standout Gain
Kenneth J. Gruneisen - Passed the CAN SLIM® Master's Exam
The tech sector backpedaled as the Internet Index ($IIX -0.94%), Biotechnology Index ($BTK -0.91%), Networking Index ($NWX -0.84%) and Semiconductor Index ($SOX -0.58%) finished with unanimous losses of less than -1%, cooling off following Tuesday's big gains. The Retail Index ($RLX -0.65%) suffered a small loss and energy-related shares dragged the Oil Services Index ($OSX -0.67%) and Integrated Oil Index ($XOI -0.24%) to small losses. The Healthcare Index ($HMO +0.37%) and Gold & Silver Index ($XAU +0.56%) posted small gains. The Broker/Dealer Index ($XBD +3.92%) was a standout gainer and the Bank Index ($BKX +1.45%) posted a decent gain, but financial shares have a lot of damage to repair.
Charts courtesy www.stockcharts.com
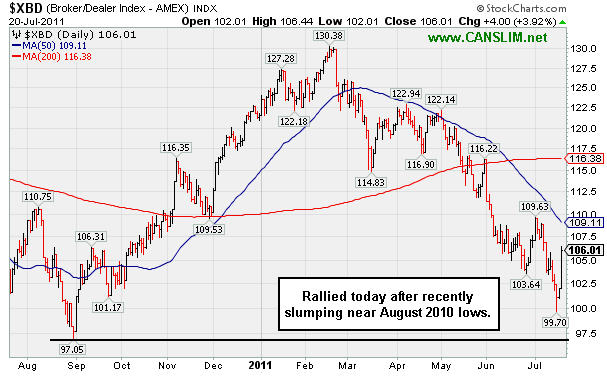
PICTURED: The Broker/Dealer Index ($XBD +3.92%) was a standout gainer, rallying after recently slumping near August 2010 lows.
| Oil Services |
$OSX |
273.70 |
-1.84 |
-0.67% |
+11.66% |
| Healthcare |
$HMO |
2,420.87 |
+8.83 |
+0.37% |
+43.08% |
| Integrated Oil |
$XOI |
1,319.46 |
-3.19 |
-0.24% |
+8.76% |
| Semiconductor |
$SOX |
395.11 |
-2.30 |
-0.58% |
-4.06% |
| Networking |
$NWX |
290.43 |
-2.45 |
-0.84% |
+3.52% |
| Internet |
$IIX |
313.90 |
-2.98 |
-0.94% |
+2.00% |
| Broker/Dealer |
$XBD |
106.01 |
+4.00 |
+3.92% |
-12.76% |
| Retail |
$RLX |
545.61 |
-3.55 |
-0.65% |
+7.32% |
| Gold & Silver |
$XAU |
219.06 |
+1.22 |
+0.56% |
-3.32% |
| Bank |
$BKX |
46.92 |
+0.67 |
+1.45% |
-10.13% |
| Biotech |
$BTK |
1,429.52 |
-13.18 |
-0.91% |
+10.16% |
|
|
|
 |
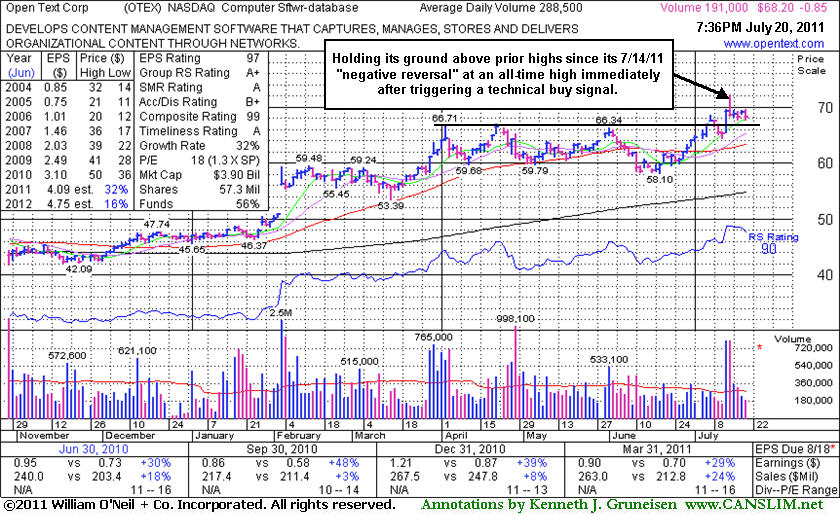
Holding Ground Since Negative Reversal Following Breakout
Kenneth J. Gruneisen - Passed the CAN SLIM® Master's Exam
Open Text Corp (OTEX -$0.85 or -1.23% to $68.20) is holding its ground above its pivot point and prior chart highs that were a stubborn resistance level. Volume totals have been cooling since its "negative reversal" on 7/14/11 after hitting a new all-time high. Its 7/13/11 gain with volume +187% above average had confirmed a technical buy signal. Its last appearance in the FSU section was on 6/24/11 with an annotated graph under the headline, "50-Day Average Acting as Resistance", while its short-term average, the 50-day moving average (DMA) line (the red line), was acting as resistance following earlier damaging losses.
The number of top-rated funds owning its shares rose from 542 in Sep '10 to 604 in Jun '11, a reassuring sign concerning the I criteria. It has a very good annual earnings (the A criteria) history. The 4 latest quarterly earnings increases have been reported above the +25% guideline of the investment system. This Ontario, Canada-based Computer Software - Database firm's sales revenues increased by +24% in the quarter ended March 31, 2011 versus the year ago period. Sales revenues were previously noted at only in the +3-8% range in the Sep '10 and Dec '10 quarters.
|
|
|
Color Codes Explained :
Y - Better candidates highlighted by our
staff of experts.
G - Previously featured
in past reports as yellow but may no longer be buyable under the
guidelines.
***Last / Change / Volume data in this table is the closing quote data***
Symbol/Exchange
Company Name
Industry Group |
PRICE |
CHANGE
(%Change) |
Day High |
Volume
(% DAV)
(% 50 day avg vol) |
52 Wk Hi
% From Hi |
Featured
Date |
Price
Featured |
Pivot Featured |
|
Max Buy |
CACC
-
NASDAQ
Credit Acceptance Corp
FINANCIAL SERVICES - Credit Services
|
$82.60
|
+0.60
0.73% |
$83.02
|
16,393
40.98% of 50 DAV
50 DAV is 40,000
|
$86.87
-4.92%
|
6/2/2011
|
$76.10
|
PP = $82.39
|
|
MB = $86.51
|
Most Recent Note - 7/18/2011 7:37:58 PM
Y - Its loss today on light volume led to a close below its pivot point, raising some concerns. Prior high closes define support to watch above important chart support at its 50 DMA line.
>>> The latest Featured Stock Update with an annotated graph appeared on 6/27/2011. Click here.
View all notes |
Alert me of new notes |
CANSLIM.net Company Profile |
SEC |
Zacks Reports |
StockTalk |
News |
Chart |
Request a new note
C
A N
S L
I M


|
CMG
-
NYSE
Chipotle Mexican Grill
LEISURE - Restaurants
|
$330.02
|
-3.69
-1.11% |
$332.00
|
1,877,246
238.65% of 50 DAV
50 DAV is 786,600
|
$333.71
-1.11%
|
4/1/2011
|
$274.00
|
PP = $275.10
|
|
MB = $288.86
|
 Most Recent Note - 7/20/2011 12:54:50 PM
G - Churning above average volume while hovering at all-time highs today, it reported earnings per share +12% on +22% sales revenues for the quarter ended June 30, 2011 versus the year ago period. Fundamentals have raised concern with its 2nd consecutive quarterly comparison with earnings below the +25% guideline. It is also extended from any sound base pattern.
>>> The latest Featured Stock Update with an annotated graph appeared on 7/8/2011. Click here.
View all notes |
Alert me of new notes |
CANSLIM.net Company Profile |
SEC |
Zacks Reports |
StockTalk |
News |
Chart |
Request a new note
C
A N
S L
I M
|
EW
-
NYSE
Edwards Lifesciences Cp
HEALTH SERVICES - Medical Appliances and Equipment
|
$87.53
|
-2.12
-2.36% |
$90.10
|
1,224,768
170.89% of 50 DAV
50 DAV is 716,700
|
$91.82
-4.67%
|
7/6/2011
|
$89.19
|
PP = $90.48
|
|
MB = $95.00
|
Most Recent Note - 7/20/2011 6:01:40 PM
Y - This high-ranked Medical - Products firm was down today with nearly twice average volume, slumping to its 50 DMA line. Due to report earnings after the close on Thursday, July 21st.
>>> The latest Featured Stock Update with an annotated graph appeared on 7/7/2011. Click here.
View all notes |
Alert me of new notes |
CANSLIM.net Company Profile |
SEC |
Zacks Reports |
StockTalk |
News |
Chart |
Request a new note
C
A N
S L
I M
|
EZPW
-
NASDAQ
Ezcorp Inc Cl A
SPECIALTY RETAIL - Specialty Retail, Other
|
$37.00
|
-0.01
-0.03% |
$37.75
|
279,089
68.86% of 50 DAV
50 DAV is 405,300
|
$38.66
-4.29%
|
6/13/2011
|
$31.18
|
PP = $33.41
|
|
MB = $35.08
|
Most Recent Note - 7/19/2011 4:22:55 PM
G - Small gap up gain today with lighter volume. It is very extended from prior highs in the $33 area that define support to watch on pullbacks.
>>> The latest Featured Stock Update with an annotated graph appeared on 7/5/2011. Click here.
View all notes |
Alert me of new notes |
CANSLIM.net Company Profile |
SEC |
Zacks Reports |
StockTalk |
News |
Chart |
Request a new note
C
A N
S L
I M
|
FCFS
-
NASDAQ
First Cash Financial Svs
SPECIALTY RETAIL - Specialty Retail, Other
|
$41.66
|
-0.88
-2.07% |
$42.31
|
250,586
135.01% of 50 DAV
50 DAV is 185,600
|
$44.84
-7.09%
|
5/31/2011
|
$42.00
|
PP = $40.23
|
|
MB = $42.24
|
Most Recent Note - 7/20/2011 6:33:51 PM
Y - Reported earnings +45% on +27% sales revenues for the quarter ended June 30, 2011 versus the year ago period. Consolidating -7.1% off its all-time high after today's loss on higher volume. Prior highs in the $40-42 area define initial support areas to watch along with its 50 DMA line.
>>> The latest Featured Stock Update with an annotated graph appeared on 7/18/2011. Click here.
View all notes |
Alert me of new notes |
CANSLIM.net Company Profile |
SEC |
Zacks Reports |
StockTalk |
News |
Chart |
Request a new note
C
A N
S L
I M
|
Symbol/Exchange
Company Name
Industry Group |
PRICE |
CHANGE
(%Change) |
Day High |
Volume
(% DAV)
(% 50 day avg vol) |
52 Wk Hi
% From Hi |
Featured
Date |
Price
Featured |
Pivot Featured |
|
Max Buy |
FOSL
-
NASDAQ
Fossil Inc
CONSUMER DURABLES - Recreational Goods, Other
|
$133.03
|
-1.26
-0.94% |
$134.98
|
680,808
85.14% of 50 DAV
50 DAV is 799,600
|
$134.77
-1.29%
|
2/1/2011
|
$73.30
|
PP = $74.44
|
|
MB = $78.16
|
Most Recent Note - 7/19/2011 12:45:20 PM
G - Gapped up today and hit another new all-time high. It may produce more climactic gains but it is very extended from prior highs in the $107 area that now define support to watch near its 50 DMA line.
>>> The latest Featured Stock Update with an annotated graph appeared on 6/28/2011. Click here.
View all notes |
Alert me of new notes |
CANSLIM.net Company Profile |
SEC |
Zacks Reports |
StockTalk |
News |
Chart |
Request a new note
C
A N
S L
I M
|
HS
-
NYSE
Healthspring Inc
HEALTH SERVICES - Health Care Plans
|
$45.40
|
-0.17
-0.37% |
$45.88
|
373,052
44.64% of 50 DAV
50 DAV is 835,600
|
$48.95
-7.25%
|
6/16/2011
|
$42.44
|
PP = $45.21
|
|
MB = $47.47
|
Most Recent Note - 7/20/2011 6:30:09 PM
Y - Quietly consolidating above prior highs and its pivot point. Volume has been light behind all gains since 7/05/11. Prior resistance near $45 coinciding with its 50 DMA line defines an important support level to watch.
>>> The latest Featured Stock Update with an annotated graph appeared on 7/11/2011. Click here.
View all notes |
Alert me of new notes |
CANSLIM.net Company Profile |
SEC |
Zacks Reports |
StockTalk |
News |
Chart |
Request a new note
C
A N
S L
I M
|
INFA
-
NASDAQ
Informatica Corp
COMPUTER SOFTWARE and SERVICES - Business Software and Services
|
$51.84
|
-3.10
-5.64% |
$54.89
|
2,189,264
163.99% of 50 DAV
50 DAV is 1,335,000
|
$62.42
-16.95%
|
7/1/2011
|
$59.36
|
PP = $60.08
|
|
MB = $63.08
|
Most Recent Note - 7/20/2011 6:22:07 PM
G - Today's damaging loss on higher volume led to its lowest close since 5/05/11, raising more concerns following last week's 50 DMA line violation. Due to report earnings following the close on Thursday, July 21st.
>>> The latest Featured Stock Update with an annotated graph appeared on 7/12/2011. Click here.
View all notes |
Alert me of new notes |
CANSLIM.net Company Profile |
SEC |
Zacks Reports |
StockTalk |
News |
Chart |
Request a new note
C
A N
S L
I M
|
LULU
-
NASDAQ
Lululemon Athletica
MANUFACTURING - Textile Manufacturing
|
$63.76
|
+0.25
0.39% |
$64.49
|
2,515,050
60.41% of 50 DAV
50 DAV is 4,163,200
|
$63.96
-0.31%
|
6/21/2011
|
$102.95
|
PP = $101.14
|
|
MB = $106.20
|
Most Recent Note - 7/19/2011 3:33:57 PM
G - Hitting a new all-time high today, very extended from a sound base and proper buy point. A 2:1 split effective 7/12/11 impacted prices (and prior Featured Price, Pivot Point, and Max Buy levels will soon be adjusted).
>>> The latest Featured Stock Update with an annotated graph appeared on 7/15/2011. Click here.
View all notes |
Alert me of new notes |
CANSLIM.net Company Profile |
SEC |
Zacks Reports |
StockTalk |
News |
Chart |
Request a new note
C
A N
S L
I M
|
MWIV
-
NASDAQ
M W I Veterinary Supply
HEALTH SERVICES - Medical Instruments and; Supplies
|
$81.45
|
-1.32
-1.59% |
$83.08
|
89,642
142.29% of 50 DAV
50 DAV is 63,000
|
$86.99
-6.37%
|
7/11/2011
|
$83.39
|
PP = $84.67
|
|
MB = $88.90
|
Most Recent Note - 7/20/2011 1:29:53 PM
Y - Quietly hovering near its 50 DMA line and within -6.2% of all-time highs. Color code was changed to yellow with new pivot point cited based on its 5/20/11 high plus 10 cents. Volume-driven gains are needed to confirm a proper technical buy signal.
>>> The latest Featured Stock Update with an annotated graph appeared on 6/30/2011. Click here.
View all notes |
Alert me of new notes |
CANSLIM.net Company Profile |
SEC |
Zacks Reports |
StockTalk |
News |
Chart |
Request a new note
C
A N
S L
I M
|
Symbol/Exchange
Company Name
Industry Group |
PRICE |
CHANGE
(%Change) |
Day High |
Volume
(% DAV)
(% 50 day avg vol) |
52 Wk Hi
% From Hi |
Featured
Date |
Price
Featured |
Pivot Featured |
|
Max Buy |
OPNT
-
NASDAQ
Opnet Technologies
INTERNET - Internet Software and Services
|
$37.02
|
-2.71
-6.82% |
$39.98
|
308,665
244.58% of 50 DAV
50 DAV is 126,200
|
$42.51
-12.91%
|
6/28/2011
|
$40.87
|
PP = $42.61
|
|
MB = $44.74
|
Most Recent Note - 7/20/2011 5:59:01 PM
G - Violated its 50 DMA line today with a damaging loss on heavy volume, raising concerns. Testing near recent lows in the $36 area previously noted as important near-term chart support.
>>> The latest Featured Stock Update with an annotated graph appeared on 7/1/2011. Click here.
View all notes |
Alert me of new notes |
CANSLIM.net Company Profile |
SEC |
Zacks Reports |
StockTalk |
News |
Chart |
Request a new note
C
A N
S L
I M
|
OTEX
-
NASDAQ
Open Text Corp
INTERNET - Internet Software and Services
|
$68.20
|
-0.85
-1.23% |
$69.67
|
191,125
66.25% of 50 DAV
50 DAV is 288,500
|
$72.32
-5.70%
|
6/1/2011
|
$65.86
|
PP = $67.18
|
|
MB = $70.54
|
Most Recent Note - 7/20/2011 6:37:30 PM
Y - Holding its ground above its pivot point. Volume totals have been cooling since its negative reversal after hitting a new all-time high on 7/14/11. The 7/13/11 gain with volume +187% above average had confirmed a technical buy signal.
>>> The latest Featured Stock Update with an annotated graph appeared on 7/20/2011. Click here.
View all notes |
Alert me of new notes |
CANSLIM.net Company Profile |
SEC |
Zacks Reports |
StockTalk |
News |
Chart |
Request a new note
C
A N
S L
I M
|
PRGO
-
NASDAQ
Perrigo Co
DRUGS - Drug Related Products
|
$92.48
|
-0.65
-0.70% |
$94.10
|
243,519
52.78% of 50 DAV
50 DAV is 461,400
|
$93.70
-1.30%
|
7/13/2011
|
$92.89
|
PP = $92.40
|
|
MB = $97.02
|
Most Recent Note - 7/20/2011 6:40:01 PM
Y - Gapped up today touching a new high, but it lacked volume conviction and promptly reversed into the red for a quiet loss. A strong volume-driven gain and close above its pivot point may trigger a technical buy signal, however it is considered a riskier late-stage setup.
>>> The latest Featured Stock Update with an annotated graph appeared on 7/13/2011. Click here.
View all notes |
Alert me of new notes |
CANSLIM.net Company Profile |
SEC |
Zacks Reports |
StockTalk |
News |
Chart |
Request a new note
C
A N
S L
I M
|
QSII
-
NASDAQ
Quality Systems Inc
COMPUTER SOFTWARE and SERVICES - Healthcare Information Service
|
$87.65
|
-0.92
-1.04% |
$88.65
|
71,620
31.32% of 50 DAV
50 DAV is 228,700
|
$92.38
-5.12%
|
7/6/2011
|
$91.26
|
PP = $91.67
|
|
MB = $96.25
|
Most Recent Note - 7/19/2011 3:57:28 PM
G - Gain today without great volume has halted its slide after slumping to its 50 DMA line with 6 consecutive losses. It did not convincingly trigger a new technical buy signal after recently featured in yellow in the 7/06/11 mid-day report.
>>> The latest Featured Stock Update with an annotated graph appeared on 7/6/2011. Click here.
View all notes |
Alert me of new notes |
CANSLIM.net Company Profile |
SEC |
Zacks Reports |
StockTalk |
News |
Chart |
Request a new note
C
A N
S L
I M
|
SWI
-
NYSE
Solarwinds Inc
COMPUTER SOFTWARE and SERVICES - Application Software
|
$23.44
|
-0.86
-3.54% |
$24.33
|
818,314
94.68% of 50 DAV
50 DAV is 864,300
|
$26.68
-12.14%
|
6/7/2011
|
$24.22
|
PP = $25.05
|
|
MB = $26.30
|
Most Recent Note - 7/20/2011 6:25:22 PM
G - After violating its 50 DMA line that short-term average acted as a resistance level. The loss today on near average volume led to its lowest close since 5/25/11.
>>> The latest Featured Stock Update with an annotated graph appeared on 6/29/2011. Click here.
View all notes |
Alert me of new notes |
CANSLIM.net Company Profile |
SEC |
Zacks Reports |
StockTalk |
News |
Chart |
Request a new note
C
A N
S L
I M
|
Symbol/Exchange
Company Name
Industry Group |
PRICE |
CHANGE
(%Change) |
Day High |
Volume
(% DAV)
(% 50 day avg vol) |
52 Wk Hi
% From Hi |
Featured
Date |
Price
Featured |
Pivot Featured |
|
Max Buy |
UA
-
NYSE
Under Armour Inc Cl A
CONSUMER NON-DURABLES - Textile - Apparel Clothing
|
$81.19
|
-1.21
-1.47% |
$82.44
|
816,022
68.05% of 50 DAV
50 DAV is 1,199,100
|
$82.66
-1.78%
|
7/19/2011
|
$81.33
|
PP = $81.52
|
|
MB = $85.60
|
Most Recent Note - 7/20/2011 6:26:40 PM
Y - Pulled back today on lighter volume. Its color code was changed to yellow in the 7/19/11 mid-day report with a new pivot point cited after forming a cup-with-handle base pattern. It rallied and closed well above its pivot point, however that session's volume total, at +29% above average, did not reach the minimum threshold to trigger a proper technical buy signal. Subsequent gains could help confirm the breakout. UA found support near earlier lows in the $62 area after it was dropped from the Featured Stocks list on 5/03/11 and it has rebounded impressively. It is due to report earnings on the morning of July 26th.

>>> The latest Featured Stock Update with an annotated graph appeared on 4/29/2011. Click here.
View all notes |
Alert me of new notes |
CANSLIM.net Company Profile |
SEC |
Zacks Reports |
StockTalk |
News |
Chart |
Request a new note
C
A N
S L
I M
|
ULTA
-
NASDAQ
Ulta Salon Cosm & Frag
SPECIALTY RETAIL - Specialty Retail, Other
|
$65.31
|
-0.44
-0.67% |
$66.43
|
612,530
68.40% of 50 DAV
50 DAV is 895,500
|
$68.80
-5.07%
|
1/6/2011
|
$36.12
|
PP = $37.34
|
|
MB = $39.21
|
Most Recent Note - 7/19/2011 4:16:43 PM
G - Quiet volume was behind today's gain. It is extended from any sound base pattern and well above its 50 DMA line. It rallied +200% since first featured in yellow at $22.81 in the 3/12/10 mid-day report.
>>> The latest Featured Stock Update with an annotated graph appeared on 7/14/2011. Click here.
View all notes |
Alert me of new notes |
CANSLIM.net Company Profile |
SEC |
Zacks Reports |
StockTalk |
News |
Chart |
Request a new note
C
A N
S L
I M
|
ZAGG
-
NASDAQ
Zagg Inc
SPECIALTY RETAIL - Specialty Retail, Other
|
$16.06
|
+0.74
4.83% |
$16.24
|
2,763,337
113.60% of 50 DAV
50 DAV is 2,432,500
|
$16.00
0.38%
|
6/1/2011
|
$10.92
|
PP = $10.59
|
|
MB = $11.12
|
Most Recent Note - 7/20/2011 1:56:26 PM
G - Small gap up today, inching to a new all-time high. No overhead supply remains to act as resistance, however its short V shaped consolidation in recent weeks is not recognized as a sound base pattern. Its 50 DMA line and recent lows define chart support.
>>> The latest Featured Stock Update with an annotated graph appeared on 7/19/2011. Click here.
View all notes |
Alert me of new notes |
CANSLIM.net Company Profile |
SEC |
Zacks Reports |
StockTalk |
News |
Chart |
Request a new note
C
A N
S L
I M
|
|
|
|
THESE ARE NOT BUY RECOMMENDATIONS!
Comments contained in the body of this report are technical
opinions only. The material herein has been obtained
from sources believed to be reliable and accurate, however,
its accuracy and completeness cannot be guaranteed.
This site is not an investment advisor, hence it does
not endorse or recommend any securities or other investments.
Any recommendation contained in this report may not
be suitable for all investors and it is not to be deemed
an offer or solicitation on our part with respect to
the purchase or sale of any securities. All trademarks,
service marks and trade names appearing in this report
are the property of their respective owners, and are
likewise used for identification purposes only.
This report is a service available
only to active Paid Premium Members.
You may opt-out of receiving report notifications
at any time. Questions or comments may be submitted
by writing to Premium Membership Services 665 S.E. 10 Street, Suite 201 Deerfield Beach, FL 33441-5634 or by calling 1-800-965-8307
or 954-785-1121.
|
|
|

