You are not logged in.
This means you
CAN ONLY VIEW reports that were published prior to Monday, April 14, 2025.
You
MUST UPGRADE YOUR MEMBERSHIP if you want to see any current reports.
AFTER MARKET UPDATE - WEDNESDAY, JULY 21ST, 2010
Previous After Market Report Next After Market Report >>>
|
|
|
|
DOW |
-109.43 |
10,120.53 |
-1.07% |
|
Volume |
1,200,707,740 |
+7% |
|
Volume |
2,176,858,850 |
+15% |
|
NASDAQ |
-35.16 |
2,187.33 |
-1.58% |
|
Advancers |
951 |
30% |
|
Advancers |
672 |
24% |
|
S&P 500 |
-13.89 |
1,069.59 |
-1.28% |
|
Decliners |
2,074 |
66% |
|
Decliners |
1,976 |
71% |
|
Russell 2000 |
-11.60 |
612.64 |
-1.86% |
|
52 Wk Highs |
144 |
|
|
52 Wk Highs |
27 |
|
|
S&P 600 |
-6.18 |
330.53 |
-1.84% |
|
52 Wk Lows |
27 |
|
|
52 Wk Lows |
52 |
|
|
 |
Breadth Negative And Volume Higher As Indices Endure Distribution
Adam Sarhan, Contributing Writer,
President Obama signed into law the Dodd-Frank Wall Street Reform and Consumer Protection Act while Federal Reserve Chairman Ben Bernanke testified on Capitol Hill on Wednesday. Volume, an important indicator of institutional sponsorship, was reported higher than Tuesday's totals on both exchanges while the major averages ended unanimously lower. Decliners trumped advancers by nearly a 2-to-1 ratio on the NYSE and by nearly a 3-to-1 ratio on the Nasdaq exchange. New 52-week highs solidly outnumbered new 52-week lows on the NYSE but trailed on the Nasdaq exchange. There were 23 high-ranked companies from the CANSLIM.net Leaders List that made a new 52-week high and appeared on the CANSLIM.net BreakOuts Page, higher from the 18 issues that appeared on the prior session. For the rally to have ongoing success it will be critical for a healthy crop of leaders to continue showing up hitting new 52-week highs.
A slew of high profile companies released their Q2 results since Tuesday's close and nearly all of them are trading lower which suggests investors are not happy with their results. In other news, President Obama signed the FinReg bill into law today and Ben Bernanke made it clear that the Fed will continue to help the US economy recover from the worst financial crisis since the Great Depression. Bernanke also said that the economic outlook remains "unusually uncertain" without offering additional measures to stimulate growth.
To help keep the current action in proper perspective it is of the utmost importance to filter out the "noise" and focus on how the major averages are performing right now. At this point, all the major averages closed below resistance (their two-month downward trendlines and important moving averages). By definition, the major averages are in a "downtrend" until they close above resistance. Until then, odds favor lower/choppy prices will continue. In addition it is important to note that one of the best ways to determine how the market feels about a specific event (earnings, political, economic, etc.) is to simply analyze how the market reacts to the data. That said, the fact that the major averages can not rally during an otherwise positive earnings season bodes poorly for this nascent rally.
Looking forward, the window remains open for disciplined investors to carefully buy high-ranked stocks. Since the current rally began on July 1, the major averages have rallied on suspiciously light volume for the most part. It is ideal to see volume expand as the major averages break above resistance and see a new batch of high-ranked leaders trigger fresh technical buy signals. These latest improvements are helping to confirm this nascent rally and provide a reassurance that odds are more favorable for successful investing using the fact-based system.
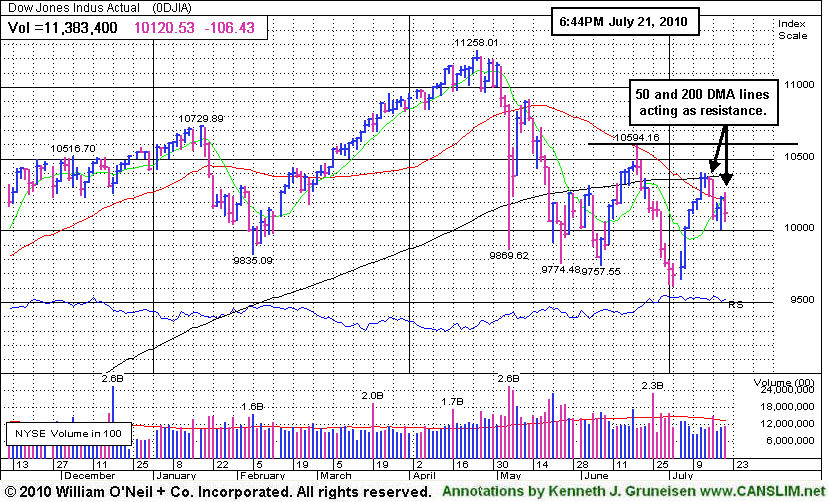
PICTURED:The Dow Jones Industrial Average has recently encountered resistance at its 50-day and 200-day moving average lines. New leadership will be a necessary element if we are to see a subsequent rally above those moving averages, and above its June high. The Nasdaq Composite Index and S&P 500 index are in similar shape at present, and as such, any improvements for the major indices would technically help the overall market outlook turn more bullish.
|
|
|
 |
Widespread Weakness Includes Defensive Groups
Kenneth J. Gruneisen - Passed the CAN SLIM® Master's Exam
Widespread weakness pressured almost every industry group on Wednesday. The Healthcare Index ($HMO -2.93%), Oil Services Index ($OSX -2.79%), Integrated Oil Index ($XOI -1.44%) and generally defensive areas slid. The influential Retail Index ($RLX -1.68%) and financial shares were weak as the Bank Index ($BKX -2.36%) fell harder, yet the Broker/Dealer Index ($XBD -0.87%) slumped less drastically on the session. The tech indices were also weak as the Semiconductor Index ($SOX -1.95%), Internet Index ($IIX -1.77%), Networking Index ($NWX -1.57%) ended unanimously lower by more than -1%, yet the Biotechnology Index ($BTK -0.48%) finished with a smaller loss.
Charts courtesy www.stockcharts.com
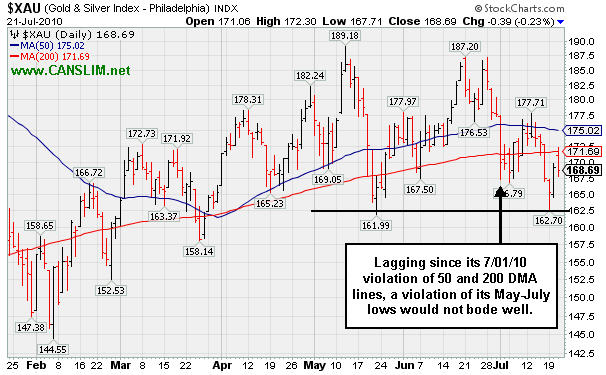
PICTURED: The Gold & Silver Index ($XAU -0.23%) was last shown in this Industry Group Watch section on 7/01/10 as it abruptly violated its 50-day and 200-day moving average lines (read here). It has recently been struggling after encountering resistance near its 50 DMA line. Any subsequent violation of its May-July lows would not bode well for gold-related issues including at least one high-ranked leader from the Mining - Gold/Silver/Gems industry group currently listed on the Featured Stocks page.
| Oil Services |
$OSX |
176.58 |
-5.07 |
-2.79% |
-9.41% |
| Healthcare |
$HMO |
1,391.63 |
-41.99 |
-2.93% |
-5.52% |
| Integrated Oil |
$XOI |
940.11 |
-13.76 |
-1.44% |
-11.99% |
| Semiconductor |
$SOX |
351.13 |
-7.00 |
-1.95% |
-2.44% |
| Networking |
$NWX |
237.00 |
-3.78 |
-1.57% |
+2.57% |
| Internet |
$IIX |
235.91 |
-4.24 |
-1.77% |
+0.88% |
| Broker/Dealer |
$XBD |
101.57 |
-0.89 |
-0.87% |
-11.72% |
| Retail |
$RLX |
393.15 |
-6.71 |
-1.68% |
-4.37% |
| Gold & Silver |
$XAU |
168.69 |
-0.39 |
-0.23% |
+0.26% |
| Bank |
$BKX |
45.85 |
-1.11 |
-2.36% |
+7.35% |
| Biotech |
$BTK |
1,018.57 |
-4.94 |
-0.48% |
+8.11% |
|
|
|
 |
Volume And Volatility Often Increase Near Earnings News
Kenneth J. Gruneisen - Passed the CAN SLIM® Master's Exam
Volume and volatility often increase near earnings news, and investors should be especially watchful during earnings season. It is important to watch the market's reaction to the latest earnings news and guidance. Fundamental news of significance can lead to great and immediate impact on the price and volume of trading.
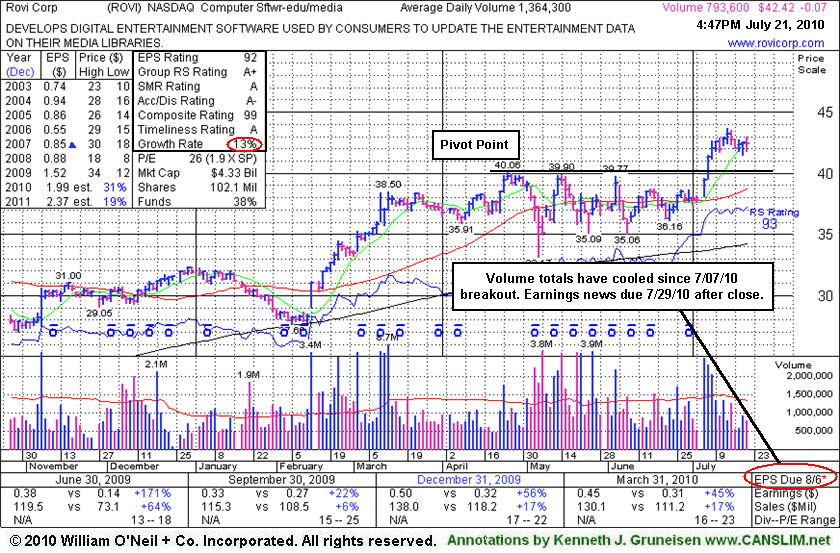
Rovi Corp (ROVI -$0.07 or -0.16% to $42.42) has announced that earnings results for the quarter ended June 30, 2010 will be released on 7/29/10 after the close, not on the date indicated on the annotated graph below. Volume totals have cooled while it has been holding its ground stubbornly just -3% off its 52-week high. Now consolidating slightly above its "max buy" level, its color code was changed to green. Support is defined by prior chart resistance in the $40 area and its 50-day moving average (DMA) line. When last shown in this FSU section under the headline "Outlook Better For High-Ranked Computer Software Firm" on 6/28/2010 we observed - "not a great deal of resistance due to overhead supply. Disciplined investors will await a convincing gain above its pivot point with heavy volume to trigger a new buy signal." A streak of powerful gains soon followed, including its 7/07/10 gain with heavy volume that triggered the latest technical buy signal. Its annual earnings growth (see red circle) has not been especially strong over a 5-year span. Earnings per share increases in 3 of the past 4 quarterly comparisons versus the year ago period showed better than +25% growth.
|
|
|
Color Codes Explained :
Y - Better candidates highlighted by our
staff of experts.
G - Previously featured
in past reports as yellow but may no longer be buyable under the
guidelines.
***Last / Change / Volume data in this table is the closing quote data***
Symbol/Exchange
Company Name
Industry Group |
PRICE |
CHANGE
(%Change) |
Day High |
Volume
(% DAV)
(% 50 day avg vol) |
52 Wk Hi
% From Hi |
Featured
Date |
Price
Featured |
Pivot Featured |
|
Max Buy |
AAPL
-
NASDAQ
Apple Inc
COMPUTER HARDWARE - Personal Computers
|
$254.24
|
+2.35
0.93% |
$265.15
|
42,291,056
144.39% of 50 DAV
50 DAV is 29,289,000
|
$279.01
-8.88%
|
6/17/2010
|
$270.95
|
PP = $272.56
|
|
MB = $286.19
|
 Most Recent Note - 7/21/2010 5:22:18 PM
G - Gapped up today following strong earnings news but it encountered distributional pressure, closing near the session low and below its 50 DMA line. Its recent low near $240 defines an important chart support level to watch, where any subsequent deterioration would raise greater concerns and might trigger a more worrisome technical sell signal.
>>> The latest Featured Stock Update with an annotated graph appeared on 7/12/2010. Click here.
View all notes |
Alert me of new notes |
CANSLIM.net Company Profile |
SEC |
Zacks Reports |
StockTalk |
News |
Chart |
Request a new note
C
A N
S L
I M


|
ABV
-
NYSE
Comp De Bebidas Adr
FOOD and BEVERAGE - Beverages - Brewers
|
$106.31
|
-0.77
-0.72% |
$107.92
|
691,153
93.25% of 50 DAV
50 DAV is 741,200
|
$109.33
-2.76%
|
6/29/2010
|
$104.74
|
PP = $109.33
|
|
MB = $114.80
|
Most Recent Note - 7/20/2010 4:12:42 PM
Y - This Brazil-based beverage firm is trading in a tight range, quietly perched within close striking distance of its 52-week high. It found support near its 50 DMA line recently and has not yet traded above its pivot point since featured in the 6/29/10 mid-day report (read here).
>>> The latest Featured Stock Update with an annotated graph appeared on 7/20/2010. Click here.
View all notes |
Alert me of new notes |
CANSLIM.net Company Profile |
SEC |
Zacks Reports |
StockTalk |
News |
Chart |
Request a new note
C
A N
S L
I M
|
BIDU
-
NASDAQ
Baidu Inc Ads
INTERNET - Internet Information Providers
|
$73.31
|
-0.73
-0.99% |
$76.56
|
18,625,597
130.63% of 50 DAV
50 DAV is 14,258,200
|
$82.29
-10.91%
|
7/14/2010
|
$75.03
|
PP = $78.59
|
|
MB = $82.52
|
Most Recent Note - 7/20/2010 4:15:04 PM
Y - Gain today with light volume helped it close above its 50 DMA line near the session high. Disciplined investors avoid the temptation to get in "early" and watch for a proper technical buy signal.
>>> The latest Featured Stock Update with an annotated graph appeared on 7/14/2010. Click here.
View all notes |
Alert me of new notes |
CANSLIM.net Company Profile |
SEC |
Zacks Reports |
StockTalk |
News |
Chart |
Request a new note
C
A N
S L
I M
|
CRM
-
NYSE
Salesforce.Com Inc
INTERNET - Internet Software and Services
|
$92.16
|
-0.96
-1.03% |
$94.48
|
1,492,850
51.20% of 50 DAV
50 DAV is 2,915,500
|
$97.94
-5.90%
|
6/2/2010
|
$88.44
|
PP = $89.60
|
|
MB = $94.08
|
Most Recent Note - 7/20/2010 4:18:52 PM
G - Gapped down today then positively reversed and closed near the session high for a small gain on light volume.
>>> The latest Featured Stock Update with an annotated graph appeared on 7/15/2010. Click here.
View all notes |
Alert me of new notes |
CANSLIM.net Company Profile |
SEC |
Zacks Reports |
StockTalk |
News |
Chart |
Request a new note
C
A N
S L
I M
|
FFIV
-
NASDAQ
F 5 Networks Inc
INTERNET - Internet Software and Services
|
$73.11
|
-3.68
-4.79% |
$77.74
|
3,195,598
190.11% of 50 DAV
50 DAV is 1,680,900
|
$79.21
-7.70%
|
6/16/2010
|
$74.50
|
PP = $74.10
|
|
MB = $77.81
|
Most Recent Note - 7/21/2010 4:25:35 PM
Y - Following the close it reported strong results for the latest quarter ended June 30, 2010. Volume and volatility often increase near earnings news. It gapped up today and then negatively reversed and closed near the session low with a large loss on volume nearly twice its average. Concerns were raised as it undercut prior highs in the $74-77 area, quickly falling toward its 50 DMA line and upward trendline.
>>> The latest Featured Stock Update with an annotated graph appeared on 7/7/2010. Click here.
View all notes |
Alert me of new notes |
CANSLIM.net Company Profile |
SEC |
Zacks Reports |
StockTalk |
News |
Chart |
Request a new note
C
A N
S L
I M
|
Symbol/Exchange
Company Name
Industry Group |
PRICE |
CHANGE
(%Change) |
Day High |
Volume
(% DAV)
(% 50 day avg vol) |
52 Wk Hi
% From Hi |
Featured
Date |
Price
Featured |
Pivot Featured |
|
Max Buy |
MELI
-
NASDAQ
Mercadolibre Inc
INTERNET - Internet Software and; Services
|
$58.92
|
-1.08
-1.80% |
$60.70
|
449,321
46.80% of 50 DAV
50 DAV is 960,100
|
$62.46
-5.67%
|
5/13/2010
|
$54.21
|
PP = $55.85
|
|
MB = $58.64
|
Most Recent Note - 7/20/2010 4:29:53 PM
G - Gains with lighter volume have followed a considerable 7/16/10 loss with above average volume. Recently it was noted as it wedged to new 52-week high territory with quiet volume behind its gains.
>>> The latest Featured Stock Update with an annotated graph appeared on 6/30/2010. Click here.
View all notes |
Alert me of new notes |
CANSLIM.net Company Profile |
SEC |
Zacks Reports |
StockTalk |
News |
Chart |
Request a new note
C
A N
S L
I M
|
NEM
-
NYSE
Newmont Mining Corp
METALS and MINING - Gold
|
$58.17
|
-0.82
-1.39% |
$59.58
|
6,338,040
64.49% of 50 DAV
50 DAV is 9,827,900
|
$63.38
-8.22%
|
6/22/2010
|
$59.60
|
PP = $59.67
|
|
MB = $62.65
|
Most Recent Note - 7/20/2010 4:32:12 PM
G - Posted a small gain today with lighter volume, sputtering near its 50 DMA line and prior chart highs that define support to watch.
>>> The latest Featured Stock Update with an annotated graph appeared on 7/9/2010. Click here.
View all notes |
Alert me of new notes |
CANSLIM.net Company Profile |
SEC |
Zacks Reports |
StockTalk |
News |
Chart |
Request a new note
C
A N
S L
I M
|
ROVI
-
NASDAQ
Rovi Corp
COMPUTER SOFTWARE andamp; SERVICES - Security Software andamp; Services
|
$42.42
|
-0.07
-0.16% |
$42.98
|
830,841
58.43% of 50 DAV
50 DAV is 1,421,900
|
$43.67
-2.86%
|
6/3/2010
|
$38.70
|
PP = $40.16
|
|
MB = $42.17
|
Most Recent Note - 7/21/2010 5:03:58 PM
G - Earnings news is due 7/29/10 after the close. Volume totals have cooled while holding its ground stubbornly just -3% off its 52-week high. Slightly above its "max buy" level, its color code is changed to green while consolidating above support defined by prior resistance in the $40 area and its 50 DMA line.
>>> The latest Featured Stock Update with an annotated graph appeared on 7/21/2010. Click here.
View all notes |
Alert me of new notes |
CANSLIM.net Company Profile |
SEC |
Zacks Reports |
StockTalk |
News |
Chart |
Request a new note
C
A N
S L
I M
|
THOR
-
NASDAQ
Thoratec Corp
HEALTH SERVICES - Medical Instruments and Supplies
|
$41.16
|
-1.43
-3.36% |
$42.88
|
827,788
83.35% of 50 DAV
50 DAV is 993,200
|
$47.93
-14.12%
|
6/3/2010
|
$44.38
|
PP = $45.35
|
|
MB = $47.62
|
Most Recent Note - 7/21/2010 4:38:47 PM
G - Closed at the session low today and concerns have increased due to technical damage. A streak of 4 consecutive losses with below average volume included violations of its 50 DMA line and prior chart low. A prompt rebound above its short-term average would help its outlook, meanwhile the path of least resistance may lead this high-ranked Medical Products firm lower.
>>> The latest Featured Stock Update with an annotated graph appeared on 7/16/2010. Click here.
View all notes |
Alert me of new notes |
CANSLIM.net Company Profile |
SEC |
Zacks Reports |
StockTalk |
News |
Chart |
Request a new note
C
A N
S L
I M
|
ULTA
-
NASDAQ
Ulta Salon Cosm & Frag
SPECIALTY RETAIL - Specialty Retail, Other
|
$22.86
|
-0.29
-1.25% |
$23.31
|
321,639
45.81% of 50 DAV
50 DAV is 702,100
|
$26.75
-14.54%
|
5/28/2010
|
$25.58
|
PP = $25.86
|
|
MB = $27.15
|
Most Recent Note - 7/20/2010 4:52:32 PM
G - Holding its ground in a tight trading range with light volume. Its 50 DMA line has acted as resistance recently, meanwhile its May - June chart lows in the $21 area define the next support level just above its 200 DMA line.
>>> The latest Featured Stock Update with an annotated graph appeared on 7/19/2010. Click here.
View all notes |
Alert me of new notes |
CANSLIM.net Company Profile |
SEC |
Zacks Reports |
StockTalk |
News |
Chart |
Request a new note
C
A N
S L
I M
|
Symbol/Exchange
Company Name
Industry Group |
PRICE |
CHANGE
(%Change) |
Day High |
Volume
(% DAV)
(% 50 day avg vol) |
52 Wk Hi
% From Hi |
Featured
Date |
Price
Featured |
Pivot Featured |
|
Max Buy |
VIT
-
NYSE
Vanceinfo Tech Inc Ads
COMPUTER SOFTWARE and SERVICES - Business Software and Services
|
$25.51
|
+0.15
0.59% |
$26.24
|
339,336
52.97% of 50 DAV
50 DAV is 640,600
|
$26.90
-5.17%
|
7/8/2010
|
$25.20
|
PP = $26.58
|
|
MB = $27.91
|
Most Recent Note - 7/20/2010 4:58:34 PM
Y - Gapped down and then closed near the session high with a small gain on light volume, making a "positive reversal" today. It did not yet trigger a technical buy signal with respect to the pivot point cited after gapping up on 7/08/10, when it briefly matched its all-time high and appeared in the mid-day report (read here).
>>> The latest Featured Stock Update with an annotated graph appeared on 7/8/2010. Click here.
View all notes |
Alert me of new notes |
CANSLIM.net Company Profile |
SEC |
Zacks Reports |
StockTalk |
News |
Chart |
Request a new note
C
A N
S L
I M
|
|
|
|
THESE ARE NOT BUY RECOMMENDATIONS!
Comments contained in the body of this report are technical
opinions only. The material herein has been obtained
from sources believed to be reliable and accurate, however,
its accuracy and completeness cannot be guaranteed.
This site is not an investment advisor, hence it does
not endorse or recommend any securities or other investments.
Any recommendation contained in this report may not
be suitable for all investors and it is not to be deemed
an offer or solicitation on our part with respect to
the purchase or sale of any securities. All trademarks,
service marks and trade names appearing in this report
are the property of their respective owners, and are
likewise used for identification purposes only.
This report is a service available
only to active Paid Premium Members.
You may opt-out of receiving report notifications
at any time. Questions or comments may be submitted
by writing to Premium Membership Services 665 S.E. 10 Street, Suite 201 Deerfield Beach, FL 33441-5634 or by calling 1-800-965-8307
or 954-785-1121.
|
|
|


