You are not logged in.
This means you
CAN ONLY VIEW reports that were published prior to Monday, April 14, 2025.
You
MUST UPGRADE YOUR MEMBERSHIP if you want to see any current reports.
AFTER MARKET UPDATE - FRIDAY, JULY 18TH, 2014
Previous After Market Report Next After Market Report >>>
|
|
|
|
DOW |
+123.37 |
17,100.18 |
+0.73% |
|
Volume |
744,325,370 |
+8% |
|
Volume |
1,683,309,310 |
-13% |
|
NASDAQ |
+68.70 |
4,432.15 |
+1.57% |
|
Advancers |
2,514 |
80% |
|
Advancers |
2,284 |
78% |
|
S&P 500 |
+20.10 |
1,978.22 |
+1.03% |
|
Decliners |
542 |
17% |
|
Decliners |
571 |
19% |
|
Russell 2000 |
+18.01 |
1,151.61 |
+1.59% |
|
52 Wk Highs |
134 |
|
|
52 Wk Highs |
42 |
|
|
S&P 600 |
+9.35 |
664.04 |
+1.43% |
|
52 Wk Lows |
19 |
|
|
52 Wk Lows |
54 |
|
|
 |
Major Averages Rebounded Following Prior Losses
Kenneth J. Gruneisen - Passed the CAN SLIM® Master's Exam
The major averages rose on Friday's session while the volume totals were mixed, higher than the prior session volume total on the NYSE and lighter on the Nasdaq exchange. Breadth was positive as advancers led decliners by a 4-1 margin on the Nasdaq exchange and on the NYSE. There were 26 high-ranked companies from the CANSLIM.net Leaders List that made new 52-week highs and appeared on the CANSLIM.net BreakOuts Page, up from the prior session total of 20 stocks. New 52-week highs outnumbered new 52-week lows on the NYSE but new lows outnumbered new highs on the Nasdaq exchange. There were gains for all 13 of the high-ranked companies currently included on the Featured Stocks Page. The market (M criteria) uptrend has recently faced pressure and has been threatening to earn the label of being in a "correction" while leadership has become scarce. Disciplined investors limit losses and reduce market exposure during rough market periods by selling any stocks which fall more than -7% from their purchase price.
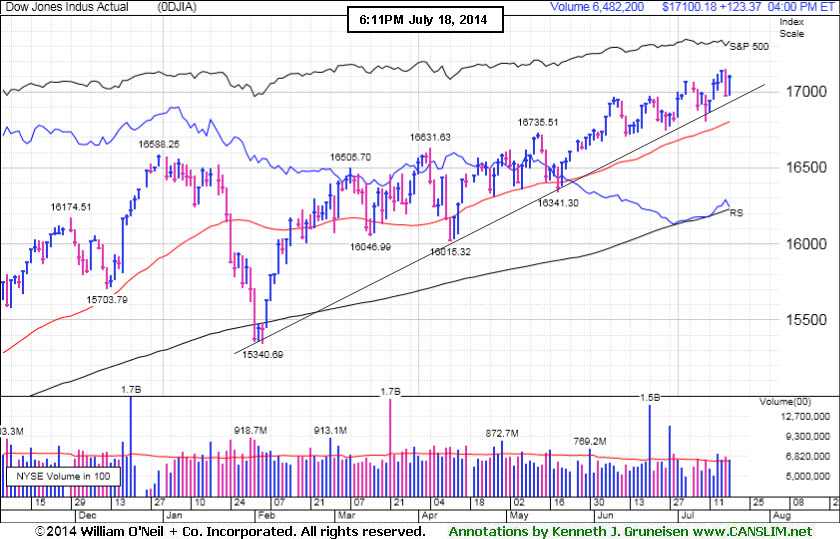
PICTURED: The Dow rose 123 points to 17,100.
The S&P 500 finished 20 points higher at 1,978. The NASDAQ advanced 69 points to 4,432. The major averages rebounded from Thursday’s pullback attributed to generally positive earnings releases and easing geopolitical concerns. Google (GOOGL +4.2%) rose after posting revenues ahead of consensus estimates. Honeywell (HON +1.7%) rose following its positive quarterly results and increased guidance. Schlumberger (SLB -2%) rose as it offered a more cautious outlook. Stocks had retreated after a Malaysian Airlines jet was shot down over Ukraine and Israel sent troops into Gaza.
On the economic front, the preliminary July confidence reading from the University of Michigan showed consumer sentiment unexpectedly fell. In a separate release, the index of leading economic indicators increased +0.3% in June.
All 10 sectors in the S&P 500 were up on the session. Health care was the best performing group. Johnson & Johnson (JNJ +1.4%) was up and AbbVie (ABBV +2.6%) rose after announcing it reached a deal to acquire Shire (SHPG +1.43%) for $54.8 billion.
Treasuries declined with benchmark 10-year note losing 10/32 to yield 2.48%.
The CANSLIM.net Featured Stocks Page shows the most action-worthy candidates and their latest notes and a Headline Link directs members to the latest detailed analysis with data-packed graphs annotated by a Certified expert along with links to additional resources. The Premium Member Homepage includes "dynamic archives" to all prior pay reports published. Watch for an announcement via email concerning the next WEBCAST.
|
 Kenneth J. Gruneisen started out as a licensed stockbroker in August 1987, a couple of months prior to the historic stock market crash that took the Dow Jones Industrial Average down -22.6% in a single day. He has published daily fact-based fundamental and technical analysis on high-ranked stocks online for two decades. Through FACTBASEDINVESTING.COM, Kenneth provides educational articles, news, market commentary, and other information regarding proven investment systems that work in good times and bad.
Comments contained in the body of this report are technical opinions only and are not necessarily those of Gruneisen Growth Corp. The material herein has been obtained from sources believed to be reliable and accurate, however, its accuracy and completeness cannot be guaranteed. Our firm, employees, and customers may effect transactions, including transactions contrary to any recommendation herein, or have positions in the securities mentioned herein or options with respect thereto. Any recommendation contained in this report may not be suitable for all investors and it is not to be deemed an offer or solicitation on our part with respect to the purchase or sale of any securities. |
|
 |
Tech Indices, Financial, Retail Indices Rose
Kenneth J. Gruneisen - Passed the CAN SLIM® Master's Exam
Financial shares were a positive influence on the major averages as the Broker/Dealer Index ($XBD +1.91%) and the Bank Index ($BKX +1.09%) rose. The Retail Index ($RLX +1.20%) tallied a solid gain and the tech sector saw unanimous gains from the Semiconductor Index ($SOX +1.28%), Networking Index ($NWX +1.60%), and the Biotechnology Index ($BTK +2.64%). The Gold & Silver Index ($XAU -0.46%) edged lower and the Integrated Oil Index ($XOI +0.58%) posted a modest gain while the Oil Services Index ($OSX +0.07%) finished flat.
Charts courtesy www.stockcharts.com
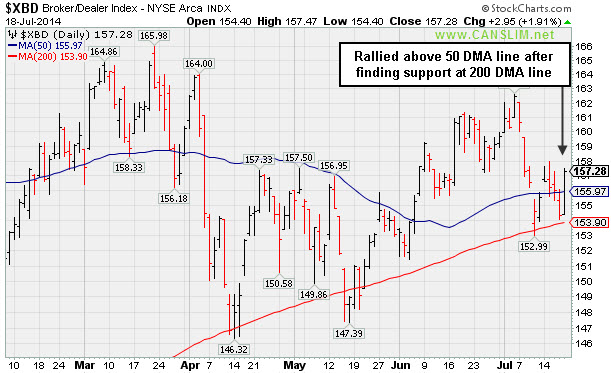
PICTURED: The Broker/Dealer Index ($XBD +1.91%) found support at its 200-day moving average (DMA) and rallied above its 50 DMA line.
| Oil Services |
$OSX |
304.06 |
+0.21 |
+0.07% |
+8.19% |
| Integrated Oil |
$XOI |
1,670.52 |
+9.69 |
+0.58% |
+11.14% |
| Semiconductor |
$SOX |
643.44 |
+8.12 |
+1.28% |
+20.26% |
| Networking |
$NWX |
332.88 |
+5.24 |
+1.60% |
+2.76% |
| Broker/Dealer |
$XBD |
157.28 |
+2.95 |
+1.91% |
-2.04% |
| Retail |
$RLX |
903.57 |
+10.69 |
+1.20% |
-3.86% |
| Gold & Silver |
$XAU |
101.98 |
-0.47 |
-0.46% |
+21.19% |
| Bank |
$BKX |
70.76 |
+0.76 |
+1.09% |
+2.17% |
| Biotech |
$BTK |
2,724.32 |
+70.17 |
+2.64% |
+16.90% |
|
|
|
 |
Big Gains in First 2-3 Weeks After Breakout an Encouraging Sign
Kenneth J. Gruneisen - Passed the CAN SLIM® Master's Exam
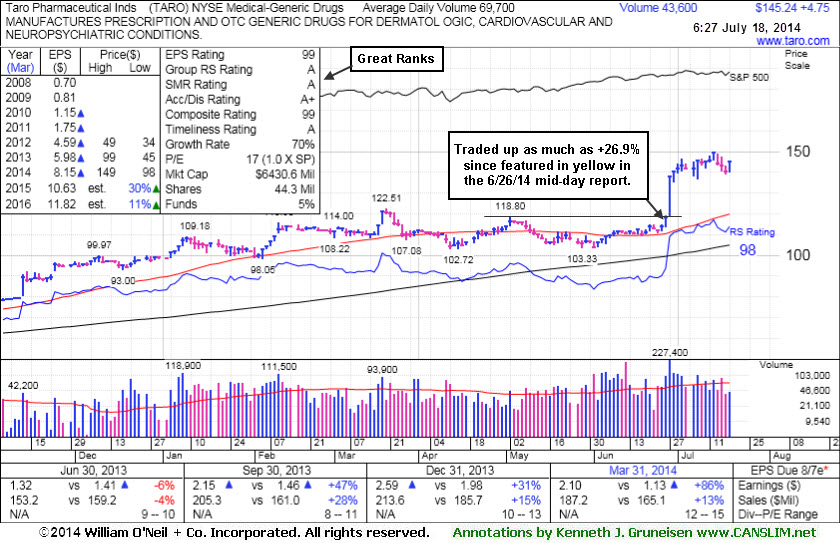
Taro Pharmaceutical Inds (TARO $4.75 or +3.38% to $145.24) posted a gain on Friday after 3 consecutive losses. It is extended from its prior base and traded up as much as +26.9% since first featured in yellow in the 6/26/14 mid-day report at $117.31. The investment system rules say a stock should be held a minimum of 8 weeks after rising more than +20% in the first 2-3 weeks from being bought. Disciplined investors avoid chasing stocks more than +5% above prior highs. It was last shown in this FSU section on 6/26/14 with annotated graphs under the headline,"Fundamentally Strong Stock Challenging Prior Resistance Level", as it traded twice its average volume behind a considerable gain.
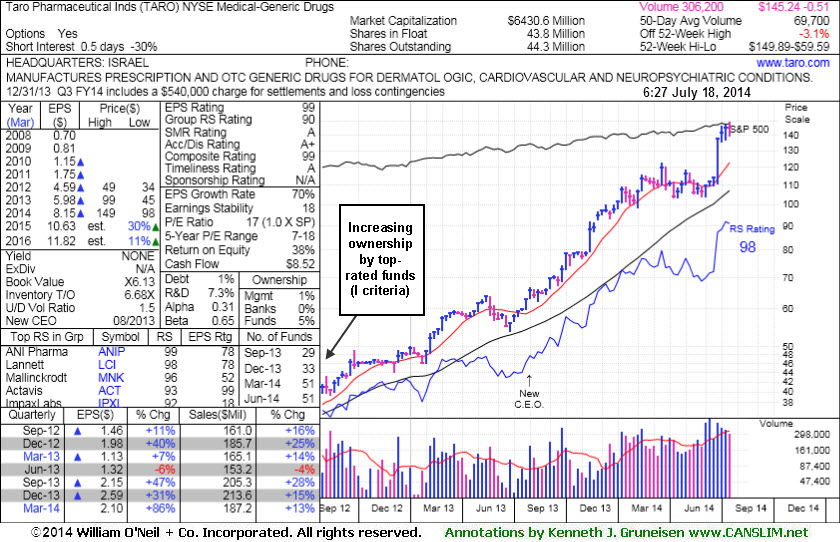
This high-ranked Medical - Generic Drug firm was highlighted in yellow in the 6/26/14 mid-day report (read here) while approaching a pivot point cited based upon its 5/02/14 high plus 10 cents. Patient and disciplined investors may watch for a proper base or secondary buy point to possibly develop and be noted in the weeks ahead. It reported earnings +86% on +13% sales revenues for the Mar '14 quarter, a 3rd consecutive quarterly comparison above the +25% minimum guideline (C criteria). The Israel-based Medical - Generic Drugs firm has seen the number of top-rated funds owning its shares rise from 2 in Mar '12 to 51 as of Jun '14, a reassuring sign concerning the I criteria.
TARO has a small supply (S criteria) of only 44.3 million shares outstanding, which is favorable, and any institutional buying or selling could lead to great price volatility. Disciplined investors always limit losses by selling any properly bought stock if it falls more than -7% from their purchase price.
|
|
|
Color Codes Explained :
Y - Better candidates highlighted by our
staff of experts.
G - Previously featured
in past reports as yellow but may no longer be buyable under the
guidelines.
***Last / Change / Volume data in this table is the closing quote data***
Symbol/Exchange
Company Name
Industry Group |
PRICE |
CHANGE
(%Change) |
Day High |
Volume
(% DAV)
(% 50 day avg vol) |
52 Wk Hi
% From Hi |
Featured
Date |
Price
Featured |
Pivot Featured |
|
Max Buy |
ACT
-
NYSE
Actavis plc
Medical-Generic Drugs
|
$218.18
|
+4.52
2.12% |
$218.61
|
1,374,919
62.72% of 50 DAV
50 DAV is 2,192,000
|
$230.77
-5.46%
|
6/20/2014
|
$216.53
|
PP = $230.87
|
|
MB = $242.41
|
Most Recent Note - 7/16/2014 7:53:41 PM
Y - Consolidating above its 50 DMA line, still hovering within close striking distance of its 52-week high. Subsequent volume-driven gains to new highs may trigger a technical buy signal. See the latest FSU analysis for more details and new annotated graphs.
>>> FEATURED STOCK ARTICLE : Disciplined Investors Still Awaiting Technical Breakout - 7/16/2014
View all notes |
Set NEW NOTE alert |
CANSLIM.net Company Profile |
SEC
News |
Chart |
Request a new note
C
A N
S L
I M


|
AFSI
-
NASDAQ
Amtrust Financial Svcs
INSURANCE - Property and; Casualty Insurance
|
$42.36
|
+0.99
2.39% |
$42.60
|
396,034
62.66% of 50 DAV
50 DAV is 632,000
|
$47.10
-10.06%
|
5/21/2014
|
$44.85
|
PP = $44.85
|
|
MB = $47.09
|
Most Recent Note - 7/14/2014 6:22:40 PM
G - Gains have come on light volume after recent slump below 50 DMA line raised concerns. Faces resistance due to overhead supply up through the $47 level.
>>> FEATURED STOCK ARTICLE : Found Support Near 50-Day Average and Relative Strength Slightly Improved - 7/1/2014
View all notes |
Set NEW NOTE alert |
CANSLIM.net Company Profile |
SEC
News |
Chart |
Request a new note
C
A N
S L
I M
|
BITA
-
NYSE
Bitauto Hldgs Ltd Ads
Internet-Content
|
$52.92
|
+2.09
4.11% |
$53.37
|
615,701
63.54% of 50 DAV
50 DAV is 969,000
|
$54.31
-2.56%
|
6/26/2014
|
$46.20
|
PP = $47.03
|
|
MB = $49.38
|
Most Recent Note - 7/17/2014 4:35:10 PM
G - Pulled back today with lighter volume. Consolidating above its "max buy" level, extended from its prior base.
>>> FEATURED STOCK ARTICLE : Perched At High With No Resistance Remaining Due to Overhead Supply - 6/27/2014
View all notes |
Set NEW NOTE alert |
CANSLIM.net Company Profile |
SEC
News |
Chart |
Request a new note
C
A N
S L
I M
|
BWLD
-
NASDAQ
Buffalo Wild Wings Inc
LEISURE - Restaurants
|
$153.55
|
+2.92
1.94% |
$154.49
|
243,752
64.15% of 50 DAV
50 DAV is 380,000
|
$167.36
-8.25%
|
6/19/2014
|
$158.52
|
PP = $159.91
|
|
MB = $167.91
|
Most Recent Note - 7/14/2014 6:20:36 PM
Y - Gain today came on lighter volume. Friday's close below the prior high close ($156.35 on 3/21/14) raised greater concerns and completely negated the recent technical breakout. See latest FSU analysis for more details and new annotated graphs.
>>> FEATURED STOCK ARTICLE : Slump Into Prior Base Negated Recent Breakout - 7/14/2014
View all notes |
Set NEW NOTE alert |
CANSLIM.net Company Profile |
SEC
News |
Chart |
Request a new note
C
A N
S L
I M
|
EQM
-
NYSE
E Q T Midstream Partners
ENERGY - Oil and Gas Pipelines
|
$95.08
|
+0.61
0.65% |
$95.63
|
79,443
24.67% of 50 DAV
50 DAV is 322,000
|
$102.51
-7.25%
|
12/12/2013
|
$53.17
|
PP = $56.51
|
|
MB = $59.34
|
Most Recent Note - 7/17/2014 9:38:36 PM
G - Volume totals have been cooling in recent weeks while consolidating well above its 50 DMA line. Strength has continued despite fundamental flaws repeatedly noted. See the latest FSU analysis for more details and new annotated graphs.
>>> FEATURED STOCK ARTICLE : Volume Totals Cooling While Consolidating Near Highs - 7/17/2014
View all notes |
Set NEW NOTE alert |
CANSLIM.net Company Profile |
SEC
News |
Chart |
Request a new note
C
A N
S L
I M
|
Symbol/Exchange
Company Name
Industry Group |
PRICE |
CHANGE
(%Change) |
Day High |
Volume
(% DAV)
(% 50 day avg vol) |
52 Wk Hi
% From Hi |
Featured
Date |
Price
Featured |
Pivot Featured |
|
Max Buy |
GRFS
-
NASDAQ
Grifols Sa Cl B Ads
Medical-Ethical Drugs
|
$41.02
|
+0.05
0.12% |
$41.19
|
419,544
60.80% of 50 DAV
50 DAV is 690,000
|
$46.66
-12.09%
|
5/15/2014
|
$41.14
|
PP = $43.55
|
|
MB = $45.73
|
Most Recent Note - 7/16/2014 7:55:00 PM
G - Encountered resistance at its 50 DMA line and slumped for another loss today with lighter volume. Faces resistance due to overhead supply up through the $46 area.
>>> FEATURED STOCK ARTICLE : Violation of 50-Day Moving Average Triggered Technical Sell Signal - 7/9/2014
View all notes |
Set NEW NOTE alert |
CANSLIM.net Company Profile |
SEC
News |
Chart |
Request a new note
C
A N
S L
I M
|
HF
-
NYSE
H F F Inc Cl A
REAL ESTATE - Property Management/Developmen
|
$34.83
|
+0.71
2.08% |
$34.86
|
329,793
170.00% of 50 DAV
50 DAV is 194,000
|
$38.23
-8.89%
|
6/20/2014
|
$34.60
|
PP = $36.16
|
|
MB = $37.97
|
Most Recent Note - 7/17/2014 3:44:25 PM
Y - Undercutting prior highs in the $35 area and negating its recent breakout with today's 4th consecutive loss on ever-increasing volume. Testing its 50 DMA line ($34.05) where further deterioration would raise greater concerns.
>>> FEATURED STOCK ARTICLE : Slump Into Prior Base Negated Recent Breakout - 7/15/2014
View all notes |
Set NEW NOTE alert |
CANSLIM.net Company Profile |
SEC
News |
Chart |
Request a new note
C
A N
S L
I M
|
ICON
-
NASDAQ
Iconix Brand Group Inc
CONSUMER NON-DURABLES - Textile - Apparel Footwear
|
$42.36
|
+0.34
0.81% |
$42.65
|
399,941
83.32% of 50 DAV
50 DAV is 480,000
|
$44.81
-5.47%
|
6/5/2014
|
$43.54
|
PP = $43.44
|
|
MB = $45.61
|
Most Recent Note - 7/17/2014 3:45:36 PM
G - Still sputtering below its 50 DMA line, and a rebound above that important short-term average is needed to help its outlook improve.
>>> FEATURED STOCK ARTICLE : Slump Below 50-Day Moving Average Line Hurt Outlook - 7/11/2014
View all notes |
Set NEW NOTE alert |
CANSLIM.net Company Profile |
SEC
News |
Chart |
Request a new note
C
A N
S L
I M
|
PANW
-
NYSE
Palo Alto Networks
Computer Sftwr-Security
|
$79.21
|
+1.95
2.52% |
$79.63
|
1,351,335
72.19% of 50 DAV
50 DAV is 1,872,000
|
$85.78
-7.66%
|
5/29/2014
|
$75.95
|
PP = $72.50
|
|
MB = $76.13
|
Most Recent Note - 7/16/2014 7:56:50 PM
G - Small gap up gain today on higher but still below average volume. Its 50 DMA line defines important support and a violation would raise serious concerns and trigger a technical sell signal.
>>> FEATURED STOCK ARTICLE : Gap Up Gain on Above Average Volume for New Highs - 6/30/2014
View all notes |
Set NEW NOTE alert |
CANSLIM.net Company Profile |
SEC
News |
Chart |
Request a new note
C
A N
S L
I M
|
TARO
-
NYSE
Taro Pharmaceutical Inds
DRUGS - Drug Manufacturers - Other
|
$145.24
|
+4.75
3.38% |
$145.62
|
43,646
63.26% of 50 DAV
50 DAV is 69,000
|
$149.89
-3.10%
|
6/26/2014
|
$117.31
|
PP = $118.90
|
|
MB = $124.85
|
 Most Recent Note - 7/18/2014 6:45:47 PM
G - Tallied big gains after recent breakout, an encouraging sign. Disciplined investors avoid chasing stocks more than +5% above prior highs. See latest FSU analysis for more details and annotated graphs.
>>> FEATURED STOCK ARTICLE : Big Gains in First 2-3 Weeks After Breakout an Encouraging Sign - 7/18/2014
View all notes |
Set NEW NOTE alert |
CANSLIM.net Company Profile |
SEC
News |
Chart |
Request a new note
C
A N
S L
I M
|
Symbol/Exchange
Company Name
Industry Group |
PRICE |
CHANGE
(%Change) |
Day High |
Volume
(% DAV)
(% 50 day avg vol) |
52 Wk Hi
% From Hi |
Featured
Date |
Price
Featured |
Pivot Featured |
|
Max Buy |
TRN
-
NYSE
Trinity Industries Inc
TRANSPORTATION - Railroads
|
$44.98
|
+1.52
3.50% |
$45.23
|
2,313,626
76.03% of 50 DAV
50 DAV is 3,043,000
|
$46.00
-2.22%
|
4/30/2014
|
$37.79
|
PP = $38.03
|
|
MB = $39.93
|
Most Recent Note - 7/15/2014 4:21:17 PM
G - Volume totals have been cooling while holding its ground stubbornly and consolidating near its 52-week high, extended from its prior base. Its 50 DMA line defines important near-term support to watch.
>>> FEATURED STOCK ARTICLE : Bullish Up/Down Volume and Increasing Institutional Ownership - 7/8/2014
View all notes |
Set NEW NOTE alert |
CANSLIM.net Company Profile |
SEC
News |
Chart |
Request a new note
C
A N
S L
I M
|
UA
-
NYSE
Under Armour Inc Cl A
CONSUMER NON-DURABLES - Textile - Apparel Clothing
|
$58.61
|
+1.61
2.82% |
$58.77
|
2,005,314
77.85% of 50 DAV
50 DAV is 2,576,000
|
$62.40
-6.07%
|
7/10/2014
|
$58.50
|
PP = $60.79
|
|
MB = $63.83
|
Most Recent Note - 7/15/2014 4:29:40 PM
Y - Holding its ground since highlighted in yellow in the 7/10/14 mid-day report (read here) forming cup-with-handle base. Volume-driven gains above the pivot point are still needed to trigger a proper technical buy signal.
>>> FEATURED STOCK ARTICLE : Forming Handle on Cup-With-Handle Base Pattern - 7/10/2014
View all notes |
Set NEW NOTE alert |
CANSLIM.net Company Profile |
SEC
News |
Chart |
Request a new note
C
A N
S L
I M
|
WLK
-
NYSE
Westlake Chemical Corp
CHEMICALS - Specialty Chemicals
|
$86.38
|
+1.63
1.92% |
$86.75
|
505,763
88.42% of 50 DAV
50 DAV is 572,000
|
$86.13
0.29%
|
4/29/2014
|
$72.79
|
PP = $69.31
|
|
MB = $72.78
|
Most Recent Note - 7/14/2014 6:23:40 PM
G - Hovering near its 52-week high, extended from any sound base pattern. Its 50 DMA line ($80.57) defines important near-term support to watch on pullbacks.
>>> FEATURED STOCK ARTICLE : Great Ranks and Reassuring Leadership in Chemical Group - 7/7/2014
View all notes |
Set NEW NOTE alert |
CANSLIM.net Company Profile |
SEC
News |
Chart |
Request a new note
C
A N
S L
I M
|
|
|
|
THESE ARE NOT BUY RECOMMENDATIONS!
Comments contained in the body of this report are technical
opinions only. The material herein has been obtained
from sources believed to be reliable and accurate, however,
its accuracy and completeness cannot be guaranteed.
This site is not an investment advisor, hence it does
not endorse or recommend any securities or other investments.
Any recommendation contained in this report may not
be suitable for all investors and it is not to be deemed
an offer or solicitation on our part with respect to
the purchase or sale of any securities. All trademarks,
service marks and trade names appearing in this report
are the property of their respective owners, and are
likewise used for identification purposes only.
This report is a service available
only to active Paid Premium Members.
You may opt-out of receiving report notifications
at any time. Questions or comments may be submitted
by writing to Premium Membership Services 665 S.E. 10 Street, Suite 201 Deerfield Beach, FL 33441-5634 or by calling 1-800-965-8307
or 954-785-1121.
|
|
|

