You are not logged in.
This means you
CAN ONLY VIEW reports that were published prior to Tuesday, April 15, 2025.
You
MUST UPGRADE YOUR MEMBERSHIP if you want to see any current reports.
AFTER MARKET UPDATE - THURSDAY, JULY 17TH, 2014
Previous After Market Report Next After Market Report >>>
|
|
|
|
DOW |
-161.39 |
16,976.81 |
-0.94% |
|
Volume |
689,942,830 |
+5% |
|
Volume |
1,927,173,520 |
+1% |
|
NASDAQ |
-62.52 |
4,363.45 |
-1.41% |
|
Advancers |
568 |
18% |
|
Advancers |
534 |
17% |
|
S&P 500 |
-23.45 |
1,958.12 |
-1.18% |
|
Decliners |
2,495 |
79% |
|
Decliners |
2,430 |
80% |
|
Russell 2000 |
-17.95 |
1,133.60 |
-1.56% |
|
52 Wk Highs |
123 |
|
|
52 Wk Highs |
32 |
|
|
S&P 600 |
-8.67 |
654.69 |
-1.31% |
|
52 Wk Lows |
21 |
|
|
52 Wk Lows |
74 |
|
|
 |
Major Averages Faced More Damaging Distributional Pressure
Kenneth J. Gruneisen - Passed the CAN SLIM® Master's Exam
The major averages tumbled on Thursday while the volume totals were higher than the prior session volume totals on the NYSE and on the Nasdaq exchange, a sign of distributional pressure or selling from large institutional investors. Decliners led advancers by more than a 4-1 margin on the Nasdaq exchange and on the NYSE. There were 20 high-ranked companies from the CANSLIM.net Leaders List that made new 52-week highs and appeared on the CANSLIM.net BreakOuts Page, down from the prior session total of 29 stocks. New 52-week highs outnumbered new 52-week lows on the NYSE but new lows outnumbered new highs on the Nasdaq exchange. There were gains for only 2 of the 14 high-ranked companies currently included on the Featured Stocks Page. The market (M criteria) uptrend has recently faced pressure and it is now threatening to earn the label of being in a "correction" while leadership has become scarce. Disciplined investors limit losses and reduce market exposure during rough market periods by selling any stocks which fall more than -7% from their purchase price.
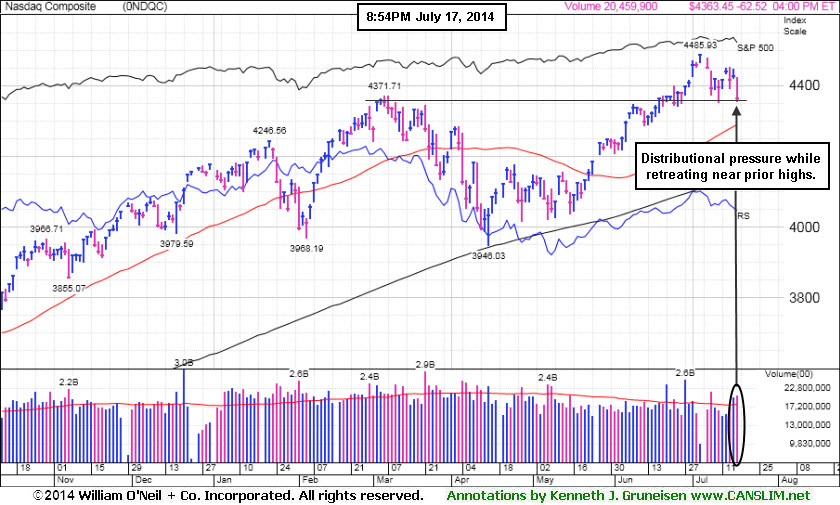
PICTURED: The Nasdaq Composite Index contracted 63 points to close at 4,363, slumping near prior highs.
Stocks finished firmly in negative territory on Thursday's session. The Dow fell 161 points from its all-time high to 16,976. The S&P 500 Index declined 23 points to 1,958. The major averages retreated amid renewed geopolitical concerns. The market opened lower after the U.S. and the European Union enacted additional sanctions against Russia. The market extended its pullback following news Israel began a ground invasion of Gaza.
The latest economic data was mixed. Weekly jobless claims declined 3,000 to 302,000 versus projections to climb to 310,000. Manufacturing activity in the Fed's Philadelphia region expanded at a faster pace this month. Housing starts and building permits unexpectedly fell in June.
On the earnings front, United Health (UNH +1.61%) after posting quarterly results ahead of consensus estimates. Yum Brands (YUM -6.89%) fell as the owner of Taco Bell and Pizza Hut reported lower-than-expected profits. Shares of Google (GOOGL -1.66%) edged lower ahead of its scheduled earnings release after the close.
All 10 sectors in the S&P 500 were down with energy and industrials the worst performing groups while Exxon (XOM -1.41%) and General Electric (GE -1.52%) edged lower.
Treasuries advanced amid the geopolitical concerns. Benchmark 10-year notes gained 19/32 to yield 2.45%.
The CANSLIM.net Featured Stocks Page shows the most action-worthy candidates and their latest notes and a Headline Link directs members to the latest detailed analysis with data-packed graphs annotated by a Certified expert along with links to additional resources. The Premium Member Homepage includes "dynamic archives" to all prior pay reports published. Watch for an announcement via email concerning the next WEBCAST.
|
 Kenneth J. Gruneisen started out as a licensed stockbroker in August 1987, a couple of months prior to the historic stock market crash that took the Dow Jones Industrial Average down -22.6% in a single day. He has published daily fact-based fundamental and technical analysis on high-ranked stocks online for two decades. Through FACTBASEDINVESTING.COM, Kenneth provides educational articles, news, market commentary, and other information regarding proven investment systems that work in good times and bad.
Comments contained in the body of this report are technical opinions only and are not necessarily those of Gruneisen Growth Corp. The material herein has been obtained from sources believed to be reliable and accurate, however, its accuracy and completeness cannot be guaranteed. Our firm, employees, and customers may effect transactions, including transactions contrary to any recommendation herein, or have positions in the securities mentioned herein or options with respect thereto. Any recommendation contained in this report may not be suitable for all investors and it is not to be deemed an offer or solicitation on our part with respect to the purchase or sale of any securities. |
|
 |
Financial, Tech, Retail, and Energy-Linked Groups Fell
Kenneth J. Gruneisen - Passed the CAN SLIM® Master's Exam
The Biotechnology Index ($BTK -2.53%) and the Semiconductor Index ($SOX -2.52%) outpaced the Networking Index ($NWX -0.59%) to the downside. Financial shares created a drag as the Bank Index ($BKX -2.14%) and the Broker/Dealer Index ($XBD -1.07%) slumped, and the Retail Index ($RLX -0.97%) also fell. Energy-related shares retreated as the Integrated Oil Index ($XOI -1.79%) and the Oil Services Index ($OSX -1.36%) lost ground. Meanwhile, the Gold & Silver Index ($XAU +2.55%) was a standout decliner.
Charts courtesy www.stockcharts.com
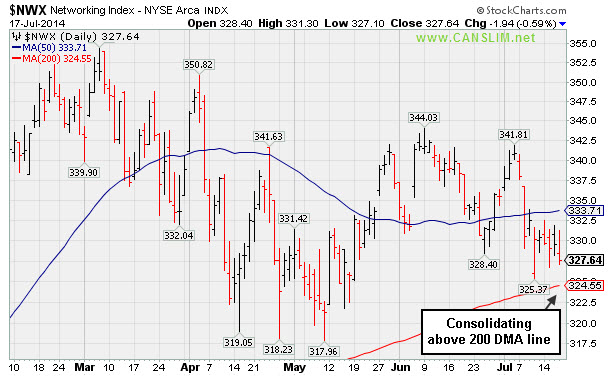
PICTURED: The Networking Index ($NWX -0.59%) is consolidating above its 50-day moving average (DMA) line.
| Oil Services |
$OSX |
303.85 |
-4.19 |
-1.36% |
+8.12% |
| Integrated Oil |
$XOI |
1,660.83 |
-30.23 |
-1.79% |
+10.49% |
| Semiconductor |
$SOX |
635.32 |
-16.44 |
-2.52% |
+18.74% |
| Networking |
$NWX |
327.64 |
-1.94 |
-0.59% |
+1.14% |
| Broker/Dealer |
$XBD |
154.33 |
-1.66 |
-1.07% |
-3.88% |
| Retail |
$RLX |
892.88 |
-8.73 |
-0.97% |
-4.99% |
| Gold & Silver |
$XAU |
102.45 |
+2.55 |
+2.55% |
+21.75% |
| Bank |
$BKX |
70.00 |
-1.53 |
-2.14% |
+1.07% |
| Biotech |
$BTK |
2,654.15 |
-68.96 |
-2.53% |
+13.89% |
|
|
|
 |
Volume Totals Cooling While Consolidating Near Highs
Kenneth J. Gruneisen - Passed the CAN SLIM® Master's Exam
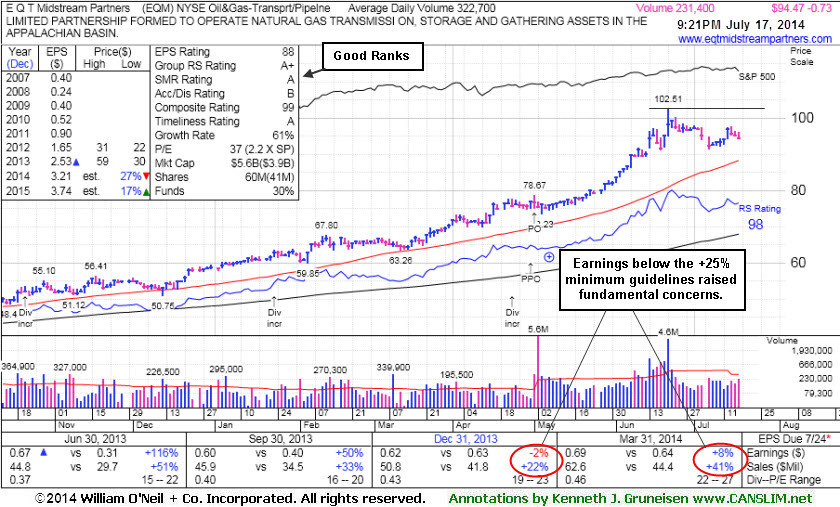
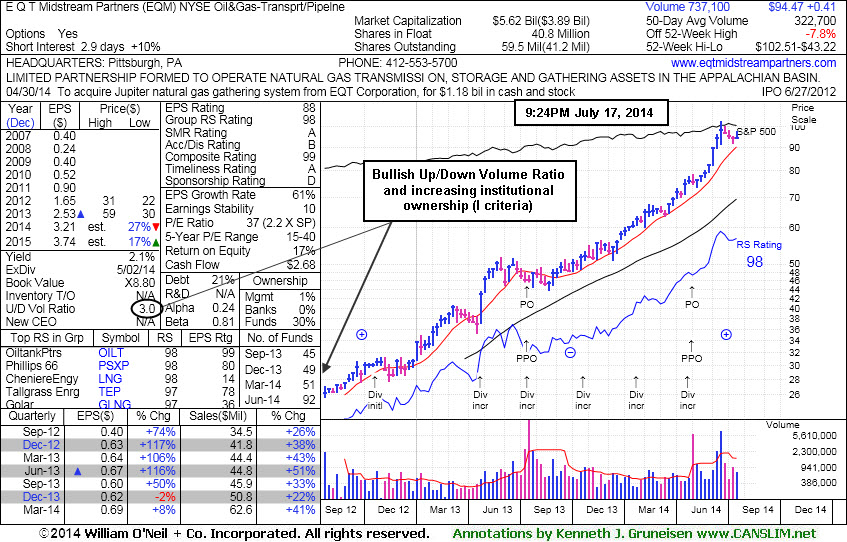
E Q T Midstream Partners' (EQM -$0.71 or -0.75% to $94.49) volume totals have been cooling in recent weeks while consolidating well above its 50-day moving average (DMA) line. Strength has continued despite fundamental flaws repeatedly noted. Its last appearance in this FSU section was on 6/25/14 under the headline, "Strength Continued Despite Fundamental Flaws". It is p -7.8% off its 52-week high following today's loss with lighter than average volume.
It completed a new Public Offering of 10.75 Million common units on 5/01/14. It traded up as much as +92.8% since first highlighted in yellow in the 12/12/13 mid-day report (read here) with pivot point based on its 11/18/13 high plus 10 cents. The fact-based system suggests watching for technical sell signals rather than selling purely on fundmentals, yet is wise to sometimes lock in gains at the +20% level. For those watching it and still giving it the benefit of the doubt, it is well above its 50-day moving average (DMA) line ($88.25) where a violation may trigger a technical sell signal.
It completed a new Public Offering on 7/16/13, then made gradual progress afterward. This MLP in the Natural Gas business has seen the number of top-rated funds owning its shares rise from 20 in Jun '12 to 92 in Jun '14, a reassuring sign concerning the I criteria. Its Up/Down Volume Ratio of 3.0 is an unbiased indication its shares have been under accumulation over the past 50 days.
|
|
|
Color Codes Explained :
Y - Better candidates highlighted by our
staff of experts.
G - Previously featured
in past reports as yellow but may no longer be buyable under the
guidelines.
***Last / Change / Volume data in this table is the closing quote data***
Symbol/Exchange
Company Name
Industry Group |
PRICE |
CHANGE
(%Change) |
Day High |
Volume
(% DAV)
(% 50 day avg vol) |
52 Wk Hi
% From Hi |
Featured
Date |
Price
Featured |
Pivot Featured |
|
Max Buy |
ACT
-
NYSE
Actavis plc
Medical-Generic Drugs
|
$213.66
|
-4.27
-1.96% |
$217.99
|
1,838,672
84.27% of 50 DAV
50 DAV is 2,182,000
|
$230.77
-7.41%
|
6/20/2014
|
$216.53
|
PP = $230.87
|
|
MB = $242.41
|
Most Recent Note - 7/16/2014 7:53:41 PM
Y - Consolidating above its 50 DMA line, still hovering within close striking distance of its 52-week high. Subsequent volume-driven gains to new highs may trigger a technical buy signal. See the latest FSU analysis for more details and new annotated graphs.
>>> FEATURED STOCK ARTICLE : Disciplined Investors Still Awaiting Technical Breakout - 7/16/2014
View all notes |
Set NEW NOTE alert |
CANSLIM.net Company Profile |
SEC
News |
Chart |
Request a new note
C
A N
S L
I M


|
AFSI
-
NASDAQ
Amtrust Financial Svcs
INSURANCE - Property and; Casualty Insurance
|
$41.37
|
-0.06
-0.14% |
$42.18
|
431,598
68.08% of 50 DAV
50 DAV is 634,000
|
$47.10
-12.17%
|
5/21/2014
|
$44.85
|
PP = $44.85
|
|
MB = $47.09
|
Most Recent Note - 7/14/2014 6:22:40 PM
G - Gains have come on light volume after recent slump below 50 DMA line raised concerns. Faces resistance due to overhead supply up through the $47 level.
>>> FEATURED STOCK ARTICLE : Found Support Near 50-Day Average and Relative Strength Slightly Improved - 7/1/2014
View all notes |
Set NEW NOTE alert |
CANSLIM.net Company Profile |
SEC
News |
Chart |
Request a new note
C
A N
S L
I M
|
BITA
-
NYSE
Bitauto Hldgs Ltd Ads
Internet-Content
|
$50.83
|
-1.32
-2.53% |
$52.42
|
683,327
70.52% of 50 DAV
50 DAV is 969,000
|
$54.31
-6.41%
|
6/26/2014
|
$46.20
|
PP = $47.03
|
|
MB = $49.38
|
 Most Recent Note - 7/17/2014 4:35:10 PM
G - Pulled back today with lighter volume. Consolidating above its "max buy" level, extended from its prior base.
>>> FEATURED STOCK ARTICLE : Perched At High With No Resistance Remaining Due to Overhead Supply - 6/27/2014
View all notes |
Set NEW NOTE alert |
CANSLIM.net Company Profile |
SEC
News |
Chart |
Request a new note
C
A N
S L
I M
|
BWLD
-
NASDAQ
Buffalo Wild Wings Inc
LEISURE - Restaurants
|
$150.63
|
-2.72
-1.77% |
$154.25
|
339,730
88.93% of 50 DAV
50 DAV is 382,000
|
$167.36
-10.00%
|
6/19/2014
|
$158.52
|
PP = $159.91
|
|
MB = $167.91
|
Most Recent Note - 7/14/2014 6:20:36 PM
Y - Gain today came on lighter volume. Friday's close below the prior high close ($156.35 on 3/21/14) raised greater concerns and completely negated the recent technical breakout. See latest FSU analysis for more details and new annotated graphs.
>>> FEATURED STOCK ARTICLE : Slump Into Prior Base Negated Recent Breakout - 7/14/2014
View all notes |
Set NEW NOTE alert |
CANSLIM.net Company Profile |
SEC
News |
Chart |
Request a new note
C
A N
S L
I M
|
EQM
-
NYSE
E Q T Midstream Partners
ENERGY - Oil and Gas Pipelines
|
$94.47
|
-0.73
-0.77% |
$96.10
|
231,431
71.87% of 50 DAV
50 DAV is 322,000
|
$102.51
-7.84%
|
12/12/2013
|
$53.17
|
PP = $56.51
|
|
MB = $59.34
|
Most Recent Note - 7/17/2014 9:38:36 PM
G - Volume totals have been cooling in recent weeks while consolidating well above its 50 DMA line. Strength has continued despite fundamental flaws repeatedly noted. See the latest FSU analysis for more details and new annotated graphs.
>>> FEATURED STOCK ARTICLE : Volume Totals Cooling While Consolidating Near Highs - 7/17/2014
View all notes |
Set NEW NOTE alert |
CANSLIM.net Company Profile |
SEC
News |
Chart |
Request a new note
C
A N
S L
I M
|
Symbol/Exchange
Company Name
Industry Group |
PRICE |
CHANGE
(%Change) |
Day High |
Volume
(% DAV)
(% 50 day avg vol) |
52 Wk Hi
% From Hi |
Featured
Date |
Price
Featured |
Pivot Featured |
|
Max Buy |
GRFS
-
NASDAQ
Grifols Sa Cl B Ads
Medical-Ethical Drugs
|
$40.97
|
-0.20
-0.49% |
$41.92
|
514,612
74.15% of 50 DAV
50 DAV is 694,000
|
$46.66
-12.19%
|
5/15/2014
|
$41.14
|
PP = $43.55
|
|
MB = $45.73
|
Most Recent Note - 7/16/2014 7:55:00 PM
G - Encountered resistance at its 50 DMA line and slumped for another loss today with lighter volume. Faces resistance due to overhead supply up through the $46 area.
>>> FEATURED STOCK ARTICLE : Violation of 50-Day Moving Average Triggered Technical Sell Signal - 7/9/2014
View all notes |
Set NEW NOTE alert |
CANSLIM.net Company Profile |
SEC
News |
Chart |
Request a new note
C
A N
S L
I M
|
HF
-
NYSE
H F F Inc Cl A
REAL ESTATE - Property Management/Developmen
|
$34.12
|
-1.14
-3.23% |
$35.23
|
273,672
142.54% of 50 DAV
50 DAV is 192,000
|
$38.23
-10.75%
|
6/20/2014
|
$34.60
|
PP = $36.16
|
|
MB = $37.97
|
Most Recent Note - 7/17/2014 3:44:25 PM
Y - Undercutting prior highs in the $35 area and negating its recent breakout with today's 4th consecutive loss on ever-increasing volume. Testing its 50 DMA line ($34.05) where further deterioration would raise greater concerns.
>>> FEATURED STOCK ARTICLE : Slump Into Prior Base Negated Recent Breakout - 7/15/2014
View all notes |
Set NEW NOTE alert |
CANSLIM.net Company Profile |
SEC
News |
Chart |
Request a new note
C
A N
S L
I M
|
ICON
-
NASDAQ
Iconix Brand Group Inc
CONSUMER NON-DURABLES - Textile - Apparel Footwear
|
$42.02
|
+0.16
0.38% |
$42.33
|
332,022
68.32% of 50 DAV
50 DAV is 486,000
|
$44.81
-6.23%
|
6/5/2014
|
$43.54
|
PP = $43.44
|
|
MB = $45.61
|
Most Recent Note - 7/17/2014 3:45:36 PM
G - Still sputtering below its 50 DMA line, and a rebound above that important short-term average is needed to help its outlook improve.
>>> FEATURED STOCK ARTICLE : Slump Below 50-Day Moving Average Line Hurt Outlook - 7/11/2014
View all notes |
Set NEW NOTE alert |
CANSLIM.net Company Profile |
SEC
News |
Chart |
Request a new note
C
A N
S L
I M
|
PANW
-
NYSE
Palo Alto Networks
Computer Sftwr-Security
|
$77.26
|
-0.33
-0.43% |
$78.92
|
1,556,490
83.15% of 50 DAV
50 DAV is 1,872,000
|
$85.78
-9.93%
|
5/29/2014
|
$75.95
|
PP = $72.50
|
|
MB = $76.13
|
Most Recent Note - 7/16/2014 7:56:50 PM
G - Small gap up gain today on higher but still below average volume. Its 50 DMA line defines important support and a violation would raise serious concerns and trigger a technical sell signal.
>>> FEATURED STOCK ARTICLE : Gap Up Gain on Above Average Volume for New Highs - 6/30/2014
View all notes |
Set NEW NOTE alert |
CANSLIM.net Company Profile |
SEC
News |
Chart |
Request a new note
C
A N
S L
I M
|
SN
-
NYSE
Sanchez Energy Corp
ENERGY - Independent Oil and Gas
|
$32.09
|
-1.10
-3.31% |
$33.67
|
1,094,147
68.17% of 50 DAV
50 DAV is 1,605,000
|
$38.95
-17.61%
|
5/22/2014
|
$33.00
|
PP = $31.59
|
|
MB = $33.17
|
Most Recent Note - 7/17/2014 4:21:40 PM
Slumped further below its 50 DMA line and finished near the session low with today's damaging loss. It will be dropped from the Featured Stocks tonight. Only a prompt rebound above its 50 DMA line would help its outlook improve.
>>> FEATURED STOCK ARTICLE : Recently Featured Stock Outpaced Benchmark S&P 500 Index - 7/3/2014
View all notes |
Set NEW NOTE alert |
CANSLIM.net Company Profile |
SEC
News |
Chart |
Request a new note
C
A N
S L
I M
|
Symbol/Exchange
Company Name
Industry Group |
PRICE |
CHANGE
(%Change) |
Day High |
Volume
(% DAV)
(% 50 day avg vol) |
52 Wk Hi
% From Hi |
Featured
Date |
Price
Featured |
Pivot Featured |
|
Max Buy |
TARO
-
NYSE
Taro Pharmaceutical Inds
DRUGS - Drug Manufacturers - Other
|
$140.49
|
-2.90
-2.02% |
$143.39
|
39,340
57.01% of 50 DAV
50 DAV is 69,000
|
$149.89
-6.27%
|
6/26/2014
|
$117.31
|
PP = $118.90
|
|
MB = $124.85
|
Most Recent Note - 7/17/2014 4:30:47 PM
G - Pulled back for a 3rd consecutive loss today on lighter volume. Extended from its prior base. Disciplined investors avoid chasing stocks more than +5% above prior highs.
>>> FEATURED STOCK ARTICLE : Fundamentally Strong Stock Challenging Prior Resistance Level - 6/26/2014
View all notes |
Set NEW NOTE alert |
CANSLIM.net Company Profile |
SEC
News |
Chart |
Request a new note
C
A N
S L
I M
|
TRN
-
NYSE
Trinity Industries Inc
TRANSPORTATION - Railroads
|
$43.46
|
-0.72
-1.63% |
$44.38
|
1,275,951
41.01% of 50 DAV
50 DAV is 3,111,000
|
$46.00
-5.52%
|
4/30/2014
|
$37.79
|
PP = $38.03
|
|
MB = $39.93
|
Most Recent Note - 7/15/2014 4:21:17 PM
G - Volume totals have been cooling while holding its ground stubbornly and consolidating near its 52-week high, extended from its prior base. Its 50 DMA line defines important near-term support to watch.
>>> FEATURED STOCK ARTICLE : Bullish Up/Down Volume and Increasing Institutional Ownership - 7/8/2014
View all notes |
Set NEW NOTE alert |
CANSLIM.net Company Profile |
SEC
News |
Chart |
Request a new note
C
A N
S L
I M
|
UA
-
NYSE
Under Armour Inc Cl A
CONSUMER NON-DURABLES - Textile - Apparel Clothing
|
$57.00
|
-0.34
-0.59% |
$57.99
|
1,794,110
69.32% of 50 DAV
50 DAV is 2,588,000
|
$62.40
-8.65%
|
7/10/2014
|
$58.50
|
PP = $60.79
|
|
MB = $63.83
|
Most Recent Note - 7/15/2014 4:29:40 PM
Y - Holding its ground since highlighted in yellow in the 7/10/14 mid-day report (read here) forming cup-with-handle base. Volume-driven gains above the pivot point are still needed to trigger a proper technical buy signal.
>>> FEATURED STOCK ARTICLE : Forming Handle on Cup-With-Handle Base Pattern - 7/10/2014
View all notes |
Set NEW NOTE alert |
CANSLIM.net Company Profile |
SEC
News |
Chart |
Request a new note
C
A N
S L
I M
|
WLK
-
NYSE
Westlake Chemical Corp
CHEMICALS - Specialty Chemicals
|
$84.75
|
+0.21
0.25% |
$84.98
|
432,144
73.49% of 50 DAV
50 DAV is 588,000
|
$86.13
-1.60%
|
4/29/2014
|
$72.79
|
PP = $69.31
|
|
MB = $72.78
|
Most Recent Note - 7/14/2014 6:23:40 PM
G - Hovering near its 52-week high, extended from any sound base pattern. Its 50 DMA line ($80.57) defines important near-term support to watch on pullbacks.
>>> FEATURED STOCK ARTICLE : Great Ranks and Reassuring Leadership in Chemical Group - 7/7/2014
View all notes |
Set NEW NOTE alert |
CANSLIM.net Company Profile |
SEC
News |
Chart |
Request a new note
C
A N
S L
I M
|
|
|
|
THESE ARE NOT BUY RECOMMENDATIONS!
Comments contained in the body of this report are technical
opinions only. The material herein has been obtained
from sources believed to be reliable and accurate, however,
its accuracy and completeness cannot be guaranteed.
This site is not an investment advisor, hence it does
not endorse or recommend any securities or other investments.
Any recommendation contained in this report may not
be suitable for all investors and it is not to be deemed
an offer or solicitation on our part with respect to
the purchase or sale of any securities. All trademarks,
service marks and trade names appearing in this report
are the property of their respective owners, and are
likewise used for identification purposes only.
This report is a service available
only to active Paid Premium Members.
You may opt-out of receiving report notifications
at any time. Questions or comments may be submitted
by writing to Premium Membership Services 665 S.E. 10 Street, Suite 201 Deerfield Beach, FL 33441-5634 or by calling 1-800-965-8307
or 954-785-1121.
|
|
|

