You are not logged in.
This means you
CAN ONLY VIEW reports that were published prior to Tuesday, April 15, 2025.
You
MUST UPGRADE YOUR MEMBERSHIP if you want to see any current reports.
AFTER MARKET UPDATE - MONDAY, JULY 21ST, 2014
Previous After Market Report Next After Market Report >>>
|
|
|
|
DOW |
-48.45 |
17,051.73 |
-0.28% |
|
Volume |
529,868,460 |
-29% |
|
Volume |
1,455,453,900 |
-14% |
|
NASDAQ |
-7.45 |
4,424.70 |
-0.17% |
|
Advancers |
1,126 |
36% |
|
Advancers |
1,053 |
37% |
|
S&P 500 |
-4.59 |
1,973.63 |
-0.23% |
|
Decliners |
1,929 |
61% |
|
Decliners |
1,735 |
60% |
|
Russell 2000 |
-4.95 |
1,146.66 |
-0.43% |
|
52 Wk Highs |
89 |
|
|
52 Wk Highs |
49 |
|
|
S&P 600 |
-3.21 |
660.83 |
-0.48% |
|
52 Wk Lows |
29 |
|
|
52 Wk Lows |
40 |
|
|
 |
Major Averages Ended Lower With Lighter Volume Totals
Kenneth J. Gruneisen - Passed the CAN SLIM® Master's Exam
The major averages pared earlier losses to finish modestly lower on Monday. The volume totals were lighter than the prior session volume totals on the NYSE and on the Nasdaq exchange. Breadth was negative as decliners led advancers by more than a 3-2 margin on the Nasdaq exchange and on the NYSE. There were 24 high-ranked companies from the CANSLIM.net Leaders List that made new 52-week highs and appeared on the CANSLIM.net BreakOuts Page, down from the prior session total of 26 stocks. New 52-week highs outnumbered new 52-week lows on the NYSE and on the Nasdaq exchange. There were gains for 4 of the 13 of the high-ranked companies currently included on the Featured Stocks Page. The market (M criteria) uptrend has recently faced pressure and has been threatening to earn the label of being in a "correction" while leadership has become scarce. Disciplined investors limit losses and reduce market exposure during rough market periods by selling any stocks which fall more than -7% from their purchase price.
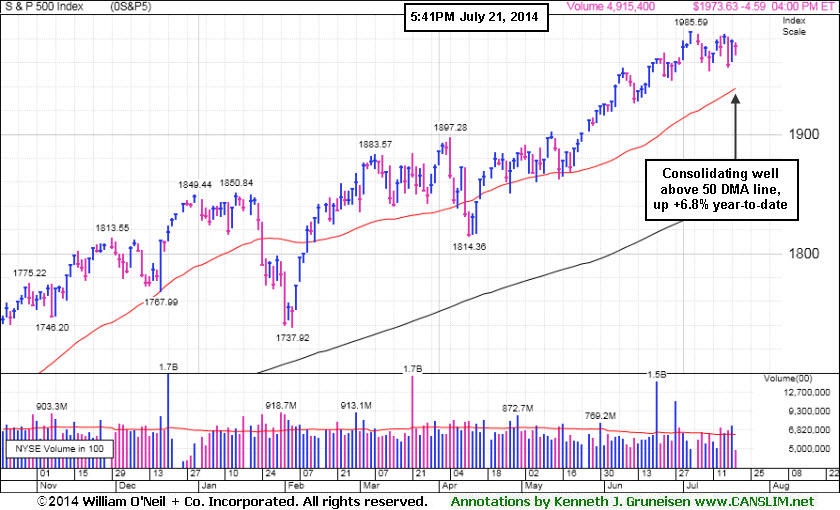
PICTURED: The S&P 500 Index declined 4 points to 1,973. The benchmark index is consolidating above its 50-day moving average (DMA) line, up +6.8% year-to-date.
A round of profit taking pushed stocks lower amid geopolitical concerns. The U.S. suggested Russia provided the missile used to down a passenger jet in Ukraine and warned deeper sanctions against Russia may be implemented. In addition, President Obama called for an immediate ceasefire in Gaza as violence between Palestine and Israeli intensified.
Overall, nine of the 10 S&P 500 sectors declined. Consumer stocks paced the retreat as McDonald's (MCD -1.45%) and Philip Morris (PM -0.6%) edged lower. Gains in technology and energy helped limit the major averages' losses. EMC (EMC +4.9%) rose following a report that an activist investor is pushing for a break-up of the company. Facebook (FB +1.43%) also rose. Exxon Mobil (XOM +0.34%) edged higher and Halliburton (HAL +0.10%) closed little changed despite posting better-than-expected earnings results. Profit tallies also garnered attention after the close with notable reports out from Netflix (NFLX +1.75%) and Texas Instruments (TXN +0.72%).
Treasuries finished higher. The 10-year note rose 3/32 to yield 2.47%. The 30-year bond gained 15/32 to yield 3.26%.
The CANSLIM.net Featured Stocks Page shows the most action-worthy candidates and their latest notes and a Headline Link directs members to the latest detailed analysis with data-packed graphs annotated by a Certified expert along with links to additional resources. The Premium Member Homepage includes "dynamic archives" to all prior pay reports published. Watch for an announcement via email concerning the next WEBCAST.
|
 Kenneth J. Gruneisen started out as a licensed stockbroker in August 1987, a couple of months prior to the historic stock market crash that took the Dow Jones Industrial Average down -22.6% in a single day. He has published daily fact-based fundamental and technical analysis on high-ranked stocks online for two decades. Through FACTBASEDINVESTING.COM, Kenneth provides educational articles, news, market commentary, and other information regarding proven investment systems that work in good times and bad.
Comments contained in the body of this report are technical opinions only and are not necessarily those of Gruneisen Growth Corp. The material herein has been obtained from sources believed to be reliable and accurate, however, its accuracy and completeness cannot be guaranteed. Our firm, employees, and customers may effect transactions, including transactions contrary to any recommendation herein, or have positions in the securities mentioned herein or options with respect thereto. Any recommendation contained in this report may not be suitable for all investors and it is not to be deemed an offer or solicitation on our part with respect to the purchase or sale of any securities. |
|
 |
Retail and Bank Index Edged Lower
Kenneth J. Gruneisen - Passed the CAN SLIM® Master's Exam
The Retail Index ($RLX -0.30%) was a slightly negative weight on the major averages and the Bank Index ($BKX -0.35%) and Broker/Dealer Index ($XBD -0.10%) both edged lower. The tech sector was quiet as the Networking Index ($NWX +0.14%) and the Semiconductor Index ($SOX +0.25%) edged higher and the Biotechnology Index ($BTK -0.09%) ended slightly lower. Commodity-linked groups were little changed as the Oil Services Index ($OSX +0.26%) eked out a small gain and the Integrated Oil Index ($XOI -0.03%) and the Gold & Silver Index ($XAU -0.06%).
Charts courtesy www.stockcharts.com
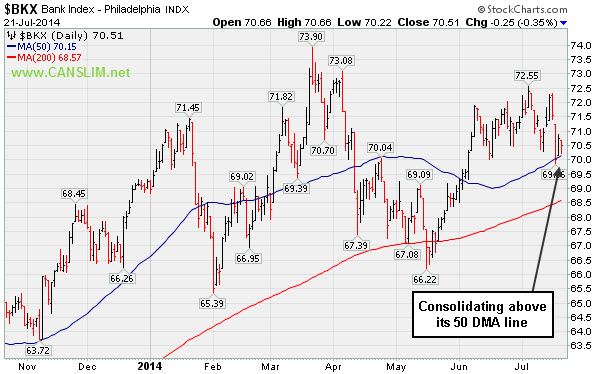
PICTURED: The Bank Index ($BKX -0.35%) is consolidating above its 50-day moving average (DMA) line.
| Oil Services |
$OSX |
304.86 |
+0.80 |
+0.26% |
+8.48% |
| Integrated Oil |
$XOI |
1,670.06 |
-0.46 |
-0.03% |
+11.10% |
| Semiconductor |
$SOX |
645.02 |
+1.58 |
+0.25% |
+20.56% |
| Networking |
$NWX |
333.34 |
+0.46 |
+0.14% |
+2.90% |
| Broker/Dealer |
$XBD |
157.12 |
-0.15 |
-0.10% |
-2.14% |
| Retail |
$RLX |
900.83 |
-2.74 |
-0.30% |
-4.15% |
| Gold & Silver |
$XAU |
101.92 |
-0.06 |
-0.06% |
+21.12% |
| Bank |
$BKX |
70.51 |
-0.25 |
-0.35% |
+1.80% |
| Biotech |
$BTK |
2,721.93 |
-2.40 |
-0.09% |
+16.80% |
|
|
|
 |
Strength Returned After Shake-Out and Positive Reversal
Kenneth J. Gruneisen - Passed the CAN SLIM® Master's Exam
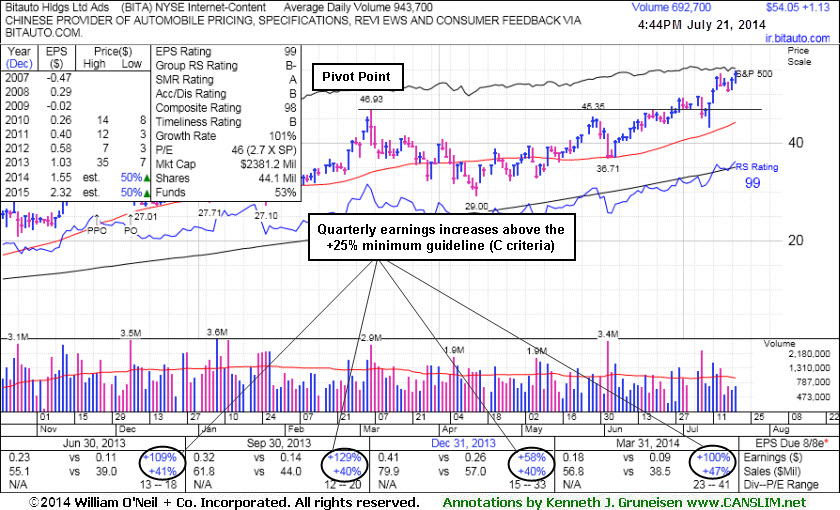
Biotauto Hldgs Ltd Ads (BITA +$1.27 +2.40% to $54.19) posted a small gain today on lighter than average volume and hit a new 52-week high. It is well above its "max buy" level, extended from its prior base. Now it faces no overhead supply to act as resistance. BITA was last shown in this FSU section on 6/27/14 with an annotated graphs under the headline,"Perched At High With No Resistance Remaining Due to Overhead Supply", after highlighted in yellow in the 6/26/14 mid-day report (read here) with pivot point cited based on the 3/06/14 high plus 10 cents.
A gain above its pivot point on 6/30/14 backed by +50% above average volume triggered a technical buy signal. It managed a "positive reversal" on 7/10/14 after trading down considerably, likely prompting disciplined investors to sell if it fell more than -7% from their purchase price. Any stock which is sold can be bought back later if strength returns, however rule number one is to always limit losses while they are small. Note that it stayed well above its 50-day moving average (DMA) line which defines important support for chart readers.
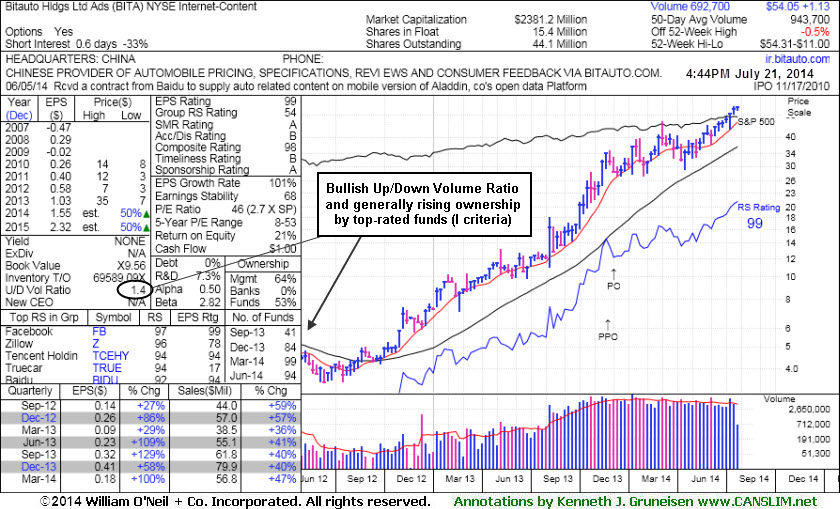
Fundamentals remain strong with respect to the C and A criteria as it reported earnings +100% on +47% sales revenues for the Mar '14 quarter since dropped from the Featured Stocks list on 1/27/14. BITA was shown in this FSU section on 1/08/14 with an annotated graphs under the headline,"Finished Strong and Challenged Pivot Point After Highlighted in Mid-Day Report". Members were previously - "Like any stock that is dropped from the Featured Stocks list, if fundamentals remain strong while a new base forms, and strength eventually returns, it may one day return to the Featured Stocks list." It was first highlighted in the 8/07/13 mid-day report in yellow at $12.01 with the prior pivot point based on its 5/08/13 high plus 10 cents (read here).
This China-based Internet-Content firm's quarterly and annual earnings (C and A criteria) history has been strong. Its small supply (S criteria) of only 15.4 million shares in the public float can contribute to great volatility in the event of institutional buying or selling. There are 94 top-rated mutual funds as of Jun '14 owning an interest in the company, up from 41 in Sep '13, a reassuring sign concerning the I criteria. Its current Up/Down Volume Ratio is 1.4, an unbiased indication its shares have been under accumulation over the past 50 days.
|
|
|
Color Codes Explained :
Y - Better candidates highlighted by our
staff of experts.
G - Previously featured
in past reports as yellow but may no longer be buyable under the
guidelines.
***Last / Change / Volume data in this table is the closing quote data***
Symbol/Exchange
Company Name
Industry Group |
PRICE |
CHANGE
(%Change) |
Day High |
Volume
(% DAV)
(% 50 day avg vol) |
52 Wk Hi
% From Hi |
Featured
Date |
Price
Featured |
Pivot Featured |
|
Max Buy |
ACT
-
NYSE
Actavis plc
Medical-Generic Drugs
|
$216.13
|
-2.05
-0.94% |
$218.17
|
1,461,820
67.06% of 50 DAV
50 DAV is 2,180,000
|
$230.77
-6.34%
|
6/20/2014
|
$216.53
|
PP = $230.87
|
|
MB = $242.41
|
Most Recent Note - 7/16/2014 7:53:41 PM
Y - Consolidating above its 50 DMA line, still hovering within close striking distance of its 52-week high. Subsequent volume-driven gains to new highs may trigger a technical buy signal. See the latest FSU analysis for more details and new annotated graphs.
>>> FEATURED STOCK ARTICLE : Disciplined Investors Still Awaiting Technical Breakout - 7/16/2014
View all notes |
Set NEW NOTE alert |
CANSLIM.net Company Profile |
SEC
News |
Chart |
Request a new note
C
A N
S L
I M


|
AFSI
-
NASDAQ
Amtrust Financial Svcs
INSURANCE - Property and; Casualty Insurance
|
$41.50
|
-0.86
-2.03% |
$42.16
|
283,416
45.20% of 50 DAV
50 DAV is 627,000
|
$47.10
-11.89%
|
5/21/2014
|
$44.85
|
PP = $44.85
|
|
MB = $47.09
|
 Most Recent Note - 7/21/2014 6:19:06 PM
G - Still sputtering below its 50 DMA line and its Relative Strength rating has slipped to 79, below the 80+ minimum guideline for buy candidates. Faces resistance due to overhead supply up through the $47 level.
>>> FEATURED STOCK ARTICLE : Found Support Near 50-Day Average and Relative Strength Slightly Improved - 7/1/2014
View all notes |
Set NEW NOTE alert |
CANSLIM.net Company Profile |
SEC
News |
Chart |
Request a new note
C
A N
S L
I M
|
BITA
-
NYSE
Bitauto Hldgs Ltd Ads
Internet-Content
|
$54.05
|
+1.13
2.14% |
$54.72
|
692,718
73.46% of 50 DAV
50 DAV is 943,000
|
$54.31
-0.48%
|
6/26/2014
|
$46.20
|
PP = $47.03
|
|
MB = $49.38
|
Most Recent Note - 7/21/2014 6:14:34 PM
G - Consolidating above its "max buy" level, extended from its prior base. See the latest FSU analysis for more details and annotated graphs.
>>> FEATURED STOCK ARTICLE : Strength Returned After Shake-Out and Positive Reversal - 7/21/2014
View all notes |
Set NEW NOTE alert |
CANSLIM.net Company Profile |
SEC
News |
Chart |
Request a new note
C
A N
S L
I M
|
BWLD
-
NASDAQ
Buffalo Wild Wings Inc
LEISURE - Restaurants
|
$151.13
|
-2.42
-1.58% |
$153.39
|
280,623
74.83% of 50 DAV
50 DAV is 375,000
|
$167.36
-9.70%
|
6/19/2014
|
$158.52
|
PP = $159.91
|
|
MB = $167.91
|
Most Recent Note - 7/21/2014 6:17:22 PM
G - Quietly sputtered below its 50 DMA line and its color code is changed to green. Only a prompt rebound would help its outlook improve. Weak action completely negated the recent technical breakout.
>>> FEATURED STOCK ARTICLE : Slump Into Prior Base Negated Recent Breakout - 7/14/2014
View all notes |
Set NEW NOTE alert |
CANSLIM.net Company Profile |
SEC
News |
Chart |
Request a new note
C
A N
S L
I M
|
EQM
-
NYSE
E Q T Midstream Partners
ENERGY - Oil and Gas Pipelines
|
$94.60
|
-0.48
-0.50% |
$95.51
|
181,478
56.89% of 50 DAV
50 DAV is 319,000
|
$102.51
-7.72%
|
12/12/2013
|
$53.17
|
PP = $56.51
|
|
MB = $59.34
|
Most Recent Note - 7/17/2014 9:38:36 PM
G - Volume totals have been cooling in recent weeks while consolidating well above its 50 DMA line. Strength has continued despite fundamental flaws repeatedly noted. See the latest FSU analysis for more details and new annotated graphs.
>>> FEATURED STOCK ARTICLE : Volume Totals Cooling While Consolidating Near Highs - 7/17/2014
View all notes |
Set NEW NOTE alert |
CANSLIM.net Company Profile |
SEC
News |
Chart |
Request a new note
C
A N
S L
I M
|
Symbol/Exchange
Company Name
Industry Group |
PRICE |
CHANGE
(%Change) |
Day High |
Volume
(% DAV)
(% 50 day avg vol) |
52 Wk Hi
% From Hi |
Featured
Date |
Price
Featured |
Pivot Featured |
|
Max Buy |
GRFS
-
NASDAQ
Grifols Sa Cl B Ads
Medical-Ethical Drugs
|
$40.95
|
-0.07
-0.17% |
$41.29
|
404,797
59.27% of 50 DAV
50 DAV is 683,000
|
$46.66
-12.24%
|
5/15/2014
|
$41.14
|
PP = $43.55
|
|
MB = $45.73
|
Most Recent Note - 7/16/2014 7:55:00 PM
G - Encountered resistance at its 50 DMA line and slumped for another loss today with lighter volume. Faces resistance due to overhead supply up through the $46 area.
>>> FEATURED STOCK ARTICLE : Violation of 50-Day Moving Average Triggered Technical Sell Signal - 7/9/2014
View all notes |
Set NEW NOTE alert |
CANSLIM.net Company Profile |
SEC
News |
Chart |
Request a new note
C
A N
S L
I M
|
HF
-
NYSE
H F F Inc Cl A
REAL ESTATE - Property Management/Developmen
|
$34.71
|
-0.12
-0.34% |
$34.81
|
150,668
76.09% of 50 DAV
50 DAV is 198,000
|
$38.23
-9.21%
|
6/20/2014
|
$34.60
|
PP = $36.16
|
|
MB = $37.97
|
Most Recent Note - 7/17/2014 3:44:25 PM
Y - Undercutting prior highs in the $35 area and negating its recent breakout with today's 4th consecutive loss on ever-increasing volume. Testing its 50 DMA line ($34.05) where further deterioration would raise greater concerns.
>>> FEATURED STOCK ARTICLE : Slump Into Prior Base Negated Recent Breakout - 7/15/2014
View all notes |
Set NEW NOTE alert |
CANSLIM.net Company Profile |
SEC
News |
Chart |
Request a new note
C
A N
S L
I M
|
ICON
-
NASDAQ
Iconix Brand Group Inc
CONSUMER NON-DURABLES - Textile - Apparel Footwear
|
$42.03
|
-0.33
-0.78% |
$42.46
|
230,084
48.54% of 50 DAV
50 DAV is 474,000
|
$44.81
-6.20%
|
6/5/2014
|
$43.54
|
PP = $43.44
|
|
MB = $45.61
|
Most Recent Note - 7/17/2014 3:45:36 PM
G - Still sputtering below its 50 DMA line, and a rebound above that important short-term average is needed to help its outlook improve.
>>> FEATURED STOCK ARTICLE : Slump Below 50-Day Moving Average Line Hurt Outlook - 7/11/2014
View all notes |
Set NEW NOTE alert |
CANSLIM.net Company Profile |
SEC
News |
Chart |
Request a new note
C
A N
S L
I M
|
PANW
-
NYSE
Palo Alto Networks
Computer Sftwr-Security
|
$80.03
|
+0.82
1.04% |
$80.10
|
922,661
50.45% of 50 DAV
50 DAV is 1,829,000
|
$85.78
-6.70%
|
5/29/2014
|
$75.95
|
PP = $72.50
|
|
MB = $76.13
|
Most Recent Note - 7/16/2014 7:56:50 PM
G - Small gap up gain today on higher but still below average volume. Its 50 DMA line defines important support and a violation would raise serious concerns and trigger a technical sell signal.
>>> FEATURED STOCK ARTICLE : Gap Up Gain on Above Average Volume for New Highs - 6/30/2014
View all notes |
Set NEW NOTE alert |
CANSLIM.net Company Profile |
SEC
News |
Chart |
Request a new note
C
A N
S L
I M
|
TARO
-
NYSE
Taro Pharmaceutical Inds
DRUGS - Drug Manufacturers - Other
|
$143.51
|
-1.73
-1.19% |
$145.98
|
26,924
38.46% of 50 DAV
50 DAV is 70,000
|
$149.89
-4.26%
|
6/26/2014
|
$117.31
|
PP = $118.90
|
|
MB = $124.85
|
Most Recent Note - 7/18/2014 6:45:47 PM
G - Tallied big gains after recent breakout, an encouraging sign. Disciplined investors avoid chasing stocks more than +5% above prior highs. See latest FSU analysis for more details and annotated graphs.
>>> FEATURED STOCK ARTICLE : Big Gains in First 2-3 Weeks After Breakout an Encouraging Sign - 7/18/2014
View all notes |
Set NEW NOTE alert |
CANSLIM.net Company Profile |
SEC
News |
Chart |
Request a new note
C
A N
S L
I M
|
Symbol/Exchange
Company Name
Industry Group |
PRICE |
CHANGE
(%Change) |
Day High |
Volume
(% DAV)
(% 50 day avg vol) |
52 Wk Hi
% From Hi |
Featured
Date |
Price
Featured |
Pivot Featured |
|
Max Buy |
TRN
-
NYSE
Trinity Industries Inc
TRANSPORTATION - Railroads
|
$44.49
|
-0.49
-1.09% |
$44.70
|
2,895,823
95.73% of 50 DAV
50 DAV is 3,025,000
|
$46.00
-3.28%
|
4/30/2014
|
$37.79
|
PP = $38.03
|
|
MB = $39.93
|
Most Recent Note - 7/15/2014 4:21:17 PM
G - Volume totals have been cooling while holding its ground stubbornly and consolidating near its 52-week high, extended from its prior base. Its 50 DMA line defines important near-term support to watch.
>>> FEATURED STOCK ARTICLE : Bullish Up/Down Volume and Increasing Institutional Ownership - 7/8/2014
View all notes |
Set NEW NOTE alert |
CANSLIM.net Company Profile |
SEC
News |
Chart |
Request a new note
C
A N
S L
I M
|
UA
-
NYSE
Under Armour Inc Cl A
CONSUMER NON-DURABLES - Textile - Apparel Clothing
|
$58.96
|
+0.35
0.60% |
$59.48
|
1,930,109
76.32% of 50 DAV
50 DAV is 2,529,000
|
$62.40
-5.51%
|
7/10/2014
|
$58.50
|
PP = $60.79
|
|
MB = $63.83
|
Most Recent Note - 7/15/2014 4:29:40 PM
Y - Holding its ground since highlighted in yellow in the 7/10/14 mid-day report (read here) forming cup-with-handle base. Volume-driven gains above the pivot point are still needed to trigger a proper technical buy signal.
>>> FEATURED STOCK ARTICLE : Forming Handle on Cup-With-Handle Base Pattern - 7/10/2014
View all notes |
Set NEW NOTE alert |
CANSLIM.net Company Profile |
SEC
News |
Chart |
Request a new note
C
A N
S L
I M
|
WLK
-
NYSE
Westlake Chemical Corp
CHEMICALS - Specialty Chemicals
|
$86.95
|
+0.57
0.66% |
$87.34
|
457,836
81.32% of 50 DAV
50 DAV is 563,000
|
$86.75
0.23%
|
4/29/2014
|
$72.79
|
PP = $69.31
|
|
MB = $72.78
|
Most Recent Note - 7/21/2014 6:21:09 PM
G - Hit another new 52-week high with today's 4th consecutive gain, getting more extended from any sound base pattern. Its 50 DMA line ($81.60) defines important near-term support to watch on pullbacks.
>>> FEATURED STOCK ARTICLE : Great Ranks and Reassuring Leadership in Chemical Group - 7/7/2014
View all notes |
Set NEW NOTE alert |
CANSLIM.net Company Profile |
SEC
News |
Chart |
Request a new note
C
A N
S L
I M
|
|
|
|
THESE ARE NOT BUY RECOMMENDATIONS!
Comments contained in the body of this report are technical
opinions only. The material herein has been obtained
from sources believed to be reliable and accurate, however,
its accuracy and completeness cannot be guaranteed.
This site is not an investment advisor, hence it does
not endorse or recommend any securities or other investments.
Any recommendation contained in this report may not
be suitable for all investors and it is not to be deemed
an offer or solicitation on our part with respect to
the purchase or sale of any securities. All trademarks,
service marks and trade names appearing in this report
are the property of their respective owners, and are
likewise used for identification purposes only.
This report is a service available
only to active Paid Premium Members.
You may opt-out of receiving report notifications
at any time. Questions or comments may be submitted
by writing to Premium Membership Services 665 S.E. 10 Street, Suite 201 Deerfield Beach, FL 33441-5634 or by calling 1-800-965-8307
or 954-785-1121.
|
|
|

