***Last / Change / Volume data in this table is the closing quote data***
Symbol/Exchange
Company Name
Industry Group |
PRICE |
CHANGE
(%Change) |
Day High |
Volume
(% DAV)
(% 50 day avg vol) |
52 Wk Hi
% From Hi |
Featured
Date |
Price
Featured |
Pivot Featured |
|
Max Buy |
ALXN
-
NASDAQ
Alexion Pharmaceuticals
DRUGS - Drug Manufacturers - Other
|
$98.97
|
+1.47
1.51% |
$99.18
|
825,792
37.14% of 50 DAV
50 DAV is 2,223,600
|
$104.38
-5.18%
|
5/1/2012
|
$91.73
|
PP = $95.11
|
|
MB = $99.87
|
Most Recent Note - 7/13/2012 3:38:53 PM
Y - Halted its slide this week above prior highs in the $95 area that define support to watch above its 50 DMA line.
>>> The latest Featured Stock Update with an annotated graph appeared on 6/29/2012. Click here.
View all notes |
Alert me of new notes |
CANSLIM.net Company Profile |
SEC |
Zacks Reports |
StockTalk |
News |
Chart |
Request a new note
C
A N
S L
I M


|
ASPS
-
NASDAQ
Altisource Ptf Sltns Sa
REAL ESTATE - Property Management/Developmen
|
$74.59
|
-0.41
-0.55% |
$75.25
|
73,834
54.13% of 50 DAV
50 DAV is 136,400
|
$76.20
-2.11%
|
6/5/2012
|
$60.01
|
PP = $63.00
|
|
MB = $66.15
|
Most Recent Note - 7/13/2012 3:25:36 PM
G - Up today following a damaging loss with above average volume on the prior session. Prior highs in the $65 area and its 50 DMA line define near-term support to watch.
>>> The latest Featured Stock Update with an annotated graph appeared on 7/3/2012. Click here.
View all notes |
Alert me of new notes |
CANSLIM.net Company Profile |
SEC |
Zacks Reports |
StockTalk |
News |
Chart |
Request a new note
C
A N
S L
I M
|
CERN
-
NASDAQ
Cerner Corp
COMPUTER SOFTWARE and SERVICES - Healthcare Information Service
|
$78.07
|
+0.48
0.62% |
$79.20
|
1,808,286
126.46% of 50 DAV
50 DAV is 1,429,900
|
$88.32
-11.61%
|
6/7/2012
|
$78.36
|
PP = $84.20
|
|
MB = $88.41
|
Most Recent Note - 7/16/2012 1:12:35 PM
G - Slumping below its 50 DMA line today raising concerns, and prior lows in the $75-76 area define the next important chart support level. It has not formed a proper base since negating its prior breakout.
>>> The latest Featured Stock Update with an annotated graph appeared on 7/9/2012. Click here.
View all notes |
Alert me of new notes |
CANSLIM.net Company Profile |
SEC |
Zacks Reports |
StockTalk |
News |
Chart |
Request a new note
C
A N
S L
I M
|
CMCSA
-
NASDAQ
Comcast Corp Cl A
MEDIA - CATV Systems
|
$32.33
|
+0.50
1.57% |
$32.40
|
13,359,955
98.91% of 50 DAV
50 DAV is 13,507,200
|
$32.50
-0.52%
|
6/11/2012
|
$29.94
|
PP = $30.98
|
|
MB = $32.53
|
Most Recent Note - 7/13/2012 3:28:27 PM
Y - Trading up today after a loss with above average volume on the prior session. Still consolidating in a tight range near its 52-week high, holding ground above its pivot point. No overhead supply remains to act as resistance and it is still trading below its "max buy" level. See the latest FSU analysis for more details and a new annotated graph.
>>> The latest Featured Stock Update with an annotated graph appeared on 7/11/2012. Click here.
View all notes |
Alert me of new notes |
CANSLIM.net Company Profile |
SEC |
Zacks Reports |
StockTalk |
News |
Chart |
Request a new note
C
A N
S L
I M
|
CSTR
-
NASDAQ
Coinstar Inc
DIVERSIFIED SERVICES - Personal Services
|
$62.56
|
-0.03
-0.05% |
$64.10
|
863,380
80.71% of 50 DAV
50 DAV is 1,069,700
|
$71.82
-12.89%
|
6/26/2012
|
$64.05
|
PP = $67.00
|
|
MB = $70.35
|
Most Recent Note - 7/16/2012 5:43:57 PM
G - Closed below its 50 DMA line today with a 2nd consecutive damaging loss with above average volume triggering a technical sell signal. Completely negated its recent breakout and raised concerns while promptly slumping back into its prior base. Disciplined investors always limit losses by selling if any stock falls more than -7% from their purchase price.
>>> The latest Featured Stock Update with an annotated graph appeared on 6/26/2012. Click here.
View all notes |
Alert me of new notes |
CANSLIM.net Company Profile |
SEC |
Zacks Reports |
StockTalk |
News |
Chart |
Request a new note
C
A N
S L
I M
|
Symbol/Exchange
Company Name
Industry Group |
PRICE |
CHANGE
(%Change) |
Day High |
Volume
(% DAV)
(% 50 day avg vol) |
52 Wk Hi
% From Hi |
Featured
Date |
Price
Featured |
Pivot Featured |
|
Max Buy |
CTRX
-
NASDAQ
Catamaran Corp
COMPUTER SOFTWARE and SERVICES - Healthcare Information Service
|
$91.09
|
-1.97
-2.12% |
$93.98
|
1,066,481
91.37% of 50 DAV
50 DAV is 1,167,200
|
$104.79
-13.07%
|
6/14/2012
|
$94.71
|
PP = $100.60
|
|
MB = $105.63
|
 Most Recent Note - 7/17/2012 3:53:56 PM
G - Slumping below its 50 DMA line ($92.87) today with a loss on higher (near average) volume. Churned above average volume while not making headway above its pivot point, and recent "negative reversals" were noted as signs of distributional pressure. See the latest FSU analysis for more details and a new annotated graph.
>>> The latest Featured Stock Update with an annotated graph appeared on 7/16/2012. Click here.
View all notes |
Alert me of new notes |
CANSLIM.net Company Profile |
SEC |
Zacks Reports |
StockTalk |
News |
Chart |
Request a new note
C
A N
S L
I M
|
DG
-
NYSE
Dollar General Corp
RETAIL - Discount, Variety Stores
|
$55.06
|
+0.45
0.82% |
$55.23
|
1,378,748
36.30% of 50 DAV
50 DAV is 3,798,500
|
$56.04
-1.75%
|
7/16/2012
|
$54.68
|
PP = $56.14
|
|
MB = $58.95
|
Most Recent Note - 7/16/2012 1:20:51 PM
Y - Volume totals have been cooling while recently hovering near its all-time high. Color code is changed to yellow after forming an advanced "3-weeks tight" base. Volume-driven gains above its new pivot point may trigger a new (or add-on) technical buy signal. Completed another Secondary Offering on 6/05/12, its 4th Secondary Offering since September '11.
>>> The latest Featured Stock Update with an annotated graph appeared on 7/12/2012. Click here.
View all notes |
Alert me of new notes |
CANSLIM.net Company Profile |
SEC |
Zacks Reports |
StockTalk |
News |
Chart |
Request a new note
C
A N
S L
I M
|
ECHO
-
NASDAQ
Echo Global Logistics
DIVERSIFIED SERVICES - Business/Management Services
|
$18.97
|
-0.46
-2.37% |
$19.48
|
118,852
94.85% of 50 DAV
50 DAV is 125,300
|
$19.97
-5.01%
|
6/22/2012
|
$18.98
|
PP = $19.48
|
|
MB = $20.45
|
Most Recent Note - 7/17/2012 3:57:00 PM
Y - Down today on lighter volume after briefly trading above its pivot point and hitting a new 52-week high on the prior session, not quite triggering a proper technical buy signal under the fact-based system.
>>> The latest Featured Stock Update with an annotated graph appeared on 6/22/2012. Click here.
View all notes |
Alert me of new notes |
CANSLIM.net Company Profile |
SEC |
Zacks Reports |
StockTalk |
News |
Chart |
Request a new note
C
A N
S L
I M
|
EXPE
-
NASDAQ
Expedia Inc
INTERNET - Internet Information Providers
|
$45.93
|
+0.71
1.57% |
$46.45
|
2,762,496
72.64% of 50 DAV
50 DAV is 3,803,200
|
$50.66
-9.34%
|
4/27/2012
|
$41.80
|
PP = $35.57
|
|
MB = $37.35
|
Most Recent Note - 7/13/2012 3:18:25 PM
G - Rebounding above its 50 DMA line ($45.35 now) today, showing resilience after undercutting that important short-term average on the prior session. Prior highs in the $43 area define the next support level.
>>> The latest Featured Stock Update with an annotated graph appeared on 7/10/2012. Click here.
View all notes |
Alert me of new notes |
CANSLIM.net Company Profile |
SEC |
Zacks Reports |
StockTalk |
News |
Chart |
Request a new note
C
A N
S L
I M
|
GNC
-
NYSE
G N C Holdings Inc
RETAIL - Drug Stores
|
$39.24
|
+0.45
1.16% |
$40.31
|
3,134,434
135.79% of 50 DAV
50 DAV is 2,308,300
|
$42.70
-8.10%
|
6/29/2012
|
$39.20
|
PP = $40.00
|
|
MB = $42.00
|
Most Recent Note - 7/16/2012 1:08:11 PM
Y - Still sputtering below its pivot point and trading near its 50 DMA line today following last week's distributional action. Disciplined investors always limit losses if any stock falls more than -7% from their purchase price.
>>> The latest Featured Stock Update with an annotated graph appeared on 7/5/2012. Click here.
View all notes |
Alert me of new notes |
CANSLIM.net Company Profile |
SEC |
Zacks Reports |
StockTalk |
News |
Chart |
Request a new note
C
A N
S L
I M
|
Symbol/Exchange
Company Name
Industry Group |
PRICE |
CHANGE
(%Change) |
Day High |
Volume
(% DAV)
(% 50 day avg vol) |
52 Wk Hi
% From Hi |
Featured
Date |
Price
Featured |
Pivot Featured |
|
Max Buy |
GPX
-
NYSE
G P Strategies Corp
DIVERSIFIED SERVICES - Education and Training Services
|
$17.87
|
+0.12
0.68% |
$18.39
|
58,997
104.42% of 50 DAV
50 DAV is 56,500
|
$18.99
-5.90%
|
6/29/2012
|
$18.01
|
PP = $18.15
|
|
MB = $19.06
|
Most Recent Note - 7/16/2012 1:09:52 PM
Y - Managed a "positive reversal" on 7/12/12, however recent losses completely negated the prior breakout and raised concerns. Disciplined investors always limit losses by selling any stock if it falls more than -7% from their purchase price.
>>> The latest Featured Stock Update with an annotated graph appeared on 7/6/2012. Click here.
View all notes |
Alert me of new notes |
CANSLIM.net Company Profile |
SEC |
Zacks Reports |
StockTalk |
News |
Chart |
Request a new note
C
A N
S L
I M
|
MLNX
-
NASDAQ
Mellanox Technologies
ELECTRONICS - Semiconductor - Broad Line
|
$62.24
|
-3.61
-5.48% |
$67.28
|
1,482,541
232.37% of 50 DAV
50 DAV is 638,000
|
$77.69
-19.89%
|
6/18/2012
|
$70.90
|
PP = $67.30
|
|
MB = $70.67
|
Most Recent Note - 7/17/2012 5:50:07 PM
Down today with above average volume for an 8th consecutive loss, violating its 50 DMA line and triggering a technical sell signal. Based on weak action it ended -19.9% off its 52-week high and it will be dropped from the Featured Stocks list tonight.
>>> The latest Featured Stock Update with an annotated graph appeared on 6/25/2012. Click here.
View all notes |
Alert me of new notes |
CANSLIM.net Company Profile |
SEC |
Zacks Reports |
StockTalk |
News |
Chart |
Request a new note
C
A N
S L
I M
|
N
-
NYSE
Netsuite Inc
DIVERSIFIED SERVICES - Business/Management Services
|
$49.50
|
-0.43
-0.86% |
$50.96
|
434,959
76.90% of 50 DAV
50 DAV is 565,600
|
$56.06
-11.70%
|
6/20/2012
|
$51.83
|
PP = $51.88
|
|
MB = $54.47
|
Most Recent Note - 7/13/2012 3:30:50 PM
Y - Halted its slide above its 50 DMA line after damaging distributional losses this week undercut its pivot point and negated its recent breakout. Disciplined investors always limit losses by selling if any stock falls more than -7% from their purchase price.
>>> The latest Featured Stock Update with an annotated graph appeared on 6/20/2012. Click here.
View all notes |
Alert me of new notes |
CANSLIM.net Company Profile |
SEC |
Zacks Reports |
StockTalk |
News |
Chart |
Request a new note
C
A N
S L
I M
|
NSM
-
NYSE
Nationstar Mtg Hldgs Inc
FINANCIAL SERVICES - Credit Services
|
$24.71
|
+0.31
1.27% |
$24.80
|
496,872
62.27% of 50 DAV
50 DAV is 797,900
|
$25.11
-1.59%
|
6/27/2012
|
$20.29
|
PP = $20.46
|
|
MB = $21.48
|
Most Recent Note - 7/16/2012 5:11:01 PM
G - Hovering at its 52-week high with volume totals cooling in the past week after getting extended from its prior base. Prior highs in the $20 area define important support to watch on pullbacks.
>>> The latest Featured Stock Update with an annotated graph appeared on 6/27/2012. Click here.
View all notes |
Alert me of new notes |
CANSLIM.net Company Profile |
SEC |
Zacks Reports |
StockTalk |
News |
Chart |
Request a new note
C
A N
S L
I M
|
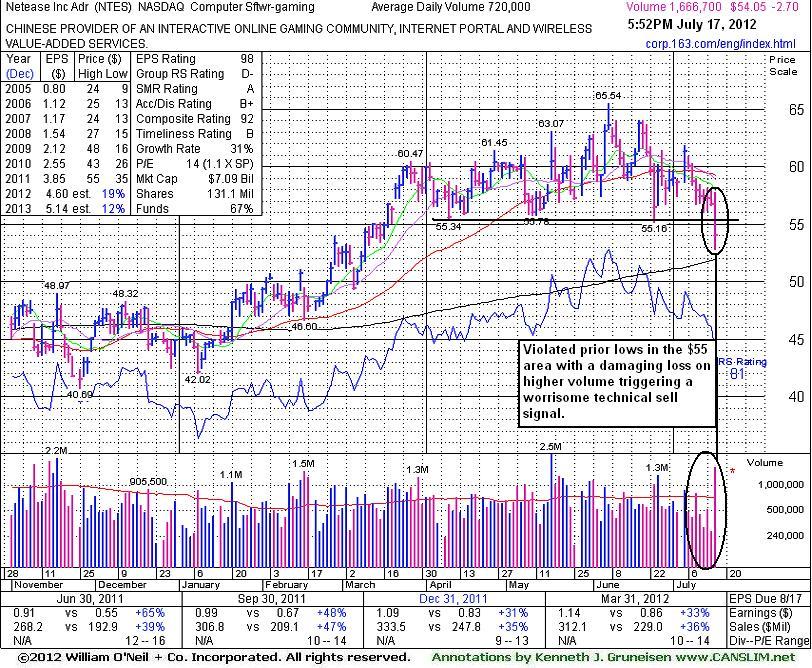
NTES
-
NASDAQ
Netease Inc Adr
INTERNET - Internet Information Providers
|
$54.05
|
-2.70
-4.76% |
$57.81
|
1,667,054
231.54% of 50 DAV
50 DAV is 720,000
|
$65.54
-17.53%
|
3/19/2012
|
$56.18
|
PP = $55.10
|
|
MB = $57.86
|
Most Recent Note - 7/17/2012 6:14:23 PM
Violated prior lows in the $55 area today and triggered a more worrisome technical sell signal while slumping toward its 200 DMA line. It faces overhead supply that may act as resistance up through the $65 area. Based on weak action it ended -17.5% off its 52-week high and it will be dropped from the Featured Stocks list tonight. See the latest FSU analysis for more details and a new annotated graph.
>>> The latest Featured Stock Update with an annotated graph appeared on 7/17/2012. Click here.
View all notes |
Alert me of new notes |
CANSLIM.net Company Profile |
SEC |
Zacks Reports |
StockTalk |
News |
Chart |
Request a new note
C
A N
S L
I M
|
Symbol/Exchange
Company Name
Industry Group |
PRICE |
CHANGE
(%Change) |
Day High |
Volume
(% DAV)
(% 50 day avg vol) |
52 Wk Hi
% From Hi |
Featured
Date |
Price
Featured |
Pivot Featured |
|
Max Buy |
TDG
-
NYSE
Transdigm Group Inc
AEROSPACE/DEFENSE - Aerospace/Defense Products and; Services
|
$129.87
|
+0.22
0.17% |
$130.34
|
296,156
57.65% of 50 DAV
50 DAV is 513,700
|
$136.34
-4.74%
|
6/18/2012
|
$127.00
|
PP = $132.79
|
|
MB = $139.43
|
Most Recent Note - 7/13/2012 3:21:10 PM
Y - Halted its slide today at its 50 DMA line which defines important support to watch. The 6/29/12 gain above its pivot point was backed by only +32% above average volume, below the minimum threshold need to trigger a proper new (or add-on) technical buy signal.
>>> The latest Featured Stock Update with an annotated graph appeared on 6/18/2012. Click here.
View all notes |
Alert me of new notes |
CANSLIM.net Company Profile |
SEC |
Zacks Reports |
StockTalk |
News |
Chart |
Request a new note
C
A N
S L
I M
|
TNGO
-
NASDAQ
Tangoe Inc
COMPUTER SOFTWARE and SERVICES - Technical and System Software
|
$20.47
|
-0.21
-1.02% |
$20.85
|
182,081
34.31% of 50 DAV
50 DAV is 530,700
|
$23.05
-11.19%
|
6/27/2012
|
$21.70
|
PP = $23.15
|
|
MB = $24.31
|
Most Recent Note - 7/13/2012 3:22:34 PM
G - Trading up today on light volume, but still below its 50 DMA line following a streak of 6 consecutive losses on light volume. Gains back above that important short-term average are needed to help its outlook, and gains above the pivot point backed by +40% above average volume or greater could trigger a new technical buy signal.
>>> The latest Featured Stock Update with an annotated graph appeared on 6/28/2012. Click here.
View all notes |
Alert me of new notes |
CANSLIM.net Company Profile |
SEC |
Zacks Reports |
StockTalk |
News |
Chart |
Request a new note
C
A N
S L
I M
|
VSI
-
NYSE
Vitamin Shoppe Inc
SPECIALTY RETAIL - Specialty Retail, Other
|
$55.20
|
+0.18
0.33% |
$57.46
|
378,436
75.75% of 50 DAV
50 DAV is 499,600
|
$58.22
-5.19%
|
6/29/2012
|
$54.93
|
PP = $55.03
|
|
MB = $57.78
|
Most Recent Note - 7/16/2012 1:06:08 PM
Y - Slumping below its pivot point with today's loss. Recent gains helped it trade above the new pivot point based on its 6/22/12 high after forming an 8-week cup-with-handle base, but the gains have lacked the volume required to trigger a proper new (or add-on) technical buy signal.
>>> The latest Featured Stock Update with an annotated graph appeared on 7/2/2012. Click here.
View all notes |
Alert me of new notes |
CANSLIM.net Company Profile |
SEC |
Zacks Reports |
StockTalk |
News |
Chart |
Request a new note
C
A N
S L
I M
|
WFM
-
NASDAQ
Whole Foods Market Inc
RETAIL - Grocery Stores
|
$93.82
|
-0.04
-0.04% |
$94.61
|
1,250,464
67.52% of 50 DAV
50 DAV is 1,852,000
|
$97.25
-3.53%
|
6/13/2012
|
$89.90
|
PP = $91.60
|
|
MB = $96.18
|
Most Recent Note - 7/13/2012 5:46:20 PM
Y - Volume totals have been cooling while consolidating below its "max buy" level. Prior highs in the $91.50 area and its 50 DMA line define important support to watch where violations may trigger technical sell signals. See the latest FSU analysis for more details and a new annotated graph.
>>> The latest Featured Stock Update with an annotated graph appeared on 7/13/2012. Click here.
View all notes |
Alert me of new notes |
CANSLIM.net Company Profile |
SEC |
Zacks Reports |
StockTalk |
News |
Chart |
Request a new note
C
A N
S L
I M
|