You are not logged in.
This means you
CAN ONLY VIEW reports that were published prior to Monday, March 10, 2025.
You
MUST UPGRADE YOUR MEMBERSHIP if you want to see any current reports.
AFTER MARKET UPDATE - WEDNESDAY, JULY 18TH, 2012
Previous After Market Report Next After Market Report >>>
|
|
|
|
DOW |
+103.16 |
12,908.70 |
+0.81% |
|
Volume |
727,444,650 |
+4% |
|
Volume |
1,739,866,260 |
+2% |
|
NASDAQ |
+32.56 |
2,942.60 |
+1.12% |
|
Advancers |
1,889 |
60% |
|
Advancers |
1,476 |
57% |
|
S&P 500 |
+9.11 |
1,372.78 |
+0.67% |
|
Decliners |
1,129 |
36% |
|
Decliners |
981 |
38% |
|
Russell 2000 |
+5.61 |
805.06 |
+0.70% |
|
52 Wk Highs |
242 |
|
|
52 Wk Highs |
104 |
|
|
S&P 600 |
+3.59 |
449.85 |
+0.80% |
|
52 Wk Lows |
22 |
|
|
52 Wk Lows |
40 |
|
|
 |
Major Averages Traded Higher With Volume Again Picking Up
Kenneth J. Gruneisen - Passed the CAN SLIM® Master's Exam
On Wednesday stocks edged higher throughout the session as investors overlooked a lackluster report of the Fed's Beige Book and focused on positive corporate earnings. The volume totals were reported higher on the Nasdaq exchange and on the NYSE versus the prior session's volume totals, again hinting that institutional buying demand picked up its pace. Advancing issues led decliners by about a 3-2 margin on the NYSE and on the Nasdaq exchange. The total number of new 52-week highs led new 52-week lows on the NYSE and on the Nasdaq exchange. There were 69 high-ranked companies from the CANSLIM.net Leaders List made new 52-week highs and appeared on the CANSLIM.net BreakOuts Page, up from the prior session total of 67 stocks. At the session's close there were gains for 11 of the 17 high-ranked companies currently included on the Featured Stocks Page.
On the data front, housing starts accelerated in June, while building permits showed a modest decline. Eight of the 10 sectors on the S&P finished in the green, led by a rally in tech stocks. Shares of Intel Corp (INTC +3.37%) rose after the company reported a better-than-expected profit tally. Also in the space, International Business Machines Corporation (IBM +2.50%) was up. Financials were the worst performers, and Bank of America Corp (BAC -4.92%) and Bank of New York Mellon Corporation (BK -0.14%) edged lower after both firms posted their profit tallies but revenues fell short in their quarterly reports. Capital One Financial Corp (COF -1.68%) also weighed on the sector after the firm agreed to settle a credit card probe for $210 million.
Corporate earnings will also be a factor. Also among earnings, shares of Honeywell International Inc (HON +6.67%) rallied following their better-than-expected quarterly report. Yahoo (YHOO +0.64%) ended nearly flat as second-quarter revenues came in below analyst estimates. In other news, Vivus Inc (VVUS +9.60%) was in the green after the U.S. Food and Drug Administration approved their new weight-loss drug. Luxury retailer Tiffany (TIF +4.50%) advanced after receiving an analyst's upgrade.
Turning to fixed income, Treasuries are higher along the curve. The benchmark 10-year note was up 5/32 to yield 1.49% and the 30-year bond added 1/4 of a point to yield 2.60%.
The upward trend concerning the M criteria has come under recent pressure. However, new buying efforts may be justified in worthy buy candidates with strong fundamental and technical characteristics matching all key investment criteria. The best buy candidates identified by CANSLIM.net's experts are always viewable on the Featured Stocks page.
The Q2 2012 WEBCAST is available "ON DEMAND" - CLICK HERE. Upgraded members now get access to these informative *Quarterly Webcasts included at no additional cost. (*Previously sold separately at $99 per webcast.) Links to archived webcasts and all prior reports are on the Premium Member Homepage.
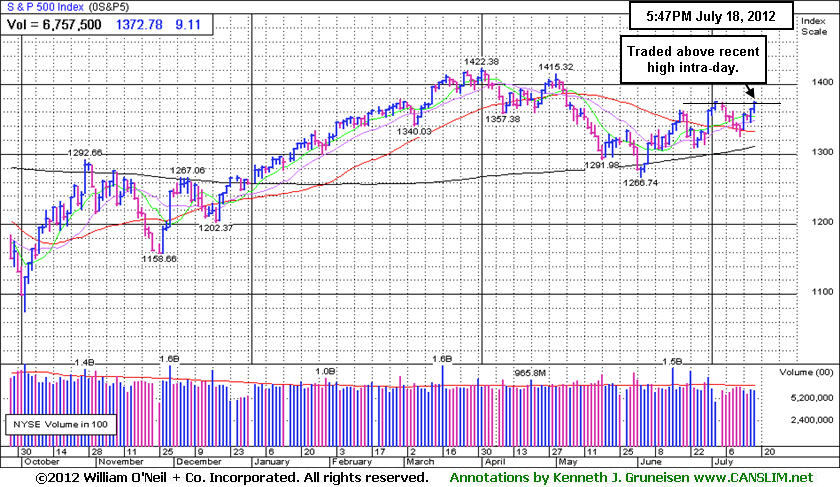
PICTURED: The S&P 500 Index recently found support while consolidating above its 50-day moving average (DMA) line, and during Wednesday's session it traded above its recent high.
|
 Kenneth J. Gruneisen started out as a licensed stockbroker in August 1987, a couple of months prior to the historic stock market crash that took the Dow Jones Industrial Average down -22.6% in a single day. He has published daily fact-based fundamental and technical analysis on high-ranked stocks online for two decades. Through FACTBASEDINVESTING.COM, Kenneth provides educational articles, news, market commentary, and other information regarding proven investment systems that work in good times and bad.
Comments contained in the body of this report are technical opinions only and are not necessarily those of Gruneisen Growth Corp. The material herein has been obtained from sources believed to be reliable and accurate, however, its accuracy and completeness cannot be guaranteed. Our firm, employees, and customers may effect transactions, including transactions contrary to any recommendation herein, or have positions in the securities mentioned herein or options with respect thereto. Any recommendation contained in this report may not be suitable for all investors and it is not to be deemed an offer or solicitation on our part with respect to the purchase or sale of any securities. |
|
 |
Semiconductor Index Led Tech Sector Rally
Kenneth J. Gruneisen - Passed the CAN SLIM® Master's Exam
The Gold & Silver Index ($XAU -1.21%) fell and financial groups were weaker as the Broker/Dealer Index ($XBD -1.76%) and Bank Index ($BKX -0.73%) backpedaled. Meanwhile, most groups were on the rise. The Retail Index ($RLX +0.59%) posted modest gains and strength in energy-related shares boosted the Integrated Oil Index ($XOI +0.71%) and the Oil Services Index ($OSX +1.35%). Medical-related shares had a positive bias as the Biotechnology Index ($BTK +0.72%) and the Healthcare Index ($HMO +1.30%) posted gains. The Internet Index ($IIX +2.08%) and Networking Index ($NWX +2.87%) enjoyed even larger gains as the tech sector's strength helped the Nasdaq Composite Index outpace its peers.
Charts courtesy www.stockcharts.com
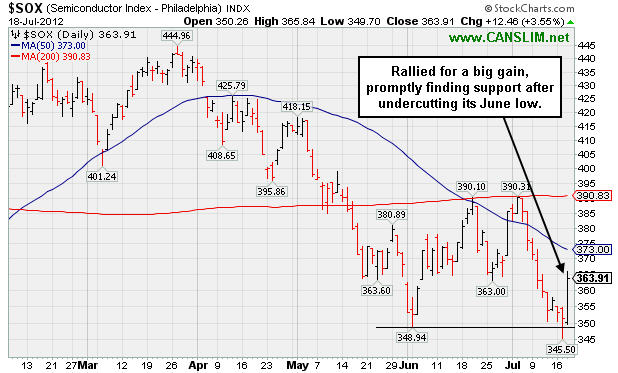
PICTURED: The Semiconductor Index ($SOX +3.55%) rallied for a big gain, promptly finding support after undercutting its June low.
| Oil Services |
$OSX |
211.78 |
+2.82 |
+1.35% |
-2.08% |
| Healthcare |
$HMO |
2,444.02 |
+31.42 |
+1.30% |
+7.12% |
| Integrated Oil |
$XOI |
1,199.14 |
+8.47 |
+0.71% |
-2.44% |
| Semiconductor |
$SOX |
363.91 |
+12.46 |
+3.55% |
-0.15% |
| Networking |
$NWX |
193.94 |
+5.42 |
+2.87% |
-9.86% |
| Internet |
$IIX |
294.60 |
+6.02 |
+2.08% |
+4.57% |
| Broker/Dealer |
$XBD |
84.46 |
-1.51 |
-1.76% |
+1.43% |
| Retail |
$RLX |
613.93 |
+3.62 |
+0.59% |
+17.34% |
| Gold & Silver |
$XAU |
146.30 |
-1.79 |
-1.21% |
-19.01% |
| Bank |
$BKX |
45.99 |
-0.34 |
-0.73% |
+16.79% |
| Biotech |
$BTK |
1,529.65 |
+10.91 |
+0.72% |
+40.15% |
|
|
|
 |
Found Support at 50-Day Average After Breakout Attempt Lacked Volume
Kenneth J. Gruneisen - Passed the CAN SLIM® Master's Exam
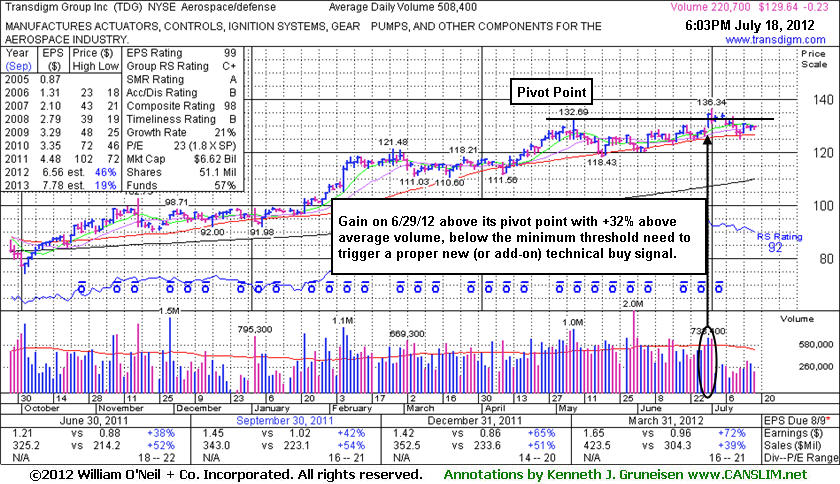
Transdigm Group Inc (TDG -$0.23 or -0.18% to $129.64) recently halted its slide at its 50-day moving average (DMA) line which defines important support to watch. The 6/29/12 gain above its pivot point was backed by only +32% above average volume, below the minimum threshold needed to trigger a proper new (or add-on) technical buy signal. The high-ranked Aerospace/Defense firm's last appearance in this FSU section was on 6/18/12 with an annotated graph under the headline, "New Pivot Point Cited After Orderly Consolidation". It remains perched within close striking distance of its all-time high. Its pivot point cited is based on its 5/08/12 high plus 10 cents. As previously noted - "Patient investors will watch to see signs of fresh institutional accumulation. Volume-driven gains above the pivot point may trigger a new (or add-on) technical buy signal."
The number of top-rated funds owning its share rose from 364 in Mar '11 to 439 in Mar '12, a reassuring trend concerning the I criteria. It reported earnings +72% on +39% sales revenues for the quarter ended March 31, 2012 versus the year ago period. That marked another increase in a streak of accelerating earnings comparisons above the +25% minimum guideline for earnings growth (solidly satisfying the C criteria). Its strong annual earnings history also satisfies the A criteria. In recent years it had rebounded and rallied to new highs following a deep consolidation after it was dropped from the Featured Stocks list 1/17/08. Members may review prior analysis via the "view all notes" link on any stocks highlighted in CANSLIM.net reports.
|
|
|
Color Codes Explained :
Y - Better candidates highlighted by our
staff of experts.
G - Previously featured
in past reports as yellow but may no longer be buyable under the
guidelines.
***Last / Change / Volume data in this table is the closing quote data***
Symbol/Exchange
Company Name
Industry Group |
PRICE |
CHANGE
(%Change) |
Day High |
Volume
(% DAV)
(% 50 day avg vol) |
52 Wk Hi
% From Hi |
Featured
Date |
Price
Featured |
Pivot Featured |
|
Max Buy |
ALXN
-
NASDAQ
Alexion Pharmaceuticals
DRUGS - Drug Manufacturers - Other
|
$100.11
|
+1.14
1.15% |
$100.35
|
1,292,582
58.55% of 50 DAV
50 DAV is 2,207,800
|
$104.38
-4.09%
|
5/1/2012
|
$91.73
|
PP = $95.11
|
|
MB = $99.87
|
Most Recent Note - 7/13/2012 3:38:53 PM
Y - Halted its slide this week above prior highs in the $95 area that define support to watch above its 50 DMA line.
>>> The latest Featured Stock Update with an annotated graph appeared on 6/29/2012. Click here.
View all notes |
Alert me of new notes |
CANSLIM.net Company Profile |
SEC |
Zacks Reports |
StockTalk |
News |
Chart |
Request a new note
C
A N
S L
I M


|
ASPS
-
NASDAQ
Altisource Ptf Sltns Sa
REAL ESTATE - Property Management/Developmen
|
$75.38
|
+0.79
1.06% |
$76.02
|
117,108
86.11% of 50 DAV
50 DAV is 136,000
|
$76.20
-1.07%
|
6/5/2012
|
$60.01
|
PP = $63.00
|
|
MB = $66.15
|
Most Recent Note - 7/13/2012 3:25:36 PM
G - Up today following a damaging loss with above average volume on the prior session. Prior highs in the $65 area and its 50 DMA line define near-term support to watch.
>>> The latest Featured Stock Update with an annotated graph appeared on 7/3/2012. Click here.
View all notes |
Alert me of new notes |
CANSLIM.net Company Profile |
SEC |
Zacks Reports |
StockTalk |
News |
Chart |
Request a new note
C
A N
S L
I M
|
CERN
-
NASDAQ
Cerner Corp
COMPUTER SOFTWARE and SERVICES - Healthcare Information Service
|
$78.56
|
+0.49
0.63% |
$79.29
|
1,018,827
70.84% of 50 DAV
50 DAV is 1,438,200
|
$88.32
-11.05%
|
6/7/2012
|
$78.36
|
PP = $84.20
|
|
MB = $88.41
|
Most Recent Note - 7/16/2012 1:12:35 PM
G - Slumping below its 50 DMA line today raising concerns, and prior lows in the $75-76 area define the next important chart support level. It has not formed a proper base since negating its prior breakout.
>>> The latest Featured Stock Update with an annotated graph appeared on 7/9/2012. Click here.
View all notes |
Alert me of new notes |
CANSLIM.net Company Profile |
SEC |
Zacks Reports |
StockTalk |
News |
Chart |
Request a new note
C
A N
S L
I M
|
CMCSA
-
NASDAQ
Comcast Corp Cl A
MEDIA - CATV Systems
|
$32.39
|
+0.06
0.19% |
$32.44
|
11,298,097
83.98% of 50 DAV
50 DAV is 13,454,000
|
$32.50
-0.34%
|
6/11/2012
|
$29.94
|
PP = $30.98
|
|
MB = $32.53
|
Most Recent Note - 7/13/2012 3:28:27 PM
Y - Trading up today after a loss with above average volume on the prior session. Still consolidating in a tight range near its 52-week high, holding ground above its pivot point. No overhead supply remains to act as resistance and it is still trading below its "max buy" level. See the latest FSU analysis for more details and a new annotated graph.
>>> The latest Featured Stock Update with an annotated graph appeared on 7/11/2012. Click here.
View all notes |
Alert me of new notes |
CANSLIM.net Company Profile |
SEC |
Zacks Reports |
StockTalk |
News |
Chart |
Request a new note
C
A N
S L
I M
|
CSTR
-
NASDAQ
Coinstar Inc
DIVERSIFIED SERVICES - Personal Services
|
$62.29
|
-0.27
-0.43% |
$63.31
|
1,068,937
99.70% of 50 DAV
50 DAV is 1,072,200
|
$71.82
-13.27%
|
6/26/2012
|
$64.05
|
PP = $67.00
|
|
MB = $70.35
|
Most Recent Note - 7/16/2012 5:43:57 PM
G - Closed below its 50 DMA line today with a 2nd consecutive damaging loss with above average volume triggering a technical sell signal. Completely negated its recent breakout and raised concerns while promptly slumping back into its prior base. Disciplined investors always limit losses by selling if any stock falls more than -7% from their purchase price.
>>> The latest Featured Stock Update with an annotated graph appeared on 6/26/2012. Click here.
View all notes |
Alert me of new notes |
CANSLIM.net Company Profile |
SEC |
Zacks Reports |
StockTalk |
News |
Chart |
Request a new note
C
A N
S L
I M
|
Symbol/Exchange
Company Name
Industry Group |
PRICE |
CHANGE
(%Change) |
Day High |
Volume
(% DAV)
(% 50 day avg vol) |
52 Wk Hi
% From Hi |
Featured
Date |
Price
Featured |
Pivot Featured |
|
Max Buy |
CTRX
-
NASDAQ
Catamaran Corp
COMPUTER SOFTWARE and SERVICES - Healthcare Information Service
|
$91.84
|
+0.75
0.82% |
$92.14
|
548,031
46.88% of 50 DAV
50 DAV is 1,169,000
|
$104.79
-12.36%
|
6/14/2012
|
$94.71
|
PP = $100.60
|
|
MB = $105.63
|
Most Recent Note - 7/17/2012 3:53:56 PM
G - Slumping below its 50 DMA line ($92.87) today with a loss on higher (near average) volume. Churned above average volume while not making headway above its pivot point, and recent "negative reversals" were noted as signs of distributional pressure. See the latest FSU analysis for more details and a new annotated graph.
>>> The latest Featured Stock Update with an annotated graph appeared on 7/16/2012. Click here.
View all notes |
Alert me of new notes |
CANSLIM.net Company Profile |
SEC |
Zacks Reports |
StockTalk |
News |
Chart |
Request a new note
C
A N
S L
I M
|
DG
-
NYSE
Dollar General Corp
RETAIL - Discount, Variety Stores
|
$53.74
|
-1.32
-2.40% |
$55.33
|
4,311,414
113.84% of 50 DAV
50 DAV is 3,787,100
|
$56.04
-4.10%
|
7/16/2012
|
$54.68
|
PP = $56.14
|
|
MB = $58.95
|
Most Recent Note - 7/16/2012 1:20:51 PM
Y - Volume totals have been cooling while recently hovering near its all-time high. Color code is changed to yellow after forming an advanced "3-weeks tight" base. Volume-driven gains above its new pivot point may trigger a new (or add-on) technical buy signal. Completed another Secondary Offering on 6/05/12, its 4th Secondary Offering since September '11.
>>> The latest Featured Stock Update with an annotated graph appeared on 7/12/2012. Click here.
View all notes |
Alert me of new notes |
CANSLIM.net Company Profile |
SEC |
Zacks Reports |
StockTalk |
News |
Chart |
Request a new note
C
A N
S L
I M
|
ECHO
-
NASDAQ
Echo Global Logistics
DIVERSIFIED SERVICES - Business/Management Services
|
$19.08
|
+0.11
0.58% |
$19.26
|
148,336
117.63% of 50 DAV
50 DAV is 126,100
|
$19.97
-4.46%
|
6/22/2012
|
$18.98
|
PP = $19.48
|
|
MB = $20.45
|
Most Recent Note - 7/17/2012 3:57:00 PM
Y - Down today on lighter volume after briefly trading above its pivot point and hitting a new 52-week high on the prior session, not quite triggering a proper technical buy signal under the fact-based system.
>>> The latest Featured Stock Update with an annotated graph appeared on 6/22/2012. Click here.
View all notes |
Alert me of new notes |
CANSLIM.net Company Profile |
SEC |
Zacks Reports |
StockTalk |
News |
Chart |
Request a new note
C
A N
S L
I M
|
EXPE
-
NASDAQ
Expedia Inc
INTERNET - Internet Information Providers
|
$46.55
|
+0.62
1.35% |
$46.80
|
2,860,561
75.55% of 50 DAV
50 DAV is 3,786,400
|
$50.66
-8.11%
|
4/27/2012
|
$41.80
|
PP = $35.57
|
|
MB = $37.35
|
Most Recent Note - 7/13/2012 3:18:25 PM
G - Rebounding above its 50 DMA line ($45.35 now) today, showing resilience after undercutting that important short-term average on the prior session. Prior highs in the $43 area define the next support level.
>>> The latest Featured Stock Update with an annotated graph appeared on 7/10/2012. Click here.
View all notes |
Alert me of new notes |
CANSLIM.net Company Profile |
SEC |
Zacks Reports |
StockTalk |
News |
Chart |
Request a new note
C
A N
S L
I M
|
GNC
-
NYSE
G N C Holdings Inc
RETAIL - Drug Stores
|
$38.44
|
-0.80
-2.04% |
$39.78
|
2,407,438
103.66% of 50 DAV
50 DAV is 2,322,400
|
$42.70
-9.98%
|
6/29/2012
|
$39.20
|
PP = $40.00
|
|
MB = $42.00
|
Most Recent Note - 7/16/2012 1:08:11 PM
Y - Still sputtering below its pivot point and trading near its 50 DMA line today following last week's distributional action. Disciplined investors always limit losses if any stock falls more than -7% from their purchase price.
>>> The latest Featured Stock Update with an annotated graph appeared on 7/5/2012. Click here.
View all notes |
Alert me of new notes |
CANSLIM.net Company Profile |
SEC |
Zacks Reports |
StockTalk |
News |
Chart |
Request a new note
C
A N
S L
I M
|
Symbol/Exchange
Company Name
Industry Group |
PRICE |
CHANGE
(%Change) |
Day High |
Volume
(% DAV)
(% 50 day avg vol) |
52 Wk Hi
% From Hi |
Featured
Date |
Price
Featured |
Pivot Featured |
|
Max Buy |
GPX
-
NYSE
G P Strategies Corp
DIVERSIFIED SERVICES - Education and Training Services
|
$17.99
|
+0.12
0.67% |
$18.33
|
41,516
73.48% of 50 DAV
50 DAV is 56,500
|
$18.99
-5.27%
|
6/29/2012
|
$18.01
|
PP = $18.15
|
|
MB = $19.06
|
Most Recent Note - 7/16/2012 1:09:52 PM
Y - Managed a "positive reversal" on 7/12/12, however recent losses completely negated the prior breakout and raised concerns. Disciplined investors always limit losses by selling any stock if it falls more than -7% from their purchase price.
>>> The latest Featured Stock Update with an annotated graph appeared on 7/6/2012. Click here.
View all notes |
Alert me of new notes |
CANSLIM.net Company Profile |
SEC |
Zacks Reports |
StockTalk |
News |
Chart |
Request a new note
C
A N
S L
I M
|
N
-
NYSE
Netsuite Inc
DIVERSIFIED SERVICES - Business/Management Services
|
$52.84
|
+3.34
6.75% |
$52.86
|
584,621
103.02% of 50 DAV
50 DAV is 567,500
|
$56.06
-5.74%
|
6/20/2012
|
$51.83
|
PP = $51.88
|
|
MB = $54.47
|
 Most Recent Note - 7/18/2012 1:15:49 PM
Y - Rebounding above its pivot point and back above previous chart highs with today's gain. Disciplined investors always limit losses by selling if any stock falls more than -7% from their purchase price.
>>> The latest Featured Stock Update with an annotated graph appeared on 6/20/2012. Click here.
View all notes |
Alert me of new notes |
CANSLIM.net Company Profile |
SEC |
Zacks Reports |
StockTalk |
News |
Chart |
Request a new note
C
A N
S L
I M
|
NSM
-
NYSE
Nationstar Mtg Hldgs Inc
FINANCIAL SERVICES - Credit Services
|
$24.54
|
-0.17
-0.69% |
$24.68
|
361,776
45.62% of 50 DAV
50 DAV is 793,000
|
$25.11
-2.27%
|
6/27/2012
|
$20.29
|
PP = $20.46
|
|
MB = $21.48
|
Most Recent Note - 7/16/2012 5:11:01 PM
G - Hovering at its 52-week high with volume totals cooling in the past week after getting extended from its prior base. Prior highs in the $20 area define important support to watch on pullbacks.
>>> The latest Featured Stock Update with an annotated graph appeared on 6/27/2012. Click here.
View all notes |
Alert me of new notes |
CANSLIM.net Company Profile |
SEC |
Zacks Reports |
StockTalk |
News |
Chart |
Request a new note
C
A N
S L
I M
|
TDG
-
NYSE
Transdigm Group Inc
AEROSPACE/DEFENSE - Aerospace/Defense Products and; Services
|
$129.64
|
-0.23
-0.18% |
$130.12
|
221,889
43.64% of 50 DAV
50 DAV is 508,400
|
$136.34
-4.91%
|
6/18/2012
|
$127.00
|
PP = $132.79
|
|
MB = $139.43
|
Most Recent Note - 7/18/2012 6:16:34 PM
Y - Found support at its 50 DMA line after a recent breakout attempt lacked volume conviction. See the latest FSU analysis for more details and a new annotated graph.
>>> The latest Featured Stock Update with an annotated graph appeared on 7/18/2012. Click here.
View all notes |
Alert me of new notes |
CANSLIM.net Company Profile |
SEC |
Zacks Reports |
StockTalk |
News |
Chart |
Request a new note
C
A N
S L
I M
|
TNGO
-
NASDAQ
Tangoe Inc
COMPUTER SOFTWARE and SERVICES - Technical and System Software
|
$21.89
|
+1.42
6.94% |
$21.93
|
494,410
94.84% of 50 DAV
50 DAV is 521,300
|
$23.05
-5.03%
|
6/27/2012
|
$21.70
|
PP = $23.15
|
|
MB = $24.31
|
Most Recent Note - 7/18/2012 1:18:17 PM
Y - Trading up today on light volume, and its color code is changed to yellow after rising back above its 50 DMA line helped its technical stance. Gains above the pivot point backed by +40% above average volume or greater could trigger a new technical buy signal.
>>> The latest Featured Stock Update with an annotated graph appeared on 6/28/2012. Click here.
View all notes |
Alert me of new notes |
CANSLIM.net Company Profile |
SEC |
Zacks Reports |
StockTalk |
News |
Chart |
Request a new note
C
A N
S L
I M
|
Symbol/Exchange
Company Name
Industry Group |
PRICE |
CHANGE
(%Change) |
Day High |
Volume
(% DAV)
(% 50 day avg vol) |
52 Wk Hi
% From Hi |
Featured
Date |
Price
Featured |
Pivot Featured |
|
Max Buy |
VSI
-
NYSE
Vitamin Shoppe Inc
SPECIALTY RETAIL - Specialty Retail, Other
|
$55.50
|
+0.30
0.54% |
$56.62
|
235,161
47.13% of 50 DAV
50 DAV is 499,000
|
$58.22
-4.67%
|
6/29/2012
|
$54.93
|
PP = $55.03
|
|
MB = $57.78
|
Most Recent Note - 7/16/2012 1:06:08 PM
Y - Slumping below its pivot point with today's loss. Recent gains helped it trade above the new pivot point based on its 6/22/12 high after forming an 8-week cup-with-handle base, but the gains have lacked the volume required to trigger a proper new (or add-on) technical buy signal.
>>> The latest Featured Stock Update with an annotated graph appeared on 7/2/2012. Click here.
View all notes |
Alert me of new notes |
CANSLIM.net Company Profile |
SEC |
Zacks Reports |
StockTalk |
News |
Chart |
Request a new note
C
A N
S L
I M
|
WFM
-
NASDAQ
Whole Foods Market Inc
RETAIL - Grocery Stores
|
$92.54
|
-1.28
-1.36% |
$93.77
|
1,332,172
73.04% of 50 DAV
50 DAV is 1,823,900
|
$97.25
-4.84%
|
6/13/2012
|
$89.90
|
PP = $91.60
|
|
MB = $96.18
|
Most Recent Note - 7/13/2012 5:46:20 PM
Y - Volume totals have been cooling while consolidating below its "max buy" level. Prior highs in the $91.50 area and its 50 DMA line define important support to watch where violations may trigger technical sell signals. See the latest FSU analysis for more details and a new annotated graph.
>>> The latest Featured Stock Update with an annotated graph appeared on 7/13/2012. Click here.
View all notes |
Alert me of new notes |
CANSLIM.net Company Profile |
SEC |
Zacks Reports |
StockTalk |
News |
Chart |
Request a new note
C
A N
S L
I M
|
|
|
|
THESE ARE NOT BUY RECOMMENDATIONS!
Comments contained in the body of this report are technical
opinions only. The material herein has been obtained
from sources believed to be reliable and accurate, however,
its accuracy and completeness cannot be guaranteed.
This site is not an investment advisor, hence it does
not endorse or recommend any securities or other investments.
Any recommendation contained in this report may not
be suitable for all investors and it is not to be deemed
an offer or solicitation on our part with respect to
the purchase or sale of any securities. All trademarks,
service marks and trade names appearing in this report
are the property of their respective owners, and are
likewise used for identification purposes only.
This report is a service available
only to active Paid Premium Members.
You may opt-out of receiving report notifications
at any time. Questions or comments may be submitted
by writing to Premium Membership Services 665 S.E. 10 Street, Suite 201 Deerfield Beach, FL 33441-5634 or by calling 1-800-965-8307
or 954-785-1121.
|
|
|

