You are not logged in.
This means you
CAN ONLY VIEW reports that were published prior to Monday, March 10, 2025.
You
MUST UPGRADE YOUR MEMBERSHIP if you want to see any current reports.
AFTER MARKET UPDATE - MONDAY, JULY 16TH, 2012
Previous After Market Report Next After Market Report >>>
|
|
|
|
DOW |
-49.88 |
12,727.21 |
-0.39% |
|
Volume |
602,068,060 |
-12% |
|
Volume |
1,399,073,690 |
+6% |
|
NASDAQ |
-11.53 |
2,896.94 |
-0.40% |
|
Advancers |
1,359 |
43% |
|
Advancers |
879 |
34% |
|
S&P 500 |
-3.14 |
1,353.64 |
-0.23% |
|
Decliners |
1,670 |
53% |
|
Decliners |
1,603 |
62% |
|
Russell 2000 |
-4.33 |
796.66 |
-0.54% |
|
52 Wk Highs |
207 |
|
|
52 Wk Highs |
70 |
|
|
S&P 600 |
-2.20 |
445.18 |
-0.49% |
|
52 Wk Lows |
32 |
|
|
52 Wk Lows |
39 |
|
|
 |
Major Averages Sputter After IMF Lowers Global Growth Forecast
Kenneth J. Gruneisen - Passed the CAN SLIM® Master's Exam
The major averages lost ground yet ended off of their session lows on Monday. The volume totals were reported mixed, lighter on the NYSE, yet higher on the Nasdaq exchange versus Friday's volume totals. Decliners led advancing issues by nearly 2-1 on the Nasdaq exchange while decliners led by a narrower 8-7 margin on the NYSE. The total number of new 52-week highs led new 52-week lows on the NYSE and on the Nasdaq exchange. There were 45 high-ranked companies from the CANSLIM.net Leaders List made new 52-week highs and appeared on the CANSLIM.net BreakOuts Page, versus the prior session total of 51 stocks. At the session's close there were gains for 5 of the 19 high-ranked companies currently included on the Featured Stocks Page.
Stocks were lower from the opening bell as concerns over a slowing economy were heightened by IMF lowering its global growth forecast to 3.9% from 4.1%, a disappointing downward revision. U.S. economic data came in with mixed results. June retail sales unexpectedly fell -0.5%, which overshadowed news that the Empire Manufacturing Index rose more than expected. In a separate report, May business inventories rose 0.3%, in-line with consensus projections.
Seven of the 10 sectors on the S&P finished in the red, led by weakness from industrial stocks including Caterpillar Inc (CAT -1.12%) and General Electric Co (GE -0.91%). On the earnings front, Citigroup Inc (C +0.60%) edged higher after the company posted a better-than-expected quarterly result. Also among earnings, Goldman Sachs (GS +0.26%) inched higher and Johnson & Johnson (JNJ -0.23%) edged lower ahead of their profit tallies scheduled before the market open on Tuesday.
Turning to fixed income, Treasuries were higher along the curve. The benchmark 10-year note advanced 7/32 to yield 1.47% and the 30-year bond gained 7/16 of a point to yield 2.56%.
The upward trend concerning the M criteria has come under recent pressure. However, new buying efforts may be justified in worthy buy candidates with strong fundamental and technical characteristics matching all key investment criteria. The best buy candidates identified by CANSLIM.net's experts are always viewable on the Featured Stocks page.
The Q2 2012 WEBCAST is available "ON DEMAND" - CLICK HERE. Upgraded members now get access to these informative *Quarterly Webcasts included at no additional cost. (*Previously sold separately at $99 per webcast.) Links to archived webcasts and all prior reports are on the Premium Member Homepage.
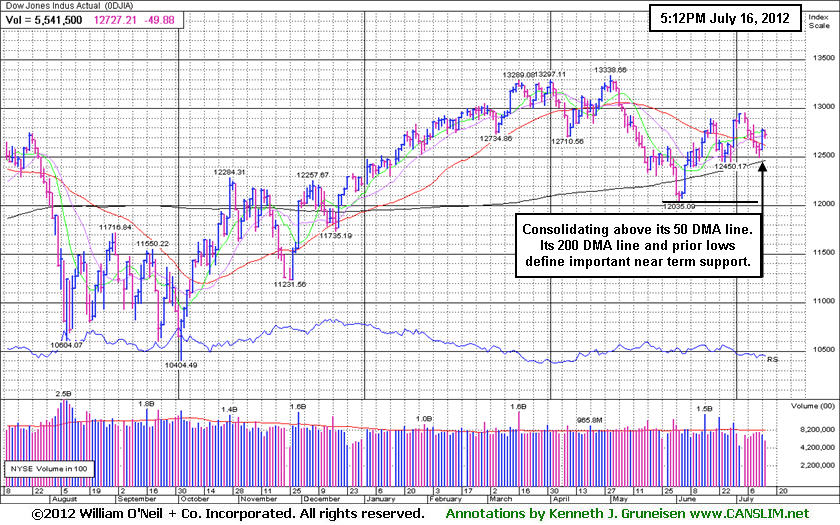
PICTURED: The Dow Jones Industrial Average is consolidating above its 50-day moving average (DMA) line. Its 200 DMA line and prior lows define near term support to watch. Deterioration below those levels would be a very worrisome sign and signal for investors to reduce market exposure and raise cash, meanwhile a rally above the recent high would be a reassuring sign the rally's strength is improving.
|
 Kenneth J. Gruneisen started out as a licensed stockbroker in August 1987, a couple of months prior to the historic stock market crash that took the Dow Jones Industrial Average down -22.6% in a single day. He has published daily fact-based fundamental and technical analysis on high-ranked stocks online for two decades. Through FACTBASEDINVESTING.COM, Kenneth provides educational articles, news, market commentary, and other information regarding proven investment systems that work in good times and bad.
Comments contained in the body of this report are technical opinions only and are not necessarily those of Gruneisen Growth Corp. The material herein has been obtained from sources believed to be reliable and accurate, however, its accuracy and completeness cannot be guaranteed. Our firm, employees, and customers may effect transactions, including transactions contrary to any recommendation herein, or have positions in the securities mentioned herein or options with respect thereto. Any recommendation contained in this report may not be suitable for all investors and it is not to be deemed an offer or solicitation on our part with respect to the purchase or sale of any securities. |
|
 |
Standout Gain Posted by Biotech Index
Kenneth J. Gruneisen - Passed the CAN SLIM® Master's Exam
The Networking Index ($NWX -1.85%), Semiconductor Index ($SOX -1.08%), and Internet Index ($IIX -0.77%) lost ground on Monday. The Bank Index ($BKX -0.13%) and Broker/Dealer Index ($XBD -0.06%) showed little direction, however the Retail Index ($RLX -0.55%) put a drag on the major averages. Defensive groups also drifted lower as the Healthcare Index ($HMO -0.90%) and Gold & Silver Index ($XAU -0.40%) lost ground. The Oil Services Index ($OSX -0.10%) edged lower while the Integrated Oil Index ($XOI +0.72%) posted a modest gain.
Charts courtesy www.stockcharts.com

PICTURED: The Biotechnology Index ($BTK +1.19%) was a standout gainer . It is perched near its 52-week high, trading above its 50-day moving average (DMA) line and an upward trendline.
| Oil Services |
$OSX |
206.38 |
-0.21 |
-0.10% |
-4.58% |
| Healthcare |
$HMO |
2,390.71 |
-21.83 |
-0.90% |
+4.78% |
| Integrated Oil |
$XOI |
1,180.48 |
+8.46 |
+0.72% |
-3.96% |
| Semiconductor |
$SOX |
353.15 |
-3.86 |
-1.08% |
-3.10% |
| Networking |
$NWX |
192.41 |
-3.62 |
-1.85% |
-10.58% |
| Internet |
$IIX |
288.28 |
-2.24 |
-0.77% |
+2.32% |
| Broker/Dealer |
$XBD |
85.75 |
-0.06 |
-0.07% |
+2.98% |
| Retail |
$RLX |
608.44 |
-3.36 |
-0.55% |
+16.29% |
| Gold & Silver |
$XAU |
149.62 |
-0.60 |
-0.40% |
-17.17% |
| Bank |
$BKX |
45.85 |
-0.06 |
-0.13% |
+16.43% |
| Biotech |
$BTK |
1,502.62 |
+17.62 |
+1.19% |
+37.67% |
|
|
|
 |
Negative Reversals Noted as Recent Signs of Distribution
Kenneth J. Gruneisen - Passed the CAN SLIM® Master's Exam
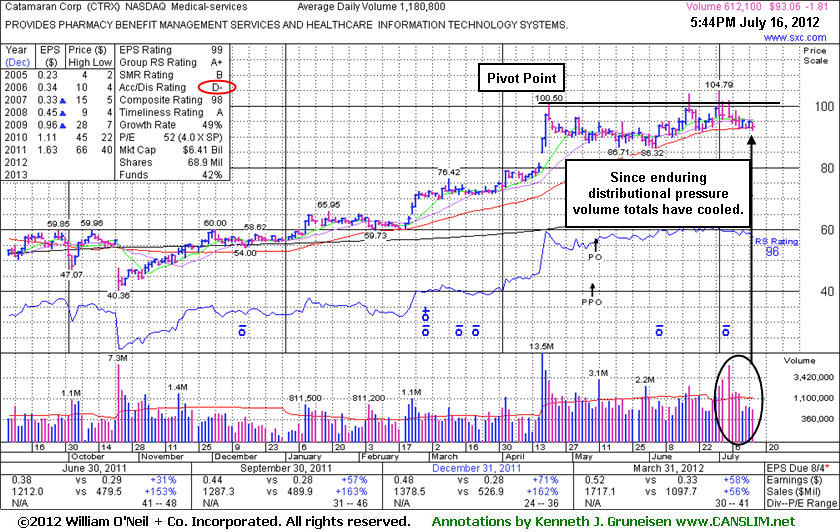
Catamaran Corp (CTRX -$1.81 or -1.91% to $93.06) has been finding support near its 50-day moving average (DMA) line. Since enduring distributional pressure its volume totals have been cooling. Further deterioration would be a disconcerting sign. It was noted repeatedly as it churned above average volume while not making headway above its pivot point, and recent "negative reversals" were noted as signs of distributional pressure. Without volume-driven gains into new high territory, what was once a promising looking set-up could become a worrisome "double top" pattern. A subsequent breakdown below prior lows in the $86 area would complete that bearish pattern and trigger a more worrisome technical sell signal.
SXC Health Solutions and Catalyst Health Solutions recently completed a previously noted merger and re-branded the company as Catamaran Corp. SXC's last appearance in this FSU section was on 6/14/12 with an annotated daily graph under the headline, "New Pivot Point Cited While Building Based During Market Correction". Its Accumulation/Distribution Rating was B then, but it has slumped to a D- (see red circle).
It completed a new Public Offering on 5/10/12. It reported earnings +58% on +56% sales revenues for the quarter ended March 31, 2012 versus the year ago period, continuing its streak of strong quarterly and good annual earnings increases which satisfy the C and A criteria. Ownership by top-rated funds rose from 573 in Sep '11 to 661 in Mar '12. Concerning the I criteria, that is a very favorable sign. It was first featured at $62.05 on 1/10/12 when highlighted in yellow in the mid-day report with an annotated daily graph (read here).
|
|
|
Color Codes Explained :
Y - Better candidates highlighted by our
staff of experts.
G - Previously featured
in past reports as yellow but may no longer be buyable under the
guidelines.
***Last / Change / Volume data in this table is the closing quote data***
Symbol/Exchange
Company Name
Industry Group |
PRICE |
CHANGE
(%Change) |
Day High |
Volume
(% DAV)
(% 50 day avg vol) |
52 Wk Hi
% From Hi |
Featured
Date |
Price
Featured |
Pivot Featured |
|
Max Buy |
ALXN
-
NASDAQ
Alexion Pharmaceuticals
DRUGS - Drug Manufacturers - Other
|
$97.50
|
+0.15
0.15% |
$98.34
|
976,198
44.03% of 50 DAV
50 DAV is 2,217,300
|
$104.38
-6.59%
|
5/1/2012
|
$91.73
|
PP = $95.11
|
|
MB = $99.87
|
Most Recent Note - 7/13/2012 3:38:53 PM
Y - Halted its slide this week above prior highs in the $95 area that define support to watch above its 50 DMA line.
>>> The latest Featured Stock Update with an annotated graph appeared on 6/29/2012. Click here.
View all notes |
Alert me of new notes |
CANSLIM.net Company Profile |
SEC |
Zacks Reports |
StockTalk |
News |
Chart |
Request a new note
C
A N
S L
I M


|
ASPS
-
NASDAQ
Altisource Ptf Sltns Sa
REAL ESTATE - Property Management/Developmen
|
$75.00
|
+1.14
1.54% |
$75.23
|
75,390
55.23% of 50 DAV
50 DAV is 136,500
|
$76.20
-1.57%
|
6/5/2012
|
$60.01
|
PP = $63.00
|
|
MB = $66.15
|
Most Recent Note - 7/13/2012 3:25:36 PM
G - Up today following a damaging loss with above average volume on the prior session. Prior highs in the $65 area and its 50 DMA line define near-term support to watch.
>>> The latest Featured Stock Update with an annotated graph appeared on 7/3/2012. Click here.
View all notes |
Alert me of new notes |
CANSLIM.net Company Profile |
SEC |
Zacks Reports |
StockTalk |
News |
Chart |
Request a new note
C
A N
S L
I M
|
CERN
-
NASDAQ
Cerner Corp
COMPUTER SOFTWARE and SERVICES - Healthcare Information Service
|
$77.59
|
-2.70
-3.36% |
$80.45
|
1,583,620
110.95% of 50 DAV
50 DAV is 1,427,300
|
$88.32
-12.15%
|
6/7/2012
|
$78.36
|
PP = $84.20
|
|
MB = $88.41
|
 Most Recent Note - 7/16/2012 1:12:35 PM
G - Slumping below its 50 DMA line today raising concerns, and prior lows in the $75-76 area define the next important chart support level. It has not formed a proper base since negating its prior breakout.
>>> The latest Featured Stock Update with an annotated graph appeared on 7/9/2012. Click here.
View all notes |
Alert me of new notes |
CANSLIM.net Company Profile |
SEC |
Zacks Reports |
StockTalk |
News |
Chart |
Request a new note
C
A N
S L
I M
|
CMCSA
-
NASDAQ
Comcast Corp Cl A
MEDIA - CATV Systems
|
$31.83
|
-0.04
-0.13% |
$31.86
|
10,001,001
73.67% of 50 DAV
50 DAV is 13,576,300
|
$32.50
-2.06%
|
6/11/2012
|
$29.94
|
PP = $30.98
|
|
MB = $32.53
|
Most Recent Note - 7/13/2012 3:28:27 PM
Y - Trading up today after a loss with above average volume on the prior session. Still consolidating in a tight range near its 52-week high, holding ground above its pivot point. No overhead supply remains to act as resistance and it is still trading below its "max buy" level. See the latest FSU analysis for more details and a new annotated graph.
>>> The latest Featured Stock Update with an annotated graph appeared on 7/11/2012. Click here.
View all notes |
Alert me of new notes |
CANSLIM.net Company Profile |
SEC |
Zacks Reports |
StockTalk |
News |
Chart |
Request a new note
C
A N
S L
I M
|
CSTR
-
NASDAQ
Coinstar Inc
DIVERSIFIED SERVICES - Personal Services
|
$62.59
|
-1.48
-2.31% |
$64.22
|
1,525,811
144.63% of 50 DAV
50 DAV is 1,055,000
|
$71.82
-12.85%
|
6/26/2012
|
$64.05
|
PP = $67.00
|
|
MB = $70.35
|
Most Recent Note - 7/16/2012 5:43:57 PM
G - Closed below its 50 DMA line today with a 2nd consecutive damaging loss with above average volume triggering a technical sell signal. Completely negated its recent breakout and raised concerns while promptly slumping back into its prior base. Disciplined investors always limit losses by selling if any stock falls more than -7% from their purchase price.
>>> The latest Featured Stock Update with an annotated graph appeared on 6/26/2012. Click here.
View all notes |
Alert me of new notes |
CANSLIM.net Company Profile |
SEC |
Zacks Reports |
StockTalk |
News |
Chart |
Request a new note
C
A N
S L
I M
|
Symbol/Exchange
Company Name
Industry Group |
PRICE |
CHANGE
(%Change) |
Day High |
Volume
(% DAV)
(% 50 day avg vol) |
52 Wk Hi
% From Hi |
Featured
Date |
Price
Featured |
Pivot Featured |
|
Max Buy |
CTRX
-
NASDAQ
Catamaran Corp
COMPUTER SOFTWARE and SERVICES - Healthcare Information Service
|
$93.06
|
-1.81
-1.91% |
$94.72
|
612,239
51.85% of 50 DAV
50 DAV is 1,180,800
|
$104.79
-11.19%
|
6/14/2012
|
$94.71
|
PP = $100.60
|
|
MB = $105.63
|
Most Recent Note - 7/16/2012 6:08:35 PM
G - Finished near its 50 DMA line ($92.83) today and its color code was changed to green. Churned above average volume while not making headway above its pivot point, and recent "negative reversals" were noted as signs of distributional pressure. See the latest FSU analysis for more details and a new annotated graph.
>>> The latest Featured Stock Update with an annotated graph appeared on 7/16/2012. Click here.
View all notes |
Alert me of new notes |
CANSLIM.net Company Profile |
SEC |
Zacks Reports |
StockTalk |
News |
Chart |
Request a new note
C
A N
S L
I M
|
DG
-
NYSE
Dollar General Corp
RETAIL - Discount, Variety Stores
|
$54.61
|
+0.08
0.15% |
$54.92
|
2,000,958
52.62% of 50 DAV
50 DAV is 3,802,500
|
$56.04
-2.55%
|
7/16/2012
|
$54.68
|
PP = $56.14
|
|
MB = $58.95
|
Most Recent Note - 7/16/2012 1:20:51 PM
Y - Volume totals have been cooling while recently hovering near its all-time high. Color code is changed to yellow after forming an advanced "3-weeks tight" base. Volume-driven gains above its new pivot point may trigger a new (or add-on) technical buy signal. Completed another Secondary Offering on 6/05/12, its 4th Secondary Offering since September '11.
>>> The latest Featured Stock Update with an annotated graph appeared on 7/12/2012. Click here.
View all notes |
Alert me of new notes |
CANSLIM.net Company Profile |
SEC |
Zacks Reports |
StockTalk |
News |
Chart |
Request a new note
C
A N
S L
I M
|
ECHO
-
NASDAQ
Echo Global Logistics
DIVERSIFIED SERVICES - Business/Management Services
|
$19.43
|
+0.14
0.73% |
$19.97
|
205,940
167.98% of 50 DAV
50 DAV is 122,600
|
$19.48
-0.26%
|
6/22/2012
|
$18.98
|
PP = $19.48
|
|
MB = $20.45
|
Most Recent Note - 7/16/2012 12:02:12 PM
Y - Gapped up today above its pivot point and hit a new 52-week high, however it has erased much of its early gain. Recent volume-driven gains were followed by a gap down on 7/03/12 with higher volume after not quite triggering a technical buy signal under the fact-based system.
>>> The latest Featured Stock Update with an annotated graph appeared on 6/22/2012. Click here.
View all notes |
Alert me of new notes |
CANSLIM.net Company Profile |
SEC |
Zacks Reports |
StockTalk |
News |
Chart |
Request a new note
C
A N
S L
I M
|
EXPE
-
NASDAQ
Expedia Inc
INTERNET - Internet Information Providers
|
$45.22
|
-0.45
-0.99% |
$45.80
|
2,686,449
69.41% of 50 DAV
50 DAV is 3,870,200
|
$50.66
-10.74%
|
4/27/2012
|
$41.80
|
PP = $35.57
|
|
MB = $37.35
|
Most Recent Note - 7/13/2012 3:18:25 PM
G - Rebounding above its 50 DMA line ($45.35 now) today, showing resilience after undercutting that important short-term average on the prior session. Prior highs in the $43 area define the next support level.
>>> The latest Featured Stock Update with an annotated graph appeared on 7/10/2012. Click here.
View all notes |
Alert me of new notes |
CANSLIM.net Company Profile |
SEC |
Zacks Reports |
StockTalk |
News |
Chart |
Request a new note
C
A N
S L
I M
|
GNC
-
NYSE
G N C Holdings Inc
RETAIL - Drug Stores
|
$38.79
|
-0.46
-1.17% |
$39.08
|
2,130,009
93.18% of 50 DAV
50 DAV is 2,286,000
|
$42.70
-9.16%
|
6/29/2012
|
$39.20
|
PP = $40.00
|
|
MB = $42.00
|
Most Recent Note - 7/16/2012 1:08:11 PM
Y - Still sputtering below its pivot point and trading near its 50 DMA line today following last week's distributional action. Disciplined investors always limit losses if any stock falls more than -7% from their purchase price.
>>> The latest Featured Stock Update with an annotated graph appeared on 7/5/2012. Click here.
View all notes |
Alert me of new notes |
CANSLIM.net Company Profile |
SEC |
Zacks Reports |
StockTalk |
News |
Chart |
Request a new note
C
A N
S L
I M
|
Symbol/Exchange
Company Name
Industry Group |
PRICE |
CHANGE
(%Change) |
Day High |
Volume
(% DAV)
(% 50 day avg vol) |
52 Wk Hi
% From Hi |
Featured
Date |
Price
Featured |
Pivot Featured |
|
Max Buy |
GPX
-
NYSE
G P Strategies Corp
DIVERSIFIED SERVICES - Education and Training Services
|
$17.75
|
-0.10
-0.56% |
$17.96
|
25,790
45.25% of 50 DAV
50 DAV is 57,000
|
$18.99
-6.53%
|
6/29/2012
|
$18.01
|
PP = $18.15
|
|
MB = $19.06
|
Most Recent Note - 7/16/2012 1:09:52 PM
Y - Managed a "positive reversal" on 7/12/12, however recent losses completely negated the prior breakout and raised concerns. Disciplined investors always limit losses by selling any stock if it falls more than -7% from their purchase price.
>>> The latest Featured Stock Update with an annotated graph appeared on 7/6/2012. Click here.
View all notes |
Alert me of new notes |
CANSLIM.net Company Profile |
SEC |
Zacks Reports |
StockTalk |
News |
Chart |
Request a new note
C
A N
S L
I M
|
MLNX
-
NASDAQ
Mellanox Technologies
ELECTRONICS - Semiconductor - Broad Line
|
$65.85
|
-0.22
-0.33% |
$67.45
|
898,661
143.42% of 50 DAV
50 DAV is 626,600
|
$77.69
-15.24%
|
6/18/2012
|
$70.90
|
PP = $67.30
|
|
MB = $70.67
|
Most Recent Note - 7/16/2012 12:24:01 PM
G - Distributional action raised some concerns as it recently undercut its pivot point, and today it is still testing support at its 50 DMA line. A damaging violation of that important short-term average would trigger a more worrisome technical sell signal.
>>> The latest Featured Stock Update with an annotated graph appeared on 6/25/2012. Click here.
View all notes |
Alert me of new notes |
CANSLIM.net Company Profile |
SEC |
Zacks Reports |
StockTalk |
News |
Chart |
Request a new note
C
A N
S L
I M
|
N
-
NYSE
Netsuite Inc
DIVERSIFIED SERVICES - Business/Management Services
|
$49.93
|
-0.52
-1.03% |
$50.33
|
432,864
77.02% of 50 DAV
50 DAV is 562,000
|
$56.06
-10.93%
|
6/20/2012
|
$51.83
|
PP = $51.88
|
|
MB = $54.47
|
Most Recent Note - 7/13/2012 3:30:50 PM
Y - Halted its slide above its 50 DMA line after damaging distributional losses this week undercut its pivot point and negated its recent breakout. Disciplined investors always limit losses by selling if any stock falls more than -7% from their purchase price.
>>> The latest Featured Stock Update with an annotated graph appeared on 6/20/2012. Click here.
View all notes |
Alert me of new notes |
CANSLIM.net Company Profile |
SEC |
Zacks Reports |
StockTalk |
News |
Chart |
Request a new note
C
A N
S L
I M
|
NSM
-
NYSE
Nationstar Mtg Hldgs Inc
FINANCIAL SERVICES - Credit Services
|
$24.40
|
-0.38
-1.53% |
$25.11
|
567,775
70.87% of 50 DAV
50 DAV is 801,200
|
$24.96
-2.24%
|
6/27/2012
|
$20.29
|
PP = $20.46
|
|
MB = $21.48
|
Most Recent Note - 7/16/2012 5:11:01 PM
G - Hovering at its 52-week high with volume totals cooling in the past week after getting extended from its prior base. Prior highs in the $20 area define important support to watch on pullbacks.
>>> The latest Featured Stock Update with an annotated graph appeared on 6/27/2012. Click here.
View all notes |
Alert me of new notes |
CANSLIM.net Company Profile |
SEC |
Zacks Reports |
StockTalk |
News |
Chart |
Request a new note
C
A N
S L
I M
|
NTES
-
NASDAQ
Netease Inc Adr
INTERNET - Internet Information Providers
|
$56.75
|
-0.48
-0.84% |
$57.97
|
281,869
38.78% of 50 DAV
50 DAV is 726,900
|
$65.54
-13.41%
|
3/19/2012
|
$56.18
|
PP = $55.10
|
|
MB = $57.86
|
Most Recent Note - 7/13/2012 3:36:33 PM
G - Holding its ground today above prior lows in the $55 area, but further deterioration would raise more serious concerns. Gains above its 50 DMA line would improve its technical stance, meanwhile it faces overhead supply that may act as resistance up through the $65 area.
>>> The latest Featured Stock Update with an annotated graph appeared on 6/19/2012. Click here.
View all notes |
Alert me of new notes |
CANSLIM.net Company Profile |
SEC |
Zacks Reports |
StockTalk |
News |
Chart |
Request a new note
C
A N
S L
I M
|
Symbol/Exchange
Company Name
Industry Group |
PRICE |
CHANGE
(%Change) |
Day High |
Volume
(% DAV)
(% 50 day avg vol) |
52 Wk Hi
% From Hi |
Featured
Date |
Price
Featured |
Pivot Featured |
|
Max Buy |
TDG
-
NYSE
Transdigm Group Inc
AEROSPACE/DEFENSE - Aerospace/Defense Products and; Services
|
$129.65
|
-1.18
-0.90% |
$130.25
|
322,216
61.88% of 50 DAV
50 DAV is 520,700
|
$136.34
-4.91%
|
6/18/2012
|
$127.00
|
PP = $132.79
|
|
MB = $139.43
|
Most Recent Note - 7/13/2012 3:21:10 PM
Y - Halted its slide today at its 50 DMA line which defines important support to watch. The 6/29/12 gain above its pivot point was backed by only +32% above average volume, below the minimum threshold need to trigger a proper new (or add-on) technical buy signal.
>>> The latest Featured Stock Update with an annotated graph appeared on 6/18/2012. Click here.
View all notes |
Alert me of new notes |
CANSLIM.net Company Profile |
SEC |
Zacks Reports |
StockTalk |
News |
Chart |
Request a new note
C
A N
S L
I M
|
TNGO
-
NASDAQ
Tangoe Inc
COMPUTER SOFTWARE and SERVICES - Technical and System Software
|
$20.68
|
+0.21
1.03% |
$20.83
|
223,037
41.76% of 50 DAV
50 DAV is 534,100
|
$23.05
-10.28%
|
6/27/2012
|
$21.70
|
PP = $23.15
|
|
MB = $24.31
|
Most Recent Note - 7/13/2012 3:22:34 PM
G - Trading up today on light volume, but still below its 50 DMA line following a streak of 6 consecutive losses on light volume. Gains back above that important short-term average are needed to help its outlook, and gains above the pivot point backed by +40% above average volume or greater could trigger a new technical buy signal.
>>> The latest Featured Stock Update with an annotated graph appeared on 6/28/2012. Click here.
View all notes |
Alert me of new notes |
CANSLIM.net Company Profile |
SEC |
Zacks Reports |
StockTalk |
News |
Chart |
Request a new note
C
A N
S L
I M
|
VSI
-
NYSE
Vitamin Shoppe Inc
SPECIALTY RETAIL - Specialty Retail, Other
|
$55.02
|
-1.14
-2.03% |
$56.07
|
196,684
39.27% of 50 DAV
50 DAV is 500,800
|
$58.22
-5.50%
|
6/29/2012
|
$54.93
|
PP = $55.03
|
|
MB = $57.78
|
Most Recent Note - 7/16/2012 1:06:08 PM
Y - Slumping below its pivot point with today's loss. Recent gains helped it trade above the new pivot point based on its 6/22/12 high after forming an 8-week cup-with-handle base, but the gains have lacked the volume required to trigger a proper new (or add-on) technical buy signal.
>>> The latest Featured Stock Update with an annotated graph appeared on 7/2/2012. Click here.
View all notes |
Alert me of new notes |
CANSLIM.net Company Profile |
SEC |
Zacks Reports |
StockTalk |
News |
Chart |
Request a new note
C
A N
S L
I M
|
WFM
-
NASDAQ
Whole Foods Market Inc
RETAIL - Grocery Stores
|
$93.86
|
-0.91
-0.96% |
$95.12
|
826,493
41.65% of 50 DAV
50 DAV is 1,984,600
|
$97.25
-3.49%
|
6/13/2012
|
$89.90
|
PP = $91.60
|
|
MB = $96.18
|
Most Recent Note - 7/13/2012 5:46:20 PM
Y - Volume totals have been cooling while consolidating below its "max buy" level. Prior highs in the $91.50 area and its 50 DMA line define important support to watch where violations may trigger technical sell signals. See the latest FSU analysis for more details and a new annotated graph.
>>> The latest Featured Stock Update with an annotated graph appeared on 7/13/2012. Click here.
View all notes |
Alert me of new notes |
CANSLIM.net Company Profile |
SEC |
Zacks Reports |
StockTalk |
News |
Chart |
Request a new note
C
A N
S L
I M
|
|
|
|
THESE ARE NOT BUY RECOMMENDATIONS!
Comments contained in the body of this report are technical
opinions only. The material herein has been obtained
from sources believed to be reliable and accurate, however,
its accuracy and completeness cannot be guaranteed.
This site is not an investment advisor, hence it does
not endorse or recommend any securities or other investments.
Any recommendation contained in this report may not
be suitable for all investors and it is not to be deemed
an offer or solicitation on our part with respect to
the purchase or sale of any securities. All trademarks,
service marks and trade names appearing in this report
are the property of their respective owners, and are
likewise used for identification purposes only.
This report is a service available
only to active Paid Premium Members.
You may opt-out of receiving report notifications
at any time. Questions or comments may be submitted
by writing to Premium Membership Services 665 S.E. 10 Street, Suite 201 Deerfield Beach, FL 33441-5634 or by calling 1-800-965-8307
or 954-785-1121.
|
|
|

