You are not logged in.
This means you
CAN ONLY VIEW reports that were published prior to Monday, February 26, 2024.
You
MUST UPGRADE YOUR MEMBERSHIP if you want to see any current reports.
AFTER MARKET UPDATE - FRIDAY, JULY 10TH, 2020
Previous After Market Report Next After Market Report >>>
|
|
|
|
DOW |
+369.21 |
26,075.30 |
+1.44% |
|
Volume |
875,773,656 |
-10% |
|
Volume |
3,489,858,700 |
-12% |
|
NASDAQ |
+73.95 |
10,621.70 |
+0.70% |
|
Advancers |
2,237 |
76% |
|
Advancers |
1,998 |
63% |
|
S&P 500 |
+32.99 |
3,185.04 |
+1.05% |
|
Decliners |
703 |
24% |
|
Decliners |
1,188 |
37% |
|
Russell 2000 |
+23.76 |
1,422.68 |
+1.70% |
|
52 Wk Highs |
74 |
|
|
52 Wk Highs |
124 |
|
|
S&P 600 |
+17.51 |
817.37 |
+2.19% |
|
52 Wk Lows |
8 |
|
|
52 Wk Lows |
16 |
|
|
 |
Breadth Positive as Major Indices Rose
Kenneth J. Gruneisen - Passed the CAN SLIM® Master's Exam
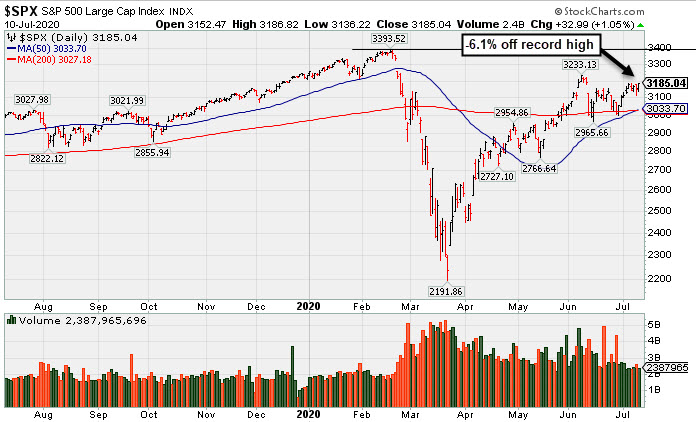
The Dow advanced 369 points, ending the week with a 1.0% gain. The S&P 500 rose 1.1%, and finished with a weekly advance of 1.8%. The Nasdaq Composite added 0.7% for its fourth record closing high this week, and extended its weekly gain to 4.0%. Breadth was positive as advancers led decliners by more than a 3-1 margin on the NYSE and 5-3 on the Nasdaq exchange. The reported volume totals were lighter than the prior session on the NYSE and on the Nasdaq exchange. There were 49 high-ranked companies from the Leaders List that hit new 52-week highs and were listed on the BreakOuts Page, versus the total of 95 on the prior session. New 52-week highs totals contracted yet solidly outnumbered new 52-week lows totals on both exchanges. The major indices are in a confirmed uptrend (M criteria). Any sustainable rally requires a healthy crop of new leaders, so it remains ever-important to see substantial new highs totals.Charts used courtesy of www.stockcharts.com
PICTURED: The S&P 500 Index is -6.1% of its record high and -1.4% year-to-date.
U.S. equities finished higher Friday, amid promising drug developments for the novel coronavirus reviving hopes for a swift economic recovery. Gilead Sciences (GILD +2.15%) said its coronavirus treatment drug, Remdesivir, reduced the risk of mortality by 62% compared to standard care, while BioNTech (BNTX +7.24%) stated its vaccine could be ready for approval by December.
Nine of 11 S&P 500 sectors ended the day in positive territory, as Financial and Energy stocks gained more than 3.0%. Travel-related stocks also outperformed, with Carnival Corp (CCL -10.84%) and American Airlines(AAL +6.80%) rallying. In other corporate news, Tesla (TSLA +10.78%) rose amid speculation the company is on the verge of joining the S&P 500 with analysts expecting the electric car maker to report a profit for the fourth consecutive quarter, an index requirement. Meanwhile, Netflix (NFLX +8.07%) rose after a Goldman Sachs analyst raised his 12-month price target to a street high $670/share.
On the data front, the producer price index unexpectedly fell 0.2% in June. Core PPI (excluding food and energy) advanced just 0.1% year-over-year, down from May’s 0.3% reading. Treasuries weakened, with the yield on the 10-year increasing by two basis points to 0.63%. In commodities, WTI crude jumped 2.3% to $40.50/barrel, only to end the week little changed.
|
 Kenneth J. Gruneisen started out as a licensed stockbroker in August 1987, a couple of months prior to the historic stock market crash that took the Dow Jones Industrial Average down -22.6% in a single day. He has published daily fact-based fundamental and technical analysis on high-ranked stocks online for two decades. Through FACTBASEDINVESTING.COM, Kenneth provides educational articles, news, market commentary, and other information regarding proven investment systems that work in good times and bad.
Comments contained in the body of this report are technical opinions only and are not necessarily those of Gruneisen Growth Corp. The material herein has been obtained from sources believed to be reliable and accurate, however, its accuracy and completeness cannot be guaranteed. Our firm, employees, and customers may effect transactions, including transactions contrary to any recommendation herein, or have positions in the securities mentioned herein or options with respect thereto. Any recommendation contained in this report may not be suitable for all investors and it is not to be deemed an offer or solicitation on our part with respect to the purchase or sale of any securities. |
|
 |
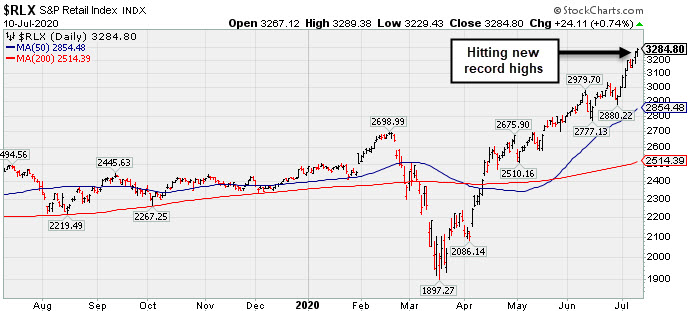
Financial and Energy-Linked Groups Led Gainers
Kenneth J. Gruneisen - Passed the CAN SLIM® Master's Exam
The Bank ($BKX +5.28%) and Broker/Dealer ($XBD +3.12%) posted solid gains that helped underpin the major indices while the Retail ($RLX +0.74%) posted a smaller gain. Energy-linked groups were standout gainers as the Oil Services ($OSX +2.79%) and Integrated Oil ($XOI +3.07%) both posted solid gains. The tech sector had a slightly negative bias as the Semiconductor ($SOX -0.31%), Networking ($NWX -0.58%), and the Biotech ($BTK -0.68%) each edged lower. The Gold & Silver ($XAU -0.48%) also edged lower.
PICTURED: The Retail ($RLX +0.74%) hit another new record high.
| Oil Services |
$OSX |
32.10 |
+0.87 |
+2.79% |
-59.00% |
| Integrated Oil |
$XOI |
737.39 |
+21.99 |
+3.07% |
-41.96% |
| Semiconductor |
$SOX |
2,070.28 |
-6.44 |
-0.31% |
+11.93% |
| Networking |
$NWX |
546.75 |
-3.21 |
-0.58% |
-6.28% |
| Broker/Dealer |
$XBD |
279.25 |
+8.44 |
+3.12% |
-3.83% |
| Retail |
$RLX |
3,284.80 |
+24.11 |
+0.74% |
+34.11% |
| Gold & Silver |
$XAU |
135.90 |
-0.65 |
-0.48% |
+27.10% |
| Bank |
$BKX |
73.33 |
+3.68 |
+5.28% |
-35.31% |
| Biotech |
$BTK |
5,905.41 |
-40.44 |
-0.68% |
+16.54% |
|
|
|
 |
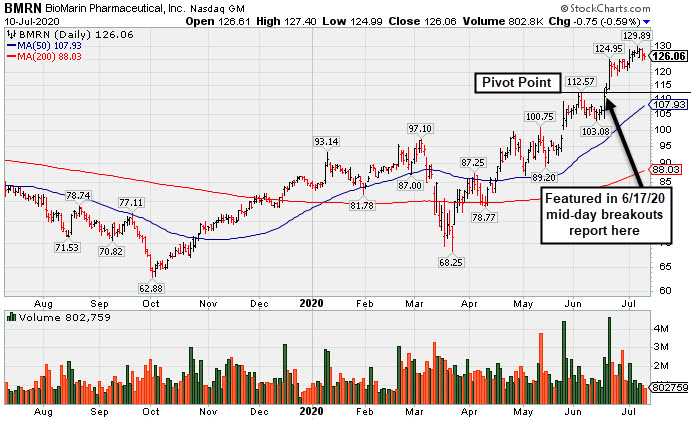
Hovering Near High With Volume Totals Cooling
Kenneth J. Gruneisen - Passed the CAN SLIM® Master's Exam
Biomarin Pharmaceutical (BMRN -$0.75 or -0.59% to $126.06) is hovering near its all-time high with volume totals cooling after a streak of 5 consecutive gains. It is very extended from any sound base. It stubbornly held its ground after a streak of gains for new highs marked by heavy volume. The prior high ($112.57) defines initial support to watch above its 50-day moving average (DMA) line ($107.92) on pullbacks.
BMRN was highlighted in the 6/17/20 mid-day report in yellow with pivot point cited based on its 6/04/20 high after forming an advanced "3-weeks tight" base pattern (read here). It was last shown in this FSU section on 6/17/20 with an annotated graph under the headline "Hit New 52-Week High But Closed Below Pivot After 3-Weeks Tight". At the time it hit a new 52-week high with a 4th consecutive gain backed by +55% above average volume, however it retreated and finished the session below the pivot point. Subsequent gains above the pivot point backed by well above average volume helped clinch a convincing technical buy signal.
It has an Earnings Per Share Rating that is 99, the highest possible rank. It reported strong earnings up +343% on +25% sales revenues for the Mar '20 quarter versus the year ago period and recent quarterly comparisons showed solidly improved earnings increases with strong underlying sales revenues growth. Since turning profitable in FY '17 its annual earnings (A criteria) history has been strong.
The company hails from the Medical - Biomed/Biotech industry group which is currently ranked 12th of the 197 Industry Groups ( L criteria). It has a Timeliness Rating of A and a Sponsorship rating of B. The number of top-rated funds owning its shares rose from 1,086 in Jun '19 to 1,174 in Jun '20, a reassuring sign concerning the I criteria. Its current Up/Down Volume Ratio of 1.8 is an unbiased indication its shares have been under accumulation over the past 50 days. It has 180.8 million shares outstanding (S criteria). |
|
|
Color Codes Explained :
Y - Better candidates highlighted by our
staff of experts.
G - Previously featured
in past reports as yellow but may no longer be buyable under the
guidelines.
***Last / Change / Volume data in this table is the closing quote data***
Symbol/Exchange
Company Name
Industry Group |
PRICE |
CHANGE
(%Change) |
Day High |
Volume
(% DAV)
(% 50 day avg vol) |
52 Wk Hi
% From Hi |
Featured
Date |
Price
Featured |
Pivot Featured |
|
Max Buy |
 FTNT
-
NASDAQ
FTNT
-
NASDAQ
Fortinet Inc
Computer Sftwr-Security
|
$145.80
|
-3.80
-2.54% |
$150.97
|
1,394,131
81.53% of 50 DAV
50 DAV is 1,710,000
|
$151.95
-4.05%
|
6/22/2020
|
$142.68
|
PP = $149.79
|
|
MB = $157.28
|
Most Recent Note - 7/9/2020 5:51:35 PM
Y - Hit a new high with today's solid gain backed by +55% above average volume however it finished the session just below the pivot point. Found prompt support at its 50 DMA line ($135) and above the prior low ($126.88 on 6/15/20) during the recent consolidation. Gains and a strong close above the pivot point backed by at least +40% above average volume are needed to clinch a convincing new (or add-on) technical buy signal. See the latest FSU analysis for more details and an annotated graph.
>>> FEATURED STOCK ARTICLE : Best Ever Close With Volume-Driven Gain Approaching Pivot Point - 7/8/2020 |
View all notes |
Set NEW NOTE alert |
Company Profile |
SEC
News |
Chart |
Request a new note
C
A
S
I |
EBS
-
NYSE
Emergent Biosolutions
DRUGS - Biotechnology
|
$94.23
|
-0.25
-0.26% |
$94.98
|
527,372
82.15% of 50 DAV
50 DAV is 642,000
|
$96.52
-2.37%
|
7/7/2020
|
$89.47
|
PP = $93.68
|
|
MB = $98.36
|
Most Recent Note - 7/9/2020 7:16:05 PM
Y - Hit a new all-time high with today's 7th consecutive gain. Color code was changed to yellow with a new pivot point cited based on its 6/01/20 high plus 10 cents. Recent gains above the 50 DMA line helped its outlook improve. No resistance remains due to overhead supply. Fundamentals remain strong. See the latest FSU analysis for more details and a new annotated graph.
>>> FEATURED STOCK ARTICLE : Impressive Rebound to Hit a New High - 7/9/2020 |
View all notes |
Set NEW NOTE alert |
Company Profile |
SEC
News |
Chart |
Request a new note
C
A
S
I |
NBIX
-
NASDAQ
Neurocrine Biosciences
DRUGS - Biotechnology
|
$129.69
|
-1.87
-1.42% |
$131.83
|
902,440
99.94% of 50 DAV
50 DAV is 903,000
|
$136.27
-4.83%
|
5/19/2020
|
$123.71
|
PP = $119.75
|
|
MB = $125.74
|
Most Recent Note - 7/9/2020 12:55:05 PM
G - Backed off from earlier highs after hitting a new all-time high with today's 4th consecutive gain. Prior highs in the $119 area define important near-term support to watch along with its 50 DMA line ($118.52). Fundamentals remain strong.
>>> FEATURED STOCK ARTICLE : Pulled Back Below "Max Buy" Level With Loss on Average Volume - 6/30/2020 |
View all notes |
Set NEW NOTE alert |
Company Profile |
SEC
News |
Chart |
Request a new note
C
A
S
I |
BMRN
-
NASDAQ
Biomarin Pharmaceutical
DRUGS - Drug Manufacturers - Other
|
$126.06
|
-0.75
-0.59% |
$127.41
|
802,759
48.18% of 50 DAV
50 DAV is 1,666,000
|
$129.89
-2.95%
|
6/17/2020
|
$110.95
|
PP = $112.67
|
|
MB = $118.30
|
 Most Recent Note - 7/10/2020 5:48:50 PM
G - Volume totals are cooling while hovering near its all-time high, very extended from any sound base after a streak of gains for new highs. Fundamentals remain strong. Prior high ($112.57) and its 50 DMA line ($108) define near-term support to watch on pullbacks. See the latest FSU analysis for more details and a new annotated graph.
>>> FEATURED STOCK ARTICLE : Hovering Near High With Volume Totals Cooling - 7/10/2020 |
View all notes |
Set NEW NOTE alert |
Company Profile |
SEC
News |
Chart |
Request a new note
C
A
S
I |
AMD
-
NASDAQ
Advanced Micro Devices
ELECTRONICS - Semiconductor - Broad Line
|
$55.88
|
-1.38
-2.40% |
$58.15
|
59,714,734
106.73% of 50 DAV
50 DAV is 55,949,000
|
$59.27
-5.72%
|
6/9/2020
|
$55.41
|
PP = $56.98
|
|
MB = $59.83
|
Most Recent Note - 7/10/2020 12:13:57 PM
Y - Rebounded above its 50 DMA line ($53.55) on the prior session with a big gain backed by +55% above average volume helping its outlook to improve. Previously met stubborn resistance in the $57-59 area. Subsequent gains above the pivot point backed by at least +40% above average volume may trigger a technical buy signal.
>>> FEATURED STOCK ARTICLE : Slump Below 50-Day Average Toward Prior Low Raises Concerns - 6/26/2020 |
View all notes |
Set NEW NOTE alert |
Company Profile |
SEC
News |
Chart |
Request a new note
C
A
S
I |
Symbol/Exchange
Company Name
Industry Group |
PRICE |
CHANGE
(%Change) |
Day High |
Volume
(% DAV)
(% 50 day avg vol) |
52 Wk Hi
% From Hi |
Featured
Date |
Price
Featured |
Pivot Featured |
|
Max Buy |
TREX
-
NYSE
Trex Company Inc
MATERIALS and CONSTRUCTION - General Building Materials
|
$124.25
|
-5.03
-3.89% |
$130.67
|
1,533,878
141.89% of 50 DAV
50 DAV is 1,081,000
|
$135.32
-8.18%
|
6/26/2020
|
$109.05
|
PP = $132.94
|
|
MB = $139.59
|
Most Recent Note - 7/10/2020 12:58:37 PM
Y - Pulling back today. Hit a new all-time high on the prior session and volume was +105% above average as it traded above the pivot point but stalled and ended in the lower half of its intra-day range. Subsequent volume-driven gains and a close above the pivot point may clinch a new (or add-on) technical buy signal. Important near-term support is at its 50 DMA line ($119.28). Fundamentals remain strong.
>>> FEATURED STOCK ARTICLE : Quietly Perched Near All-Time High After Forming a New Base - 7/6/2020 |
View all notes |
Set NEW NOTE alert |
Company Profile |
SEC
News |
Chart |
Request a new note
C
A
S
I |
NFLX
-
NASDAQ
Netflix Inc
SPECIALTY RETAIL - Music and Video Stores
|
$548.73
|
+40.97
8.07% |
$555.88
|
21,500,030
345.55% of 50 DAV
50 DAV is 6,222,000
|
$510.00
7.59%
|
5/14/2020
|
$441.95
|
PP = $449.62
|
|
MB = $472.10
|
Most Recent Note - 7/10/2020 12:53:22 PM
G - Hitting yet another new all-time high with today's volume-driven gain, getting very extended from any sound base. Found support near its 50 DMA line ($444) during recent consolidations.
>>> FEATURED STOCK ARTICLE : Powered to New High on Prior Session With Volume Driven Gain - 7/2/2020 |
View all notes |
Set NEW NOTE alert |
Company Profile |
SEC
News |
Chart |
Request a new note
C
A
S
I |
CHGG
-
NYSE
Chegg Inc
Consumer Svcs-Education
|
$75.02
|
+2.21
3.04% |
$75.24
|
2,386,435
50.97% of 50 DAV
50 DAV is 4,682,000
|
$74.00
1.38%
|
6/17/2020
|
$63.71
|
PP = $68.08
|
|
MB = $71.48
|
Most Recent Note - 7/10/2020 5:53:28 PM
G - Color code is changed to green as it hit a new all-time high and rose well above its "max buy" level with today's 3rd consecutive gain backed by below average volume. Disciplined investors may note that the recent gains above the pivot point were not backed by the at least +40% above average volume necessary to trigger a convincing technical buy signal. Prior high in the $68 area defines initial support to watch on pullbacks.
>>> FEATURED STOCK ARTICLE : Formed a Flat Base Perched Within Striking Distance of 52-Week High - 6/18/2020 |
View all notes |
Set NEW NOTE alert |
Company Profile |
SEC
News |
Chart |
Request a new note
C
A
S
I |
LGIH
-
NASDAQ
L G I Homes Inc
Bldg-Resident/Comml
|
$101.61
|
+3.13
3.18% |
$102.47
|
285,439
70.48% of 50 DAV
50 DAV is 405,000
|
$103.72
-2.03%
|
7/7/2020
|
$99.19
|
PP = $95.82
|
|
MB = $100.61
|
Most Recent Note - 7/10/2020 5:56:07 PM
G - Color code is changed to green after rising above its "max buy" level with a gain today marked by light volume. Finished strong after highlighted in yellow in the 7/07/20 mid-day report with a pivot point cited based on its 2/21/20 high plus 10 cents. Prior high in the $95 area defines initial support to watch on pullbacks.
>>> FEATURED STOCK ARTICLE : Breakout to New High Backed by 53% Above Average Volume - 7/7/2020 |
View all notes |
Set NEW NOTE alert |
Company Profile |
SEC
News |
Chart |
Request a new note
C
A
S
I |
NOW
-
NYSE
Servicenow Inc
Computer Sftwr-Enterprse
|
$422.91
|
-3.46
-0.81% |
$427.78
|
1,471,182
73.27% of 50 DAV
50 DAV is 2,008,000
|
$430.83
-1.84%
|
4/30/2020
|
$343.05
|
PP = $363.05
|
|
MB = $381.20
|
Most Recent Note - 7/8/2020 6:10:36 PM
G - Posted a quiet gain today for another new all-time high. It has not formed a sound base. Its 50 DMA line ($384) defines important near-term support to watch on pullbacks.
>>> FEATURED STOCK ARTICLE : Hovering Near All-Time High With Volume Totals Cooling - 6/25/2020 |
View all notes |
Set NEW NOTE alert |
Company Profile |
SEC
News |
Chart |
Request a new note
C
A
S
I |
Symbol/Exchange
Company Name
Industry Group |
PRICE |
CHANGE
(%Change) |
Day High |
Volume
(% DAV)
(% 50 day avg vol) |
52 Wk Hi
% From Hi |
Featured
Date |
Price
Featured |
Pivot Featured |
|
Max Buy |
TEAM
-
NASDAQ
Atlassian Corp Plc Cl A
Comp Sftwr-Spec Enterprs
|
$192.00
|
-3.63
-1.86% |
$196.00
|
1,007,407
52.20% of 50 DAV
50 DAV is 1,930,000
|
$198.41
-3.23%
|
7/7/2020
|
$190.44
|
PP = $191.82
|
|
MB = $201.41
|
Most Recent Note - 7/10/2020 6:02:11 PM
Y - Hovering near its all-time high. Wedged higher after an orderly consolidation above its 50 DMA line ($178). Subsequent gains above the pivot point backed by at least +40% above average volume may help clinch a convincing new (or add-on) technical buy signal.
>>> FEATURED STOCK ARTICLE : 50-Day Moving Average Defines Important Near-Term Support - 6/29/2020 |
View all notes |
Set NEW NOTE alert |
Company Profile |
SEC
News |
Chart |
Request a new note
C
A
S
I |
TTD
-
NASDAQ
The Trade Desk Inc Cl A
Comml Svcs-Advertising
|
$461.98
|
-1.02
-0.22% |
$462.79
|
960,605
45.27% of 50 DAV
50 DAV is 2,122,000
|
$471.12
-1.94%
|
6/3/2020
|
$340.61
|
PP = $327.35
|
|
MB = $343.72
|
Most Recent Note - 7/8/2020 6:08:29 PM
G - Hit yet another new 52-week high with today's 6th consecutive gain, getting very extended from any sound base. Its 50 DMA line ($346.58) defines near-term support above prior highs in the $327 area.
>>> FEATURED STOCK ARTICLE : Pullback Breaks Streak of 8 Straight Gains Into New High Ground - 6/24/2020 |
View all notes |
Set NEW NOTE alert |
Company Profile |
SEC
News |
Chart |
Request a new note
C
A
S
I |
DOCU
-
NASDAQ
Docusign Inc
Computer Sftwr-Enterprse
|
$210.11
|
-2.31
-1.09% |
$213.40
|
4,787,996
91.65% of 50 DAV
50 DAV is 5,224,000
|
$217.00
-3.18%
|
6/10/2020
|
$149.73
|
PP = $152.10
|
|
MB = $159.71
|
Most Recent Note - 7/9/2020 12:25:13 PM
G - Hitting yet another new all-time high today, getting very extended from any sound base. Its 50 DMA line ($145) defines near-term support to watch on pullbacks. DOCU is now priced +127% above its 200 DMA price, and it is taught in the Certification that a stock trading +70-100% or more above the 200 DMA is to be recognized as a "sell signal".
>>> FEATURED STOCK ARTICLE : Rally From Ascending Base Leaves Stock Very Extended - 7/1/2020 |
View all notes |
Set NEW NOTE alert |
Company Profile |
SEC
News |
Chart |
Request a new note
C
A
S
I |
PING
-
NYSE
Ping Identity Hldg Corp
Computer Sftwr-Security
|
$33.99
|
+0.63
1.89% |
$34.79
|
2,658,611
180.24% of 50 DAV
50 DAV is 1,475,000
|
$35.36
-3.87%
|
6/1/2020
|
$29.24
|
PP = $29.90
|
|
MB = $31.40
|
Most Recent Note - 7/10/2020 5:59:51 PM
G - Perched near its all-time high after it posted a 3rd consecutive gain today backed by above average volume. Priced another Secondary Offering on 7/09/20 after an earlier Secondary Offering on 5/15/20. It has not formed a sound base of sufficient length. Prior highs in the $29 area define initial support to watch.
>>> FEATURED STOCK ARTICLE : Gain for Recent New High Backed by +71% Above Average Volume - 6/22/2020 |
View all notes |
Set NEW NOTE alert |
Company Profile |
SEC
News |
Chart |
Request a new note
C
A
S
I |
AAXN
-
NASDAQ
Axon Enterprise Inc
Security/Sfty
|
$95.91
|
-0.51
-0.53% |
$97.85
|
467,617
34.41% of 50 DAV
50 DAV is 1,359,000
|
$104.90
-8.57%
|
5/8/2020
|
$84.86
|
PP = $90.20
|
|
MB = $94.71
|
Most Recent Note - 7/7/2020 6:26:44 PM
G - Pulled back today with below average volume, yet it remains above its "max buy" level. Completed a new Public Offering on 6/17/20. Prior highs in the $90-91 area have acted as support following a powerful breakout. More damaging losses would raise concerns and trigger a technical sell signal.
>>> FEATURED STOCK ARTICLE : Completed New Pubic Offering and Found Support Near Prior High - 6/19/2020 |
View all notes |
Set NEW NOTE alert |
Company Profile |
SEC
News |
Chart |
Request a new note
C
A
S
I |
Symbol/Exchange
Company Name
Industry Group |
PRICE |
CHANGE
(%Change) |
Day High |
Volume
(% DAV)
(% 50 day avg vol) |
52 Wk Hi
% From Hi |
Featured
Date |
Price
Featured |
Pivot Featured |
|
Max Buy |
|
|
|
THESE ARE NOT BUY RECOMMENDATIONS!
Comments contained in the body of this report are technical
opinions only. The material herein has been obtained
from sources believed to be reliable and accurate, however,
its accuracy and completeness cannot be guaranteed.
This site is not an investment advisor, hence it does
not endorse or recommend any securities or other investments.
Any recommendation contained in this report may not
be suitable for all investors and it is not to be deemed
an offer or solicitation on our part with respect to
the purchase or sale of any securities. All trademarks,
service marks and trade names appearing in this report
are the property of their respective owners, and are
likewise used for identification purposes only.
This report is a service available
only to active Paid Premium Members.
You may opt-out of receiving report notifications
at any time. Questions or comments may be submitted
by writing to Premium Membership Services 665 S.E. 10 Street, Suite 201 Deerfield Beach, FL 33441-5634 or by calling 1-800-965-8307
or 954-785-1121.
|
|
|