You are not logged in.
This means you
CAN ONLY VIEW reports that were published prior to Monday, April 14, 2025.
You
MUST UPGRADE YOUR MEMBERSHIP if you want to see any current reports.
AFTER MARKET UPDATE - MONDAY, JULY 7TH, 2014
Previous After Market Report Next After Market Report >>>
|
|
|
|
DOW |
-44.05 |
17,024.21 |
-0.26% |
|
Volume |
586,552,210 |
+11% |
|
Volume |
1,566,887,360 |
+68% |
|
NASDAQ |
-34.40 |
4,451.53 |
-0.77% |
|
Advancers |
945 |
30% |
|
Advancers |
554 |
19% |
|
S&P 500 |
-7.79 |
1,977.65 |
-0.39% |
|
Decliners |
2,160 |
68% |
|
Decliners |
2,290 |
79% |
|
Russell 2000 |
-21.41 |
1,186.74 |
-1.77% |
|
52 Wk Highs |
97 |
|
|
52 Wk Highs |
74 |
|
|
S&P 600 |
-10.55 |
681.99 |
-1.52% |
|
52 Wk Lows |
8 |
|
|
52 Wk Lows |
14 |
|
|
 |
Breadth Negative as Major Averages Pulled Back
Kenneth J. Gruneisen - Passed the CAN SLIM® Master's Exam
The market experienced a round of profit taking after the Dow and S&P 500 finished at fresh record highs last week. Volume on Monday's session was higher than the prior shortened session's volume totals on both the NYSE and on the Nasdaq exchange. Breadth was negative as decliners led advancers by more than a 2-1 margin on the NYSE and by a 4-1 margin on the Nasdaq exchange. There were 39 high-ranked companies from the CANSLIM.net Leaders List that made new 52-week highs and appeared on the CANSLIM.net BreakOuts Page, down from the prior session's total of 67 stocks. New 52-week highs contracted yet still easily outnumbered new 52-week lows on the NYSE and on the Nasdaq exchange. There were gains for only 2 of the 15 high-ranked companies currently included on the Featured Stocks Page. The S&P 500 Index and Dow Jones Industrial Average recently surged into new high territory with healthy leadership (new 52-week highs) sending a reassuring signal that the market direction (M criteria) is in a "confirmed uptrend". Any new buying efforts should be selective and focused in stocks meeting all key criteria of the fact-based investment system.

PICTURED: The Dow Jones Industrial Average is at all-time highs and after rallying above the 17,000 level last week. Its upward trendline and 50-day moving average (DMA) line define near-term support to watch on pullbacks.
Investors were also cautious ahead of the start to earnings season. Alcoa (AA -1.7%) before the aluminum producer unofficially kicks off second-quarter profit tallies after the close Tuesday.
Overall, seven of the 10 S&P 500 sectors declined. Materials and industrials were among the worst performing groups. Dow Chemical (DOW -1.5%). Delta Air Lines (DAL -4.5%). Health care stocks also weighed on the market, paced by Amgen's (AMGN -2.2%) loss. The more defensive utilities, telecommunications and consumer staples sectors finished higher. Exelon (EXC +1.2%), AT&T (T +0.5%), and Archer Daniels Midland (ADM +1.8%) rose following news that it agreed to buy Wild Flavors for about $3 billion.
Treasuries advanced. The 10-year note rose 6/32 to yield 2.62%. The 30-year bond gained half of a point to yield 3.44%.
The CANSLIM.net Featured Stocks Page shows the most action-worthy candidates and their latest notes and a Headline Link directs members to the latest detailed analysis with data-packed graphs annotated by a Certified expert along with links to additional resources. The Premium Member Homepage includes "dynamic archives" to all prior pay reports published. Watch for an announcement via email concerning the next WEBCAST.
|
 Kenneth J. Gruneisen started out as a licensed stockbroker in August 1987, a couple of months prior to the historic stock market crash that took the Dow Jones Industrial Average down -22.6% in a single day. He has published daily fact-based fundamental and technical analysis on high-ranked stocks online for two decades. Through FACTBASEDINVESTING.COM, Kenneth provides educational articles, news, market commentary, and other information regarding proven investment systems that work in good times and bad.
Comments contained in the body of this report are technical opinions only and are not necessarily those of Gruneisen Growth Corp. The material herein has been obtained from sources believed to be reliable and accurate, however, its accuracy and completeness cannot be guaranteed. Our firm, employees, and customers may effect transactions, including transactions contrary to any recommendation herein, or have positions in the securities mentioned herein or options with respect thereto. Any recommendation contained in this report may not be suitable for all investors and it is not to be deemed an offer or solicitation on our part with respect to the purchase or sale of any securities. |
|
 |
Financial, Tech, and Commodity-Linked Groups Fell
Kenneth J. Gruneisen - Passed the CAN SLIM® Master's Exam
The Biotechnology Index ($BTK -2.11%) led the tech sector's retreat while the Networking Index ($NWX -0.85%) and the Semiconductor Index ($SOX -0.68%) followed with smaller gains. Commodity-linked groups had a negative bias as the Gold & Silver Index ($XAU -1.48%), Oil Services Index ($OSX -1.29%), and the Integrated Oil Index ($XOI -0.70%) fell. Financial shares added pressure the major averages as the Broker/Dealer Index ($XBD -1.10%) and the Bank Index ($BKX -0.65%) lost ground. The Retail Index ($RLX -0.52%) also ended modestly lower.
Charts courtesy www.stockcharts.com
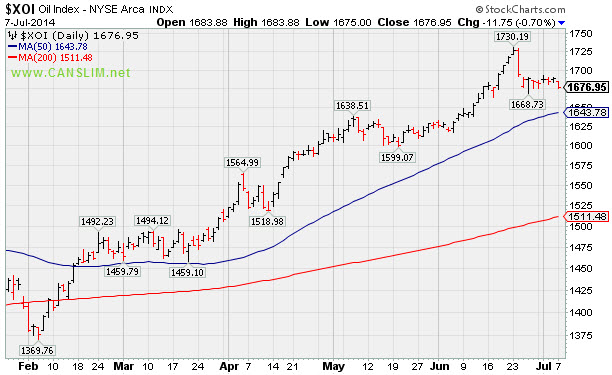
PICTURED: The Integrated Oil Index ($XOI -0.70%) is consolidating above its well 50-day moving average (DMA) line.
| Oil Services |
$OSX |
306.81 |
-4.00 |
-1.29% |
+9.17% |
| Integrated Oil |
$XOI |
1,676.95 |
-11.75 |
-0.70% |
+11.56% |
| Semiconductor |
$SOX |
646.10 |
-4.45 |
-0.68% |
+20.76% |
| Networking |
$NWX |
337.94 |
-2.89 |
-0.85% |
+4.32% |
| Broker/Dealer |
$XBD |
160.66 |
-1.79 |
-1.10% |
+0.06% |
| Retail |
$RLX |
906.45 |
-4.71 |
-0.52% |
-3.55% |
| Gold & Silver |
$XAU |
99.98 |
-1.50 |
-1.48% |
+18.81% |
| Bank |
$BKX |
71.91 |
-0.47 |
-0.65% |
+3.83% |
| Biotech |
$BTK |
2,794.84 |
-60.14 |
-2.11% |
+19.93% |
|
|
|
 |
Great Ranks and Reassuring Leadership in Chemical Group
Kenneth J. Gruneisen - Passed the CAN SLIM® Master's Exam
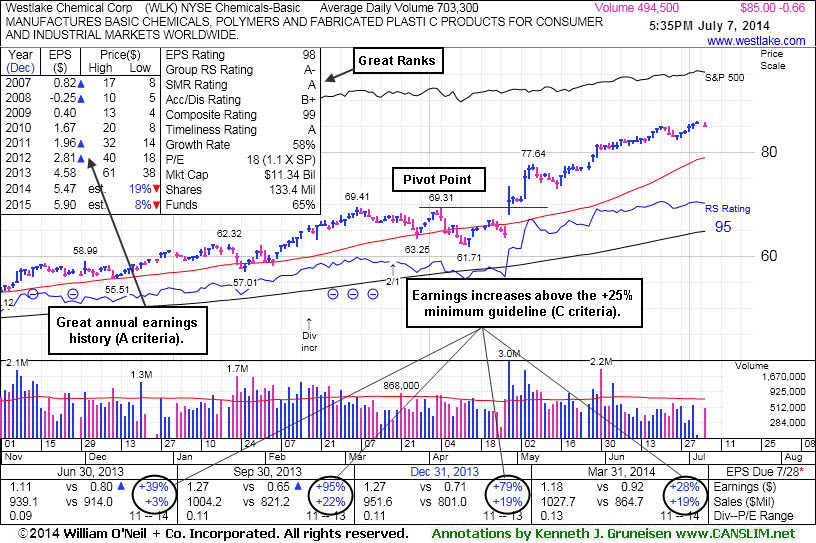
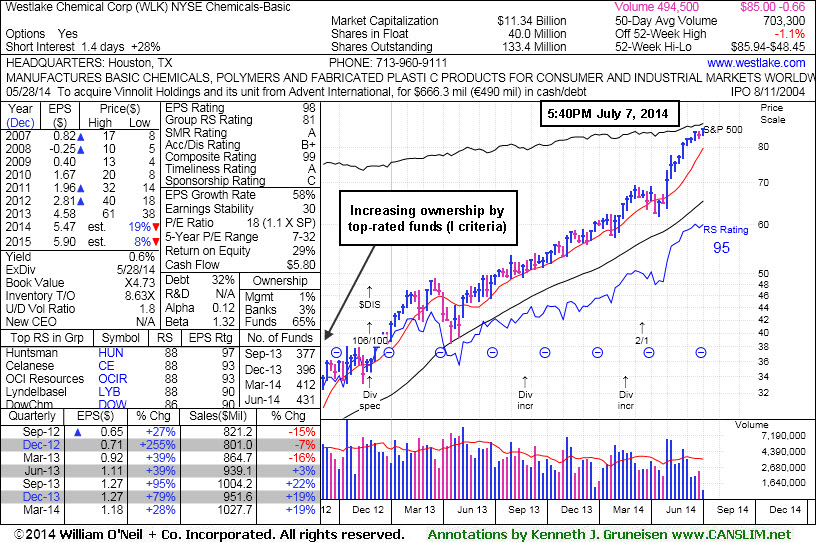
Westlake Chemical Corp (WLK -$0.66 or -0.77% to $85.00) is hovering near its 52-week high, extended from any sound base pattern. Its 50-day moving average (DMA) line defines important near-term support to watch on pullbacks. It was last shown in this FSU section on 6/13/14 under the headline, "Chemical Firm Quietly Posted 7th Consecutive Weekly Gain". Volume totals have been below average in recent weeks while holding its ground, a sign that very few investors have headed for the exit. The Chemicals - Basic industry group has a Group Relative Strength rating of 81 and strong action and leadership from others in the group is a reassuring sign concerning the L criteria.
It finished the session up +16.8% from when it was first featured in yellow at $72.79 rallying from a "double bottom" base in the 4/29/14 mid-day report (read here). It reported +28% earnings on +19% sales for the Mar '14 quarter, and it has earned great ranks as its quarterly earnings increases have been above the +25% minimum (C criteria). Its annual earnings growth rate (A criteria) has also been strong after a downturn in FY '08 and '09. The number of top-rated funds owning its shares rose from 381 in Sep '13 to 431 in Mar '14, a reassuring trend concerning the I criteria. The small supply of only 40 million shares (S criteria) in the public float is ideal, while it can contribute to greater price volatility in the event of new institutional buying or selling.
|
|
|
Color Codes Explained :
Y - Better candidates highlighted by our
staff of experts.
G - Previously featured
in past reports as yellow but may no longer be buyable under the
guidelines.
***Last / Change / Volume data in this table is the closing quote data***
Symbol/Exchange
Company Name
Industry Group |
PRICE |
CHANGE
(%Change) |
Day High |
Volume
(% DAV)
(% 50 day avg vol) |
52 Wk Hi
% From Hi |
Featured
Date |
Price
Featured |
Pivot Featured |
|
Max Buy |
ACT
-
NYSE
Actavis plc
Medical-Generic Drugs
|
$220.77
|
-0.81
-0.37% |
$222.07
|
2,213,771
96.71% of 50 DAV
50 DAV is 2,289,000
|
$230.77
-4.33%
|
6/20/2014
|
$216.53
|
PP = $230.87
|
|
MB = $242.41
|
 Most Recent Note - 7/7/2014 4:33:29 PM
Y - Still hovering within close striking distance of its 52-week high. Subsequent volume-driven gains to new highs may trigger a technical buy signal.
>>> FEATURED STOCK ARTICLE : Volume Above Average as Generic Drug Firm Approaches Highs - 6/24/2014
View all notes |
Set NEW NOTE alert |
CANSLIM.net Company Profile |
SEC
News |
Chart |
Request a new note
C
A N
S L
I M


|
AFSI
-
NASDAQ
Amtrust Financial Svcs
INSURANCE - Property and; Casualty Insurance
|
$42.07
|
-0.83
-1.93% |
$42.95
|
884,996
128.26% of 50 DAV
50 DAV is 690,000
|
$47.10
-10.68%
|
5/21/2014
|
$44.85
|
PP = $44.85
|
|
MB = $47.09
|
Most Recent Note - 7/7/2014 11:58:46 AM
G - Slumping below its 50 DMA line with heavier volume behind today's loss. Faces some resistance due to overhead supply up through the $47 level.
>>> FEATURED STOCK ARTICLE : Found Support Near 50-Day Average and Relative Strength Slightly Improved - 7/1/2014
View all notes |
Set NEW NOTE alert |
CANSLIM.net Company Profile |
SEC
News |
Chart |
Request a new note
C
A N
S L
I M
|
AL
-
NYSE
Air Lease Corp Cl A
DIVERSIFIED SERVICES - Rental and Leasing Services
|
$37.59
|
-0.89
-2.31% |
$38.51
|
768,097
72.94% of 50 DAV
50 DAV is 1,053,000
|
$42.89
-12.36%
|
5/9/2014
|
$38.27
|
PP = $38.25
|
|
MB = $40.16
|
Most Recent Note - 7/7/2014 4:35:01 PM
G - Slumped further below its 50 DMA line today. A subsequent violation of its recent low ($36.55 on 6/13/17) would raise more serious concerns and trigger a worrisome technical sell signal.
>>> FEATURED STOCK ARTICLE : Finding Support Near 50-Day Moving Average Line - 7/2/2014
View all notes |
Set NEW NOTE alert |
CANSLIM.net Company Profile |
SEC
News |
Chart |
Request a new note
C
A N
S L
I M
|
BITA
-
NYSE
Bitauto Hldgs Ltd Ads
Internet-Content
|
$49.46
|
+1.49
3.11% |
$49.67
|
1,185,003
130.94% of 50 DAV
50 DAV is 905,000
|
$49.20
0.53%
|
6/26/2014
|
$46.20
|
PP = $47.03
|
|
MB = $49.38
|
Most Recent Note - 7/7/2014 4:37:39 PM
G - Hit a new 52-week high while rallying above its "max buy" level with slightly above average volume behind today's gain and its color code is changed to green.
>>> FEATURED STOCK ARTICLE : Perched At High With No Resistance Remaining Due to Overhead Supply - 6/27/2014
View all notes |
Set NEW NOTE alert |
CANSLIM.net Company Profile |
SEC
News |
Chart |
Request a new note
C
A N
S L
I M
|
BWLD
-
NASDAQ
Buffalo Wild Wings Inc
LEISURE - Restaurants
|
$158.59
|
-3.74
-2.30% |
$161.91
|
390,144
85.93% of 50 DAV
50 DAV is 454,000
|
$167.36
-5.24%
|
6/19/2014
|
$158.52
|
PP = $159.91
|
|
MB = $167.91
|
Most Recent Note - 7/2/2014 12:18:20 PM
Y - Gapped down today while retreating from its 52-week high. Disciplined investors avoid chasing stocks more than +5% above prior highs and always limit losses by selling any stock that falls more than -7% from their purchase price.
>>> FEATURED STOCK ARTICLE : Perched Near Highs With Strong Fundamentals - 6/19/2014
View all notes |
Set NEW NOTE alert |
CANSLIM.net Company Profile |
SEC
News |
Chart |
Request a new note
C
A N
S L
I M
|
Symbol/Exchange
Company Name
Industry Group |
PRICE |
CHANGE
(%Change) |
Day High |
Volume
(% DAV)
(% 50 day avg vol) |
52 Wk Hi
% From Hi |
Featured
Date |
Price
Featured |
Pivot Featured |
|
Max Buy |
EQM
-
NYSE
E Q T Midstream Partners
ENERGY - Oil and Gas Pipelines
|
$92.41
|
-2.60
-2.74% |
$95.00
|
252,880
59.50% of 50 DAV
50 DAV is 425,000
|
$102.51
-9.85%
|
12/12/2013
|
$53.17
|
PP = $56.51
|
|
MB = $59.34
|
Most Recent Note - 7/2/2014 3:59:51 PM
G - Stubbornly holding its ground near its all-time high. Strength has continued despite fundamental flaws repeatedly noted.
>>> FEATURED STOCK ARTICLE : Strength Continued Despite Fundamental Flaws - 6/25/2014
View all notes |
Set NEW NOTE alert |
CANSLIM.net Company Profile |
SEC
News |
Chart |
Request a new note
C
A N
S L
I M
|
GRFS
-
NASDAQ
Grifols Sa Ads
Medical-Ethical Drugs
|
$42.10
|
-1.59
-3.64% |
$43.85
|
717,765
105.87% of 50 DAV
50 DAV is 678,000
|
$46.66
-9.77%
|
5/15/2014
|
$41.14
|
PP = $43.55
|
|
MB = $45.73
|
Most Recent Note - 7/7/2014 4:26:22 PM
G - Violated its 50 DMA line with a damaging loss on higher (near average) volume triggering a technical sell signal and its color code is changed to green. Disciplined investors always limit losses by selling any stock that falls more than -7% from their purchase price.
>>> FEATURED STOCK ARTICLE : Consolidating Just Below "Max Buy" Level - 6/17/2014
View all notes |
Set NEW NOTE alert |
CANSLIM.net Company Profile |
SEC
News |
Chart |
Request a new note
C
A N
S L
I M
|
HF
-
NYSE
H F F Inc Cl A
REAL ESTATE - Property Management/Developmen
|
$37.84
|
-0.31
-0.81% |
$37.94
|
246,762
127.86% of 50 DAV
50 DAV is 193,000
|
$38.23
-1.02%
|
6/20/2014
|
$34.60
|
PP = $36.16
|
|
MB = $37.97
|
Most Recent Note - 7/3/2014 2:47:09 PM
G - Hit a new 52-week high today and finished near the session high. Color code is changed to green after rallying above its "max buy" level. Gains above its pivot point with above average volume recently triggered a technical buy signal. Prior highs in the $35-36 area define initial support to watch on pullbacks.
>>> FEATURED STOCK ARTICLE : Approached 52-Week High With Volume-Driven Gain - 6/23/2014
View all notes |
Set NEW NOTE alert |
CANSLIM.net Company Profile |
SEC
News |
Chart |
Request a new note
C
A N
S L
I M
|
ICON
-
NASDAQ
Iconix Brand Group Inc
CONSUMER NON-DURABLES - Textile - Apparel Footwear
|
$42.71
|
-0.49
-1.13% |
$43.18
|
396,536
71.84% of 50 DAV
50 DAV is 552,000
|
$44.81
-4.69%
|
6/5/2014
|
$43.54
|
PP = $43.44
|
|
MB = $45.61
|
Most Recent Note - 7/3/2014 2:49:12 PM
Y - Still quietly consolidating above its 50 DMA line ($42.30) and prior highs in the $43-42 area defining important support to watch.
>>> FEATURED STOCK ARTICLE : Found Support Above Prior Highs During Consolidation - 6/18/2014
View all notes |
Set NEW NOTE alert |
CANSLIM.net Company Profile |
SEC
News |
Chart |
Request a new note
C
A N
S L
I M
|
KS
-
NYSE
Kapstone Paper&Packaging
MANUFACTURING - Paper and Packaging
|
$30.55
|
-2.10
-6.43% |
$32.65
|
2,263,952
243.17% of 50 DAV
50 DAV is 931,000
|
$34.43
-11.27%
|
6/20/2014
|
$32.30
|
PP = $31.92
|
|
MB = $33.52
|
Most Recent Note - 7/7/2014 4:20:14 PM
Y - Down considerably today with heavy volume, undercutting prior highs near $32 raising concerns. Disciplined investors limit losses by selling any stock that falls more than -7% from their purchase price.
>>> FEATURED STOCK ARTICLE : Four Times Average Volume Behind Big Breakout Gain - 6/20/2014
View all notes |
Set NEW NOTE alert |
CANSLIM.net Company Profile |
SEC
News |
Chart |
Request a new note
C
A N
S L
I M
|
Symbol/Exchange
Company Name
Industry Group |
PRICE |
CHANGE
(%Change) |
Day High |
Volume
(% DAV)
(% 50 day avg vol) |
52 Wk Hi
% From Hi |
Featured
Date |
Price
Featured |
Pivot Featured |
|
Max Buy |
PANW
-
NYSE
Palo Alto Networks
Computer Sftwr-Security
|
$79.57
|
-2.65
-3.22% |
$82.00
|
1,352,896
73.53% of 50 DAV
50 DAV is 1,840,000
|
$85.78
-7.24%
|
5/29/2014
|
$75.95
|
PP = $72.50
|
|
MB = $76.13
|
Most Recent Note - 7/7/2014 4:31:27 PM
G - Down today on below average volume yet closed near the session low and below its 3/18/14 closing price ($79.82) raising some concerns.
>>> FEATURED STOCK ARTICLE : Gap Up Gain on Above Average Volume for New Highs - 6/30/2014
View all notes |
Set NEW NOTE alert |
CANSLIM.net Company Profile |
SEC
News |
Chart |
Request a new note
C
A N
S L
I M
|
SN
-
NYSE
Sanchez Energy Corp
ENERGY - Independent Oil and Gas
|
$35.38
|
-0.74
-2.05% |
$36.23
|
728,953
47.03% of 50 DAV
50 DAV is 1,550,000
|
$38.95
-9.17%
|
5/22/2014
|
$33.00
|
PP = $31.59
|
|
MB = $33.17
|
Most Recent Note - 7/3/2014 2:16:04 PM
G - Extended from its prior base with volume totals cooling. Its 50 DMA line ($32.51) and prior highs near $32 define support to watch on pullbacks. See the latest FSU analysis for more details and new annotated graphs.
>>> FEATURED STOCK ARTICLE : Recently Featured Stock Outpaced Benchmark S&P 500 Index - 7/3/2014
View all notes |
Set NEW NOTE alert |
CANSLIM.net Company Profile |
SEC
News |
Chart |
Request a new note
C
A N
S L
I M
|
TARO
-
NYSE
Taro Pharmaceutical Inds
DRUGS - Drug Manufacturers - Other
|
$141.77
|
+0.07
0.05% |
$145.26
|
63,858
104.69% of 50 DAV
50 DAV is 61,000
|
$146.64
-3.32%
|
6/26/2014
|
$117.31
|
PP = $118.90
|
|
MB = $124.85
|
Most Recent Note - 7/3/2014 11:21:34 AM
G - Perched at its all-time high following 6 consecutive volume-driven gains, extended from its prior base. Disciplined investors avoid chasing stocks more than +5% above prior highs.
>>> FEATURED STOCK ARTICLE : Fundamentally Strong Stock Challenging Prior Resistance Level - 6/26/2014
View all notes |
Set NEW NOTE alert |
CANSLIM.net Company Profile |
SEC
News |
Chart |
Request a new note
C
A N
S L
I M
|
TRN
-
NYSE
Trinity Industries Inc
TRANSPORTATION - Railroads
|
$44.23
|
-0.66
-1.47% |
$44.95
|
1,990,425
57.51% of 50 DAV
50 DAV is 3,461,000
|
$46.00
-3.85%
|
4/30/2014
|
$37.79
|
PP = $38.03
|
|
MB = $39.93
|
Most Recent Note - 7/2/2014 4:03:17 PM
G - Gapped up today and hit a new 52-week high with a gain on light volume, getting more extended from its prior base. Its 50 DMA line defines important near-term support to watch.
>>> FEATURED STOCK ARTICLE : Recent Lows and 50-Day Moving Average Line Define Near-Term Support - 6/16/2014
View all notes |
Set NEW NOTE alert |
CANSLIM.net Company Profile |
SEC
News |
Chart |
Request a new note
C
A N
S L
I M
|
WLK
-
NYSE
Westlake Chemical Corp
CHEMICALS - Specialty Chemicals
|
$85.00
|
-0.66
-0.77% |
$85.77
|
494,541
70.35% of 50 DAV
50 DAV is 703,000
|
$85.94
-1.09%
|
4/29/2014
|
$72.79
|
PP = $69.31
|
|
MB = $72.78
|
Most Recent Note - 7/7/2014 5:56:05 PM
G - Perched at its 52-week high, extended from any sound base pattern. Its 50 DMA line defines important near-term support to watch on pullbacks. See the latest FSU analysis for more details and new annotated graphs.
>>> FEATURED STOCK ARTICLE : Great Ranks and Reassuring Leadership in Chemical Group - 7/7/2014
View all notes |
Set NEW NOTE alert |
CANSLIM.net Company Profile |
SEC
News |
Chart |
Request a new note
C
A N
S L
I M
|
Symbol/Exchange
Company Name
Industry Group |
PRICE |
CHANGE
(%Change) |
Day High |
Volume
(% DAV)
(% 50 day avg vol) |
52 Wk Hi
% From Hi |
Featured
Date |
Price
Featured |
Pivot Featured |
|
Max Buy |
|
|
|
THESE ARE NOT BUY RECOMMENDATIONS!
Comments contained in the body of this report are technical
opinions only. The material herein has been obtained
from sources believed to be reliable and accurate, however,
its accuracy and completeness cannot be guaranteed.
This site is not an investment advisor, hence it does
not endorse or recommend any securities or other investments.
Any recommendation contained in this report may not
be suitable for all investors and it is not to be deemed
an offer or solicitation on our part with respect to
the purchase or sale of any securities. All trademarks,
service marks and trade names appearing in this report
are the property of their respective owners, and are
likewise used for identification purposes only.
This report is a service available
only to active Paid Premium Members.
You may opt-out of receiving report notifications
at any time. Questions or comments may be submitted
by writing to Premium Membership Services 665 S.E. 10 Street, Suite 201 Deerfield Beach, FL 33441-5634 or by calling 1-800-965-8307
or 954-785-1121.
|
|
|

