You are not logged in.
This means you
CAN ONLY VIEW reports that were published prior to Tuesday, April 8, 2025.
You
MUST UPGRADE YOUR MEMBERSHIP if you want to see any current reports.
AFTER MARKET UPDATE - THURSDAY, JULY 3RD, 2014
Previous After Market Report Next After Market Report >>>
|
|
|
|
DOW |
+92.02 |
17,068.26 |
+0.54% |
|
Volume |
528,008,810 |
-10% |
|
Volume |
930,507,310 |
-37% |
|
NASDAQ |
+28.20 |
4,485.93 |
+0.63% |
|
Advancers |
1,760 |
56% |
|
Advancers |
1,814 |
66% |
|
S&P 500 |
+10.82 |
1,985.44 |
+0.55% |
|
Decliners |
1,287 |
41% |
|
Decliners |
848 |
31% |
|
Russell 2000 |
+8.65 |
1,208.15 |
+0.72% |
|
52 Wk Highs |
191 |
|
|
52 Wk Highs |
117 |
|
|
S&P 600 |
+5.61 |
692.54 |
+0.82% |
|
52 Wk Lows |
6 |
|
|
52 Wk Lows |
17 |
|
|
 |
Major Averages Rallied for New Record Highs
Kenneth J. Gruneisen - Passed the CAN SLIM® Master's Exam
On Thursday stocks finished the holiday-shortened week on a positive note. The Dow Jones Industrial Average rose 93 points to close above 17,000 at an all-time high of 17,068. The S&P 500 Index gained 11 points to reach a record level of 1,985. The volume on the holiday-shortended session was obviously lighter than the prior session totals on both the NYSE and on the Nasdaq exchange. Breadth was positive as advancers led decliners by nearly a 3-2 margin on the NYSE and by more than a 2-1 margin on the Nasdaq exchange. There were 67 high-ranked companies from the CANSLIM.net Leaders List that made new 52-week highs and appeared on the CANSLIM.net BreakOuts Page, up from the prior session's total of 59 stocks. New 52-week highs expanded and easily outnumbered new 52-week lows on the NYSE and on the Nasdaq exchange. There were gains for 10 of the 15 high-ranked companies currently included on the Featured Stocks Page. The S&P 500 Index and Dow Jones Industrial Average recently surged into new high territory with healthy leadership (new 52-week highs) sending a reassuring signal that the market direction (M criteria) is in a "confirmed uptrend". Any new buying efforts should be selective and focused in stocks meeting all key criteria of the fact-based investment system.
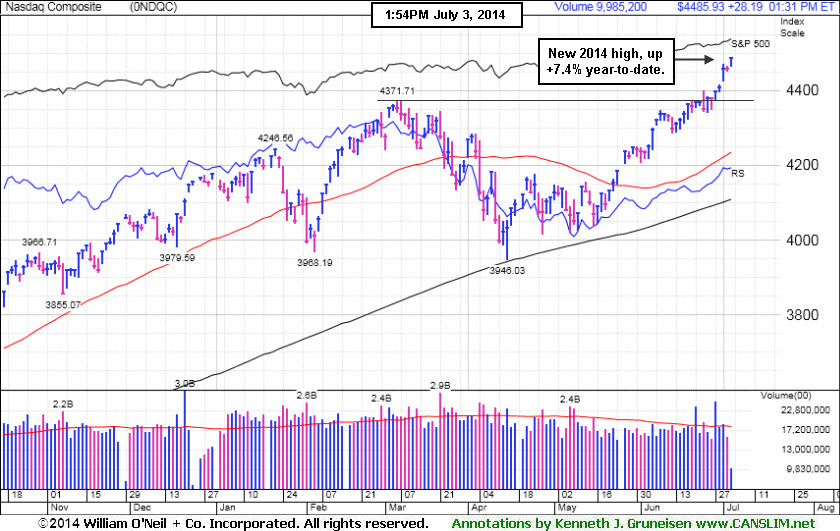
PICTURED: The Nasdaq Composite Index was 28 points higher at 4,485 leaving the tech-heavy index at a new 2014 high, up +7.4% year-to-date.
The major averages rallied on Thursday after a better-than-expected jobs report. Nonfarm payrolls rose 288,000 in June, above a projected 215,000 increase. The unemployment rate fell to 6.1% last month versus the consensus expectation to remain at 6.3%. Weekly jobless claims rose 2,000 to 315,000. The market was also higher after the European Central Bank held its benchmark interest rate steady at the conclusion of its policy meeting.
In other news, Lululemon (LULU +2.9%) rose amid reports the yoga apparel maker explored the possibility of going private. Shares of PetSmart (PETM +12.5%) gapped up after activist investment firm Jana Partners disclosed a stake in the company.
Materials and industrials were the best performing groups on the session As Freeport McMoRan (FCX +1.8%) and General Electric (GE +0.9%) rose. Utilities were the worst performing sector in the S&P 500 as Exelon (EXC -1.8%) and Dominion Resources (D -1.4%) fell.
Treasuries retreated following the better-than-expected employment data. Benchmark 10-year notes fell 4/32 to yield 2.64%.
The CANSLIM.net Featured Stocks Page shows the most action-worthy candidates and their latest notes and a Headline Link directs members to the latest detailed analysis with data-packed graphs annotated by a Certified expert along with links to additional resources. The Premium Member Homepage includes "dynamic archives" to all prior pay reports published. Watch for an announcement via email concerning the next WEBCAST.
|
 Kenneth J. Gruneisen started out as a licensed stockbroker in August 1987, a couple of months prior to the historic stock market crash that took the Dow Jones Industrial Average down -22.6% in a single day. He has published daily fact-based fundamental and technical analysis on high-ranked stocks online for two decades. Through FACTBASEDINVESTING.COM, Kenneth provides educational articles, news, market commentary, and other information regarding proven investment systems that work in good times and bad.
Comments contained in the body of this report are technical opinions only and are not necessarily those of Gruneisen Growth Corp. The material herein has been obtained from sources believed to be reliable and accurate, however, its accuracy and completeness cannot be guaranteed. Our firm, employees, and customers may effect transactions, including transactions contrary to any recommendation herein, or have positions in the securities mentioned herein or options with respect thereto. Any recommendation contained in this report may not be suitable for all investors and it is not to be deemed an offer or solicitation on our part with respect to the purchase or sale of any securities. |
|
 |
Financial, Retail, and Tech Indices Led Gaining Groups
Kenneth J. Gruneisen - Passed the CAN SLIM® Master's Exam
Financial shares underpinned the major averages' rally on Thursday as the Broker/Dealer Index ($XBD +1.34%) and the Bank Index ($BKX +1.02%) rose. The Retail Index ($RLX +0.92%) also tallied a solid gain. The Semiconductor Index ($SOX +0.74%) led the tech sector higher while the Networking Index ($NWX +0.37%) and the Biotechnology Index ($BTK +0.39%) posted smaller gains. Commodity-linked groups had a slightly positive bias as the Gold & Silver Index ($XAU +0.14%), Integrated Oil Index ($XOI +0.28%), and the Oil Services Index ($OSX +0.39%) edged higher.
Charts courtesy www.stockcharts.com
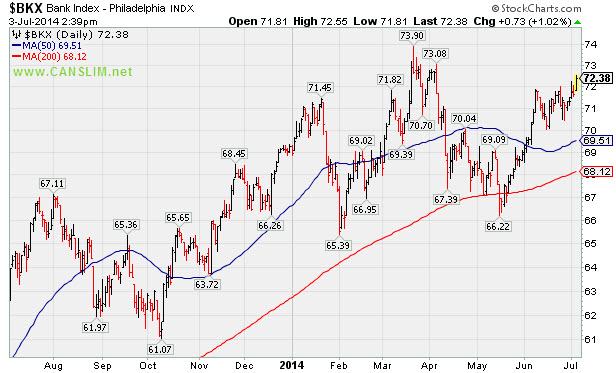
PICTURED 1: The Bank Index ($BKX +1.02%) is rebounding toward its 2014 highs. It found support near its 200-day moving average (DMA) line.
Charts courtesy www.stockcharts.com
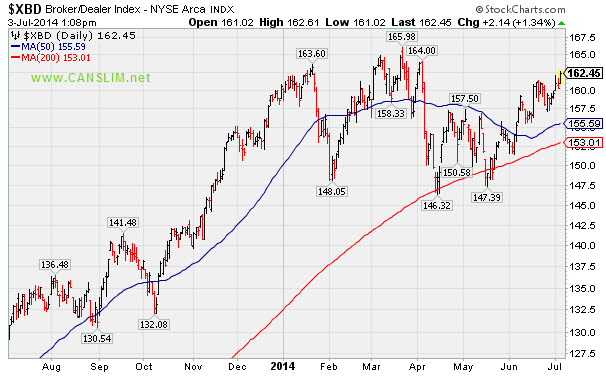
PICTURED 2: The Broker/Dealer Index ($XBD +1.34%) is rebounding toward its 2014 highs. It found support near its 200-day moving average (DMA) line.
| Oil Services |
$OSX |
310.81 |
+1.21 |
+0.39% |
+10.60% |
| Integrated Oil |
$XOI |
1,688.70 |
+4.71 |
+0.28% |
+12.35% |
| Semiconductor |
$SOX |
650.55 |
+4.77 |
+0.74% |
+21.59% |
| Networking |
$NWX |
340.83 |
+1.26 |
+0.37% |
+5.21% |
| Broker/Dealer |
$XBD |
162.45 |
+2.14 |
+1.34% |
+1.18% |
| Retail |
$RLX |
911.16 |
+8.33 |
+0.92% |
-3.05% |
| Gold & Silver |
$XAU |
101.48 |
+0.14 |
+0.14% |
+20.59% |
| Bank |
$BKX |
72.38 |
+0.73 |
+1.02% |
+4.50% |
| Biotech |
$BTK |
2,854.98 |
+11.04 |
+0.39% |
+22.51% |
|
|
|
 |
Recently Featured Stock Outpaced Benchmark S&P 500 Index
Kenneth J. Gruneisen - Passed the CAN SLIM® Master's Exam
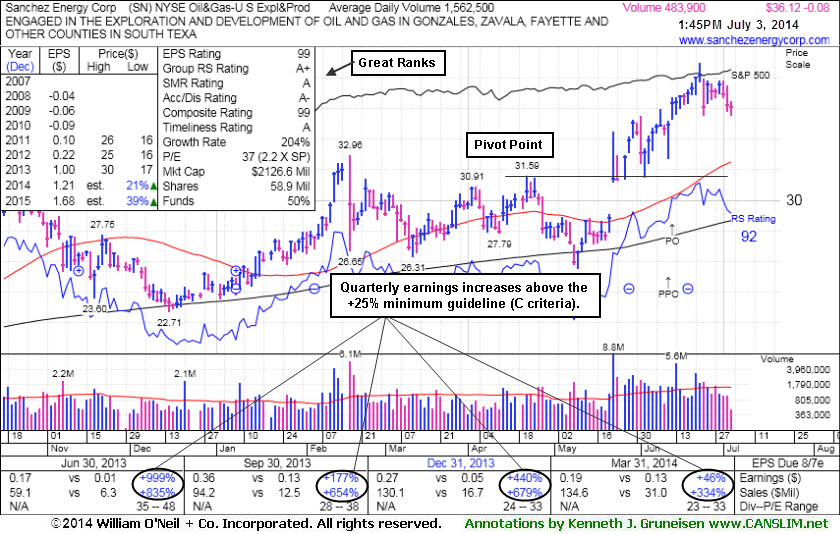
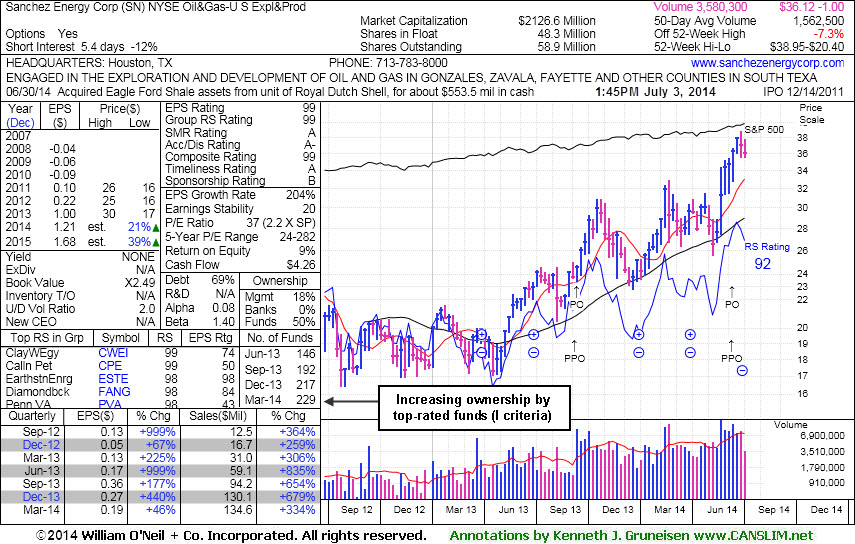
Sanchez Energy Corp (SN -$0.08 or -0.22% to $36.12) is extended from its prior base. Its 50-day moving average (DMA) line and prior highs near $32 define support to watch on pullbacks. The high-ranked Oil & Gas firm completed a new Public Offering on 6/12/14 after it last appeared in this FSU section on 6/09/14 with annotated graphs under the headline, "Finished Near Session Low After Hitting new 52-Week High".
SN has traded up as much as +18% since highlighted in the 5/22/14 mid-day report (read here). Other Featured Stocks have tallied even larger gains while, during that same period, the benchmark S&P 500 Index has risen just +4.9%. This demonstrates the benefits of following the proven fact-based system of investing.
It reported earnings +46% on +334% sales revenues for the Mar '14 quarter. Quarterly comparisons show strong sales revenues and earnings increases well above the +25% minimum guideline (C criteria). Annual earnings (A criteria) history showed losses in the years prior to its IPO in Dec '11, yet it has done well in the earnings department since and earned the highest possible Earnings Per Share Rating of 99. The number of top-rated funds owning its shares rose from 147 in Jun '13 to 229 in Mar '14, a reassuring sign concerning the I criteria.
|
|
|
Color Codes Explained :
Y - Better candidates highlighted by our
staff of experts.
G - Previously featured
in past reports as yellow but may no longer be buyable under the
guidelines.
***Last / Change / Volume data in this table is the closing quote data***
Symbol/Exchange
Company Name
Industry Group |
PRICE |
CHANGE
(%Change) |
Day High |
Volume
(% DAV)
(% 50 day avg vol) |
52 Wk Hi
% From Hi |
Featured
Date |
Price
Featured |
Pivot Featured |
|
Max Buy |
ACT
-
NYSE
Actavis plc
Medical-Generic Drugs
|
$221.58
|
-0.12
-0.05% |
$222.90
|
1,797,255
78.86% of 50 DAV
50 DAV is 2,279,000
|
$230.77
-3.98%
|
6/20/2014
|
$216.53
|
PP = $230.87
|
|
MB = $242.41
|
Most Recent Note - 7/1/2014 12:00:36 PM
Y - Small gap up today challenging its 52-week high. Subsequent volume-driven gains to new highs may trigger a technical buy signal.
>>> FEATURED STOCK ARTICLE : Volume Above Average as Generic Drug Firm Approaches Highs - 6/24/2014
View all notes |
Set NEW NOTE alert |
CANSLIM.net Company Profile |
SEC
News |
Chart |
Request a new note
C
A N
S L
I M


|
AFSI
-
NASDAQ
Amtrust Financial Svcs
INSURANCE - Property and; Casualty Insurance
|
$42.90
|
+0.61
1.44% |
$43.22
|
236,737
34.31% of 50 DAV
50 DAV is 690,000
|
$47.10
-8.92%
|
5/21/2014
|
$44.85
|
PP = $44.85
|
|
MB = $47.09
|
Most Recent Note - 7/2/2014 12:10:09 PM
G - Relative Strength rating improved to 82 and it has been finding support near its 50 DMA line. Faces some resistance due to overhead supply up through the $47 level. See the latest FSU analysis for more details and annotated graphs.
>>> FEATURED STOCK ARTICLE : Found Support Near 50-Day Average and Relative Strength Slightly Improved - 7/1/2014
View all notes |
Set NEW NOTE alert |
CANSLIM.net Company Profile |
SEC
News |
Chart |
Request a new note
C
A N
S L
I M
|
AL
-
NYSE
Air Lease Corp Cl A
DIVERSIFIED SERVICES - Rental and Leasing Services
|
$38.48
|
+0.03
0.08% |
$38.75
|
238,344
22.30% of 50 DAV
50 DAV is 1,069,000
|
$42.89
-10.28%
|
5/9/2014
|
$38.27
|
PP = $38.25
|
|
MB = $40.16
|
Most Recent Note - 7/2/2014 5:22:54 PM
G - Consolidating near its 50 DMA line ($38.76). A subsequent violation of its recent low ($36.55 on 6/13/17) would raise more serious concerns and trigger a worrisome technical sell signal. See the latest FSU analysis for more details and new annotated graphs.
>>> FEATURED STOCK ARTICLE : Finding Support Near 50-Day Moving Average Line - 7/2/2014
View all notes |
Set NEW NOTE alert |
CANSLIM.net Company Profile |
SEC
News |
Chart |
Request a new note
C
A N
S L
I M
|
BITA
-
NYSE
Bitauto Hldgs Ltd Ads
Internet-Content
|
$47.97
|
+0.64
1.35% |
$48.00
|
262,892
28.61% of 50 DAV
50 DAV is 919,000
|
$49.20
-2.50%
|
6/26/2014
|
$46.20
|
PP = $47.03
|
|
MB = $49.38
|
 Most Recent Note - 7/3/2014 2:57:57 PM
Y - Holding its ground stubbornly near its 52-week high with volume totals cooling indicating that few investors have headed for the exit. A gain above its pivot point on 6/30/14 backed by +50% above average volume triggered a technical buy signal.
>>> FEATURED STOCK ARTICLE : Perched At High With No Resistance Remaining Due to Overhead Supply - 6/27/2014
View all notes |
Set NEW NOTE alert |
CANSLIM.net Company Profile |
SEC
News |
Chart |
Request a new note
C
A N
S L
I M
|
BWLD
-
NASDAQ
Buffalo Wild Wings Inc
LEISURE - Restaurants
|
$162.33
|
+1.50
0.93% |
$162.76
|
261,805
57.41% of 50 DAV
50 DAV is 456,000
|
$167.36
-3.01%
|
6/19/2014
|
$158.52
|
PP = $159.91
|
|
MB = $167.91
|
Most Recent Note - 7/2/2014 12:18:20 PM
Y - Gapped down today while retreating from its 52-week high. Disciplined investors avoid chasing stocks more than +5% above prior highs and always limit losses by selling any stock that falls more than -7% from their purchase price.
>>> FEATURED STOCK ARTICLE : Perched Near Highs With Strong Fundamentals - 6/19/2014
View all notes |
Set NEW NOTE alert |
CANSLIM.net Company Profile |
SEC
News |
Chart |
Request a new note
C
A N
S L
I M
|
Symbol/Exchange
Company Name
Industry Group |
PRICE |
CHANGE
(%Change) |
Day High |
Volume
(% DAV)
(% 50 day avg vol) |
52 Wk Hi
% From Hi |
Featured
Date |
Price
Featured |
Pivot Featured |
|
Max Buy |
EQM
-
NYSE
E Q T Midstream Partners
ENERGY - Oil and Gas Pipelines
|
$95.01
|
-1.95
-2.01% |
$97.49
|
139,685
32.87% of 50 DAV
50 DAV is 425,000
|
$102.51
-7.32%
|
12/12/2013
|
$53.17
|
PP = $56.51
|
|
MB = $59.34
|
Most Recent Note - 7/2/2014 3:59:51 PM
G - Stubbornly holding its ground near its all-time high. Strength has continued despite fundamental flaws repeatedly noted.
>>> FEATURED STOCK ARTICLE : Strength Continued Despite Fundamental Flaws - 6/25/2014
View all notes |
Set NEW NOTE alert |
CANSLIM.net Company Profile |
SEC
News |
Chart |
Request a new note
C
A N
S L
I M
|
GRFS
-
NASDAQ
Grifols Sa Ads
Medical-Ethical Drugs
|
$43.69
|
-0.37
-0.84% |
$44.25
|
203,555
29.72% of 50 DAV
50 DAV is 685,000
|
$46.66
-6.37%
|
5/15/2014
|
$41.14
|
PP = $43.55
|
|
MB = $45.73
|
Most Recent Note - 7/3/2014 2:51:05 PM
Y - Volume totals have been cooling while consolidating above its 50 DMA line. Subsequent deterioration below its 50 DMA line would raise more serious concerns. Disciplined investors always limit losses by selling any stock that falls more than -7% from their purchase price. Keep in mind that any stock which is sold can be bought again later if strength returns.
>>> FEATURED STOCK ARTICLE : Consolidating Just Below "Max Buy" Level - 6/17/2014
View all notes |
Set NEW NOTE alert |
CANSLIM.net Company Profile |
SEC
News |
Chart |
Request a new note
C
A N
S L
I M
|
HF
-
NYSE
H F F Inc Cl A
REAL ESTATE - Property Management/Developmen
|
$38.15
|
+0.98
2.64% |
$38.23
|
170,284
88.23% of 50 DAV
50 DAV is 193,000
|
$37.58
1.52%
|
6/20/2014
|
$34.60
|
PP = $36.16
|
|
MB = $37.97
|
Most Recent Note - 7/3/2014 2:47:09 PM
G - Hit a new 52-week high today and finished near the session high. Color code is changed to green after rallying above its "max buy" level. Gains above its pivot point with above average volume recently triggered a technical buy signal. Prior highs in the $35-36 area define initial support to watch on pullbacks.
>>> FEATURED STOCK ARTICLE : Approached 52-Week High With Volume-Driven Gain - 6/23/2014
View all notes |
Set NEW NOTE alert |
CANSLIM.net Company Profile |
SEC
News |
Chart |
Request a new note
C
A N
S L
I M
|
ICON
-
NASDAQ
Iconix Brand Group Inc
CONSUMER NON-DURABLES - Textile - Apparel Footwear
|
$43.20
|
+0.41
0.96% |
$43.49
|
137,983
24.60% of 50 DAV
50 DAV is 561,000
|
$44.81
-3.59%
|
6/5/2014
|
$43.54
|
PP = $43.44
|
|
MB = $45.61
|
Most Recent Note - 7/3/2014 2:49:12 PM
Y - Still quietly consolidating above its 50 DMA line ($42.30) and prior highs in the $43-42 area defining important support to watch.
>>> FEATURED STOCK ARTICLE : Found Support Above Prior Highs During Consolidation - 6/18/2014
View all notes |
Set NEW NOTE alert |
CANSLIM.net Company Profile |
SEC
News |
Chart |
Request a new note
C
A N
S L
I M
|
KS
-
NYSE
Kapstone Paper&Packaging
MANUFACTURING - Paper and Packaging
|
$32.65
|
+0.68
2.13% |
$32.77
|
564,584
60.19% of 50 DAV
50 DAV is 938,000
|
$34.43
-5.17%
|
6/20/2014
|
$32.30
|
PP = $31.92
|
|
MB = $33.52
|
Most Recent Note - 7/2/2014 3:56:52 PM
Y - Pulling back today toward prior highs near $32 defining initial support to watch on pullbacks. Held its ground stubbornly since highlighted in yellow while rallying from a "cup-with-handle" base in the 6/20/14 mid-day report (read here).
>>> FEATURED STOCK ARTICLE : Four Times Average Volume Behind Big Breakout Gain - 6/20/2014
View all notes |
Set NEW NOTE alert |
CANSLIM.net Company Profile |
SEC
News |
Chart |
Request a new note
C
A N
S L
I M
|
Symbol/Exchange
Company Name
Industry Group |
PRICE |
CHANGE
(%Change) |
Day High |
Volume
(% DAV)
(% 50 day avg vol) |
52 Wk Hi
% From Hi |
Featured
Date |
Price
Featured |
Pivot Featured |
|
Max Buy |
PANW
-
NYSE
Palo Alto Networks
Computer Sftwr-Security
|
$82.22
|
+0.35
0.43% |
$82.40
|
771,639
41.82% of 50 DAV
50 DAV is 1,845,000
|
$85.78
-4.15%
|
5/29/2014
|
$75.95
|
PP = $72.50
|
|
MB = $76.13
|
Most Recent Note - 7/1/2014 12:21:42 PM
G - Pulling back today following a gap up for a new all-time high on the prior session. Prior highs near $80 define initial support to watch on pullbacks. See the latest FSU analysis for more details and new annotated graphs.
>>> FEATURED STOCK ARTICLE : Gap Up Gain on Above Average Volume for New Highs - 6/30/2014
View all notes |
Set NEW NOTE alert |
CANSLIM.net Company Profile |
SEC
News |
Chart |
Request a new note
C
A N
S L
I M
|
SN
-
NYSE
Sanchez Energy Corp
ENERGY - Independent Oil and Gas
|
$36.12
|
-0.08
-0.22% |
$36.49
|
492,655
31.54% of 50 DAV
50 DAV is 1,562,000
|
$38.95
-7.27%
|
5/22/2014
|
$33.00
|
PP = $31.59
|
|
MB = $33.17
|
Most Recent Note - 7/3/2014 2:16:04 PM
G - Extended from its prior base with volume totals cooling. Its 50 DMA line ($32.51) and prior highs near $32 define support to watch on pullbacks. See the latest FSU analysis for more details and new annotated graphs.
>>> FEATURED STOCK ARTICLE : Recently Featured Stock Outpaced Benchmark S&P 500 Index - 7/3/2014
View all notes |
Set NEW NOTE alert |
CANSLIM.net Company Profile |
SEC
News |
Chart |
Request a new note
C
A N
S L
I M
|
TARO
-
NYSE
Taro Pharmaceutical Inds
DRUGS - Drug Manufacturers - Other
|
$141.70
|
-1.33
-0.93% |
$144.19
|
56,747
93.03% of 50 DAV
50 DAV is 61,000
|
$146.64
-3.37%
|
6/26/2014
|
$117.31
|
PP = $118.90
|
|
MB = $124.85
|
Most Recent Note - 7/3/2014 11:21:34 AM
G - Perched at its all-time high following 6 consecutive volume-driven gains, extended from its prior base. Disciplined investors avoid chasing stocks more than +5% above prior highs.
>>> FEATURED STOCK ARTICLE : Fundamentally Strong Stock Challenging Prior Resistance Level - 6/26/2014
View all notes |
Set NEW NOTE alert |
CANSLIM.net Company Profile |
SEC
News |
Chart |
Request a new note
C
A N
S L
I M
|
TRN
-
NYSE
Trinity Industries Inc
TRANSPORTATION - Railroads
|
$44.89
|
+0.01
0.02% |
$45.25
|
1,447,626
41.73% of 50 DAV
50 DAV is 3,469,000
|
$46.00
-2.41%
|
4/30/2014
|
$37.79
|
PP = $38.03
|
|
MB = $39.93
|
Most Recent Note - 7/2/2014 4:03:17 PM
G - Gapped up today and hit a new 52-week high with a gain on light volume, getting more extended from its prior base. Its 50 DMA line defines important near-term support to watch.
>>> FEATURED STOCK ARTICLE : Recent Lows and 50-Day Moving Average Line Define Near-Term Support - 6/16/2014
View all notes |
Set NEW NOTE alert |
CANSLIM.net Company Profile |
SEC
News |
Chart |
Request a new note
C
A N
S L
I M
|
WLK
-
NYSE
Westlake Chemical Corp
CHEMICALS - Specialty Chemicals
|
$85.66
|
+0.56
0.66% |
$85.94
|
174,842
24.70% of 50 DAV
50 DAV is 708,000
|
$85.58
0.09%
|
4/29/2014
|
$72.79
|
PP = $69.31
|
|
MB = $72.78
|
Most Recent Note - 7/3/2014 2:53:26 PM
G - Inched to another new 52-week high with today's 6th consecutive gain, getting more extended from any sound base pattern. Prior highs near $77 define important near-term support to watch on pullbacks.
>>> FEATURED STOCK ARTICLE : Chemical Firm Quietly Posted 7th Consecutive Weekly Gain - 6/13/2014
View all notes |
Set NEW NOTE alert |
CANSLIM.net Company Profile |
SEC
News |
Chart |
Request a new note
C
A N
S L
I M
|
Symbol/Exchange
Company Name
Industry Group |
PRICE |
CHANGE
(%Change) |
Day High |
Volume
(% DAV)
(% 50 day avg vol) |
52 Wk Hi
% From Hi |
Featured
Date |
Price
Featured |
Pivot Featured |
|
Max Buy |
|
|
|
THESE ARE NOT BUY RECOMMENDATIONS!
Comments contained in the body of this report are technical
opinions only. The material herein has been obtained
from sources believed to be reliable and accurate, however,
its accuracy and completeness cannot be guaranteed.
This site is not an investment advisor, hence it does
not endorse or recommend any securities or other investments.
Any recommendation contained in this report may not
be suitable for all investors and it is not to be deemed
an offer or solicitation on our part with respect to
the purchase or sale of any securities. All trademarks,
service marks and trade names appearing in this report
are the property of their respective owners, and are
likewise used for identification purposes only.
This report is a service available
only to active Paid Premium Members.
You may opt-out of receiving report notifications
at any time. Questions or comments may be submitted
by writing to Premium Membership Services 665 S.E. 10 Street, Suite 201 Deerfield Beach, FL 33441-5634 or by calling 1-800-965-8307
or 954-785-1121.
|
|
|

