You are not logged in.
This means you
CAN ONLY VIEW reports that were published prior to Tuesday, April 8, 2025.
You
MUST UPGRADE YOUR MEMBERSHIP if you want to see any current reports.
AFTER MARKET UPDATE - TUESDAY, JULY 8TH, 2014
Previous After Market Report Next After Market Report >>>
|
|
|
|
DOW |
-117.59 |
16,906.62 |
-0.69% |
|
Volume |
667,948,480 |
+14% |
|
Volume |
2,034,735,410 |
+30% |
|
NASDAQ |
-60.07 |
4,391.46 |
-1.35% |
|
Advancers |
1,199 |
38% |
|
Advancers |
554 |
18% |
|
S&P 500 |
-13.94 |
1,963.71 |
-0.70% |
|
Decliners |
1,863 |
59% |
|
Decliners |
2,402 |
79% |
|
Russell 2000 |
-14.59 |
1,172.15 |
-1.23% |
|
52 Wk Highs |
57 |
|
|
52 Wk Highs |
24 |
|
|
S&P 600 |
-6.36 |
675.63 |
-0.93% |
|
52 Wk Lows |
19 |
|
|
52 Wk Lows |
31 |
|
|
 |
Major Averages Fell With Heavier Volume
Kenneth J. Gruneisen - Passed the CAN SLIM® Master's Exam
Stocks experienced a setback on Tuesday. Volume on the session was higher than the prior session's volume totals on both the NYSE and on the Nasdaq exchange which indicated an increase in distributional selling pressure from the institutional crowd. Breadth was negative as decliners led advancers by a 3-2 margin on the NYSE and by more than a 4-1 margin on the Nasdaq exchange. Leadership was thin as there were only 6 high-ranked companies from the CANSLIM.net Leaders List that made new 52-week highs and appeared on the CANSLIM.net BreakOuts Page, down from the prior session's total of 39 stocks. New 52-week highs outnumbered new 52-week lows on the NYSE but new lows outnumbered new highs on the Nasdaq exchange. There were gains for only 2 of the 15 high-ranked companies currently included on the Featured Stocks Page. The market (M criteria) uptrend clearly came under pressure while leadership quickly evaporated. Any new buying efforts should be selective and focused in stocks meeting all key criteria of the fact-based investment system.
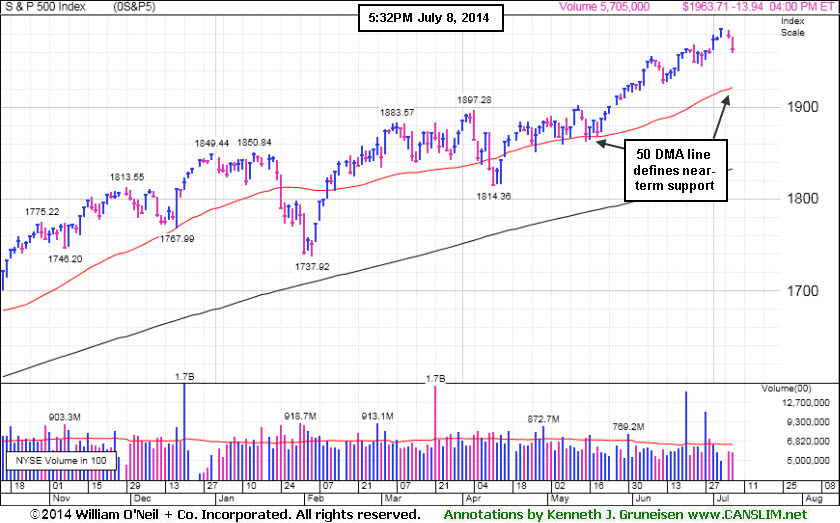
PICTURED: The S&P 500 Index is consolidating after rallying to all-time highs. Nine of the 10 S&P 500 sectors declined.
The major averages finished firmly in negative territory amid profit taking following the recent advance that pushed the Dow and S&P 500 to record levels. Investors were also cautious before Alcoa (AA +0.75%) unofficially kicked off second-quarter earnings season after the close. On the economic front, a report showed consumer borrowing jumped in May and a separate release revealed job openings unexpectedly increased to nearly a seven-year high.
The Nasdaq Composite Index retreated 60 points to 4,391, its biggest one-day loss since May. Technology weighed on the market amid a drop in internet stocks including Twitter (TWTR -7.01%) and Pandora (P -7.33%). Utilities were the lone sector to finish in positive territory as Duke Energy (DUK +1.03%) and Edison International (EIX +1.49%).
Treasuries rose and a government auction of three-year notes were sold at the highest yield since 2011. The 10-year note increased 13/32 to yield 2.56%. The 30-year bond gained a full point to yield 3.38%.
The CANSLIM.net Featured Stocks Page shows the most action-worthy candidates and their latest notes and a Headline Link directs members to the latest detailed analysis with data-packed graphs annotated by a Certified expert along with links to additional resources. The Premium Member Homepage includes "dynamic archives" to all prior pay reports published. Watch for an announcement via email concerning the next WEBCAST.
|
 Kenneth J. Gruneisen started out as a licensed stockbroker in August 1987, a couple of months prior to the historic stock market crash that took the Dow Jones Industrial Average down -22.6% in a single day. He has published daily fact-based fundamental and technical analysis on high-ranked stocks online for two decades. Through FACTBASEDINVESTING.COM, Kenneth provides educational articles, news, market commentary, and other information regarding proven investment systems that work in good times and bad.
Comments contained in the body of this report are technical opinions only and are not necessarily those of Gruneisen Growth Corp. The material herein has been obtained from sources believed to be reliable and accurate, however, its accuracy and completeness cannot be guaranteed. Our firm, employees, and customers may effect transactions, including transactions contrary to any recommendation herein, or have positions in the securities mentioned herein or options with respect thereto. Any recommendation contained in this report may not be suitable for all investors and it is not to be deemed an offer or solicitation on our part with respect to the purchase or sale of any securities. |
|
 |
Financial, Retail and Tech Indices Declined
Kenneth J. Gruneisen - Passed the CAN SLIM® Master's Exam
Financial shares were a negative influence on the major averages as the Broker/Dealer Index ($XBD -2.11%) and the Bank Index ($BKX -1.14%) both fell on Tuesday. The Retail Index ($RLX -1.28%) faced pressure and the tech sector saw unanimous losses from the Networking Index ($NWX -2.18%), Biotechnology Index ($BTK -1.94%), and the Semiconductor Index ($SOX -0.54%). Energy-related shares suffered smaller losses as the Integrated Oil Index ($XOI -0.31%) and the Oil Services Index ($OSX -0.27%) edged lower. The Gold & Silver Index ($XAU +1.17%) was a standout gainer on the mostly negative session.
Charts courtesy www.stockcharts.com
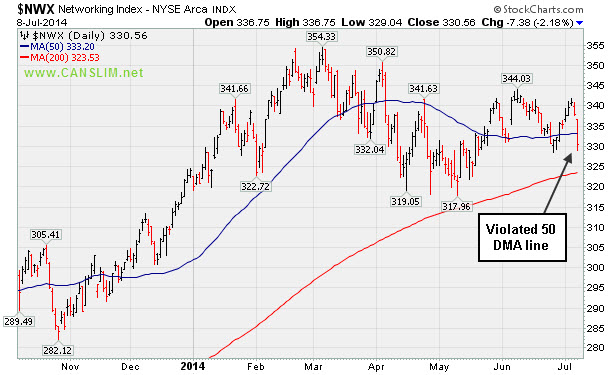
PICTURED: The Networking Index ($NWX -2.18%) violated its 50-day moving average (DMA) line with a considerable loss.
| Oil Services |
$OSX |
305.98 |
-0.83 |
-0.27% |
+8.88% |
| Integrated Oil |
$XOI |
1,671.74 |
-5.21 |
-0.31% |
+11.22% |
| Semiconductor |
$SOX |
642.64 |
-3.46 |
-0.54% |
+20.11% |
| Networking |
$NWX |
330.56 |
-7.38 |
-2.18% |
+2.04% |
| Broker/Dealer |
$XBD |
157.27 |
-3.39 |
-2.11% |
-2.05% |
| Retail |
$RLX |
894.89 |
-11.56 |
-1.28% |
-4.78% |
| Gold & Silver |
$XAU |
101.15 |
+1.17 |
+1.17% |
+20.20% |
| Bank |
$BKX |
71.09 |
-0.82 |
-1.14% |
+2.64% |
| Biotech |
$BTK |
2,740.59 |
-54.25 |
-1.94% |
+17.60% |
|
|
|
 |
Bullish Up/Down Volume and Increasing Institutional Ownership
Kenneth J. Gruneisen - Passed the CAN SLIM® Master's Exam
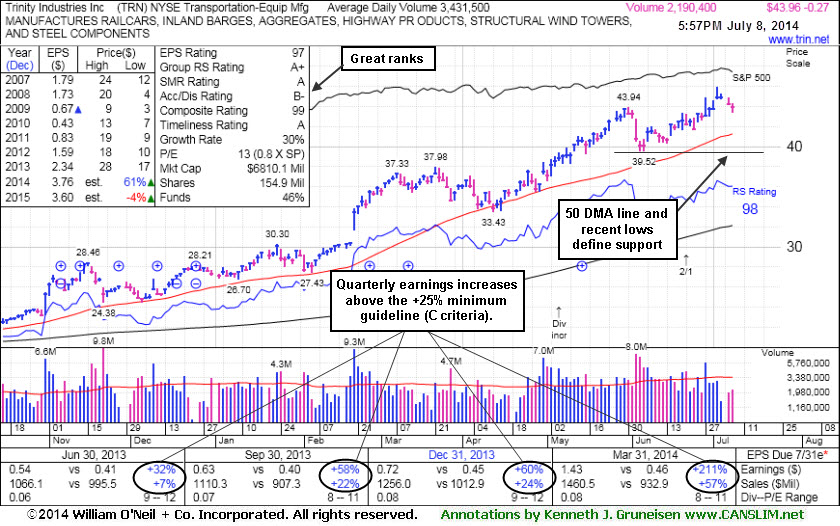
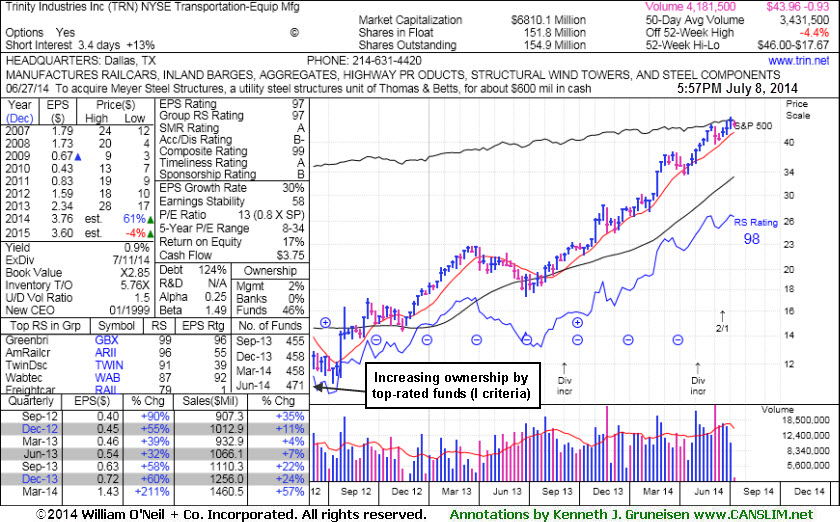
Trinity Industries Inc (TRN -$0.27 or -0.61% to $43.96) is perched near its 52-week high, extended from its prior base. Its 50-day moving average (DMA) line ($41.27) defines important near-term support to watch above its recent lows. Subsequent deterioration below those levels would raise concerns and trigger technical sell signals. The high-ranked Transportation - Equipment Manufacturing firm was last shown in this FSU section on 6/16/14 with annotated graphs under the headline, "Recent Lows and 50-Day Moving Average Line Define Near-Term Support".
TRN traded up as much as +20.9% since first highlighted in yellow in the 4/30/14 mid-day report report (read here). Disciplined investors avoid chasing stocks extended more than +5% above prior highs and they always limit losses by selling any stock that falls more than -7% from their purchase price.
It has earned high ranks and reported earnings +213% on +57% sales revenues for the Mar '14 quarter. Prior quarterly comparisons were above the +25% minimum earnings guideline (C criteria). Annual earnings (A criteria) have improved following a downturn in FY '08-10. The number of top-rated funds owning its shares rose from 455 in Sep '13 to 471 in Jun '14, a reassuring sign concerning the I criteria. Its current Up/Down Volume Ratio of 1.5 is an unbiased indication that its shares have been under accumulation over the past 50 days. Its supply of shares outstanding (S criteria) was doubled as a 2:1 split was effective as of 6/20/14.
|
|
|
Color Codes Explained :
Y - Better candidates highlighted by our
staff of experts.
G - Previously featured
in past reports as yellow but may no longer be buyable under the
guidelines.
***Last / Change / Volume data in this table is the closing quote data***
Symbol/Exchange
Company Name
Industry Group |
PRICE |
CHANGE
(%Change) |
Day High |
Volume
(% DAV)
(% 50 day avg vol) |
52 Wk Hi
% From Hi |
Featured
Date |
Price
Featured |
Pivot Featured |
|
Max Buy |
ACT
-
NYSE
Actavis plc
Medical-Generic Drugs
|
$216.89
|
-3.88
-1.76% |
$220.81
|
3,289,620
143.65% of 50 DAV
50 DAV is 2,290,000
|
$230.77
-6.01%
|
6/20/2014
|
$216.53
|
PP = $230.87
|
|
MB = $242.41
|
Most Recent Note - 7/7/2014 4:33:29 PM
Y - Still hovering within close striking distance of its 52-week high. Subsequent volume-driven gains to new highs may trigger a technical buy signal.
>>> FEATURED STOCK ARTICLE : Volume Above Average as Generic Drug Firm Approaches Highs - 6/24/2014
View all notes |
Set NEW NOTE alert |
CANSLIM.net Company Profile |
SEC
News |
Chart |
Request a new note
C
A N
S L
I M


|
AFSI
-
NASDAQ
Amtrust Financial Svcs
INSURANCE - Property and; Casualty Insurance
|
$41.33
|
-0.74
-1.76% |
$42.21
|
376,107
53.40% of 50 DAV
50 DAV is 704,300
|
$47.10
-12.25%
|
5/21/2014
|
$44.85
|
PP = $44.85
|
|
MB = $47.09
|
Most Recent Note - 7/7/2014 11:58:46 AM
G - Slumping below its 50 DMA line with heavier volume behind today's loss. Faces some resistance due to overhead supply up through the $47 level.
>>> FEATURED STOCK ARTICLE : Found Support Near 50-Day Average and Relative Strength Slightly Improved - 7/1/2014
View all notes |
Set NEW NOTE alert |
CANSLIM.net Company Profile |
SEC
News |
Chart |
Request a new note
C
A N
S L
I M
|
AL
-
NYSE
Air Lease Corp Cl A
DIVERSIFIED SERVICES - Rental and Leasing Services
|
$36.73
|
-0.86
-2.29% |
$37.52
|
1,720,508
162.77% of 50 DAV
50 DAV is 1,057,000
|
$42.89
-14.36%
|
5/9/2014
|
$38.27
|
PP = $38.25
|
|
MB = $40.16
|
Most Recent Note - 7/7/2014 4:35:01 PM
G - Slumped further below its 50 DMA line today. A subsequent violation of its recent low ($36.55 on 6/13/17) would raise more serious concerns and trigger a worrisome technical sell signal.
>>> FEATURED STOCK ARTICLE : Finding Support Near 50-Day Moving Average Line - 7/2/2014
View all notes |
Set NEW NOTE alert |
CANSLIM.net Company Profile |
SEC
News |
Chart |
Request a new note
C
A N
S L
I M
|
BITA
-
NYSE
Bitauto Hldgs Ltd Ads
Internet-Content
|
$46.05
|
-3.41
-6.89% |
$49.40
|
2,472,505
270.81% of 50 DAV
50 DAV is 913,000
|
$49.67
-7.29%
|
6/26/2014
|
$46.20
|
PP = $47.03
|
|
MB = $49.38
|
 Most Recent Note - 7/8/2014 12:25:36 PM
Y - Down considerably today with above average volume amid widespread weakness in China-based companies. Prior highs near $46 define initial support to watch. Color code is changed to yellow after the pullback. Keep in mind that odds are far more favorable for investors who buy while stocks are rising, rather than accumulating on pullbacks.
>>> FEATURED STOCK ARTICLE : Perched At High With No Resistance Remaining Due to Overhead Supply - 6/27/2014
View all notes |
Set NEW NOTE alert |
CANSLIM.net Company Profile |
SEC
News |
Chart |
Request a new note
C
A N
S L
I M
|
BWLD
-
NASDAQ
Buffalo Wild Wings Inc
LEISURE - Restaurants
|
$156.96
|
-1.63
-1.03% |
$159.44
|
553,712
121.69% of 50 DAV
50 DAV is 455,000
|
$167.36
-6.21%
|
6/19/2014
|
$158.52
|
PP = $159.91
|
|
MB = $167.91
|
Most Recent Note - 7/8/2014 12:40:06 PM
Y - Pulling back today amid widespread weakness. Deterioration leading to a close below the prior high close ($156.35 on 3/21/14) would raise greater concerns and completely negate the recent technical breakout.
>>> FEATURED STOCK ARTICLE : Perched Near Highs With Strong Fundamentals - 6/19/2014
View all notes |
Set NEW NOTE alert |
CANSLIM.net Company Profile |
SEC
News |
Chart |
Request a new note
C
A N
S L
I M
|
Symbol/Exchange
Company Name
Industry Group |
PRICE |
CHANGE
(%Change) |
Day High |
Volume
(% DAV)
(% 50 day avg vol) |
52 Wk Hi
% From Hi |
Featured
Date |
Price
Featured |
Pivot Featured |
|
Max Buy |
EQM
-
NYSE
E Q T Midstream Partners
ENERGY - Oil and Gas Pipelines
|
$92.69
|
+0.28
0.30% |
$93.42
|
203,190
47.59% of 50 DAV
50 DAV is 427,000
|
$102.51
-9.58%
|
12/12/2013
|
$53.17
|
PP = $56.51
|
|
MB = $59.34
|
Most Recent Note - 7/2/2014 3:59:51 PM
G - Stubbornly holding its ground near its all-time high. Strength has continued despite fundamental flaws repeatedly noted.
>>> FEATURED STOCK ARTICLE : Strength Continued Despite Fundamental Flaws - 6/25/2014
View all notes |
Set NEW NOTE alert |
CANSLIM.net Company Profile |
SEC
News |
Chart |
Request a new note
C
A N
S L
I M
|
GRFS
-
NASDAQ
Grifols Sa Ads
Medical-Ethical Drugs
|
$40.77
|
-1.33
-3.16% |
$41.82
|
1,028,426
150.14% of 50 DAV
50 DAV is 685,000
|
$46.66
-12.62%
|
5/15/2014
|
$41.14
|
PP = $43.55
|
|
MB = $45.73
|
Most Recent Note - 7/8/2014 6:25:17 PM
G - Slumped further below its 50 DMA line with today's 4th consecutive loss on higher volume. Disciplined investors always limit losses by selling any stock that falls more than -7% from their purchase price.
>>> FEATURED STOCK ARTICLE : Consolidating Just Below "Max Buy" Level - 6/17/2014
View all notes |
Set NEW NOTE alert |
CANSLIM.net Company Profile |
SEC
News |
Chart |
Request a new note
C
A N
S L
I M
|
HF
-
NYSE
H F F Inc Cl A
REAL ESTATE - Property Management/Developmen
|
$36.41
|
-1.43
-3.78% |
$37.65
|
200,692
102.92% of 50 DAV
50 DAV is 195,000
|
$38.23
-4.76%
|
6/20/2014
|
$34.60
|
PP = $36.16
|
|
MB = $37.97
|
Most Recent Note - 7/8/2014 6:20:09 PM
Y - Finished near the session low with a loss on average volume. Color code is changed to yellow after retreating below its "max buy" level. Prior highs in the $35-36 area define initial support to watch on pullbacks.
>>> FEATURED STOCK ARTICLE : Approached 52-Week High With Volume-Driven Gain - 6/23/2014
View all notes |
Set NEW NOTE alert |
CANSLIM.net Company Profile |
SEC
News |
Chart |
Request a new note
C
A N
S L
I M
|
ICON
-
NASDAQ
Iconix Brand Group Inc
CONSUMER NON-DURABLES - Textile - Apparel Footwear
|
$42.26
|
-0.45
-1.05% |
$42.73
|
347,690
62.76% of 50 DAV
50 DAV is 554,000
|
$44.81
-5.69%
|
6/5/2014
|
$43.54
|
PP = $43.44
|
|
MB = $45.61
|
Most Recent Note - 7/8/2014 6:22:48 PM
Y - Small loss on light volume today led to a close just below its 50 DMA line ($42.44). More damaging losses would raise greater concerns.
>>> FEATURED STOCK ARTICLE : Found Support Above Prior Highs During Consolidation - 6/18/2014
View all notes |
Set NEW NOTE alert |
CANSLIM.net Company Profile |
SEC
News |
Chart |
Request a new note
C
A N
S L
I M
|
KS
-
NYSE
Kapstone Paper&Packaging
MANUFACTURING - Paper and Packaging
|
$28.96
|
-1.59
-5.20% |
$30.18
|
3,670,336
380.74% of 50 DAV
50 DAV is 964,000
|
$34.43
-15.89%
|
6/20/2014
|
$32.30
|
PP = $31.92
|
|
MB = $33.52
|
Most Recent Note - 7/8/2014 1:25:44 PM
Down considerably today with heavy volume behind its 3rd big loss in the span of 4 sessions, violating its 50 DMA line and triggering a technical sell signal. Only a prompt rebound above its 50 DMA line would help its outlook improve. Disciplined investors limit losses by selling any stock that falls more than -7% from their purchase price. It will be dropped from the Featured Stocks list today due to technical deterioration.
>>> FEATURED STOCK ARTICLE : Four Times Average Volume Behind Big Breakout Gain - 6/20/2014
View all notes |
Set NEW NOTE alert |
CANSLIM.net Company Profile |
SEC
News |
Chart |
Request a new note
C
A N
S L
I M
|
Symbol/Exchange
Company Name
Industry Group |
PRICE |
CHANGE
(%Change) |
Day High |
Volume
(% DAV)
(% 50 day avg vol) |
52 Wk Hi
% From Hi |
Featured
Date |
Price
Featured |
Pivot Featured |
|
Max Buy |
PANW
-
NYSE
Palo Alto Networks
Computer Sftwr-Security
|
$75.36
|
-4.21
-5.29% |
$79.56
|
3,597,014
195.70% of 50 DAV
50 DAV is 1,838,000
|
$85.78
-12.15%
|
5/29/2014
|
$75.95
|
PP = $72.50
|
|
MB = $76.13
|
Most Recent Note - 7/8/2014 1:27:25 PM
G - Down considerably today on above average volume. On the prior session it was noted as it finished near the session low and below its 3/18/14 closing price ($79.82) raising some concerns.
>>> FEATURED STOCK ARTICLE : Gap Up Gain on Above Average Volume for New Highs - 6/30/2014
View all notes |
Set NEW NOTE alert |
CANSLIM.net Company Profile |
SEC
News |
Chart |
Request a new note
C
A N
S L
I M
|
SN
-
NYSE
Sanchez Energy Corp
ENERGY - Independent Oil and Gas
|
$34.84
|
-0.54
-1.53% |
$35.38
|
1,633,538
105.32% of 50 DAV
50 DAV is 1,551,000
|
$38.95
-10.55%
|
5/22/2014
|
$33.00
|
PP = $31.59
|
|
MB = $33.17
|
Most Recent Note - 7/3/2014 2:16:04 PM
G - Extended from its prior base with volume totals cooling. Its 50 DMA line ($32.51) and prior highs near $32 define support to watch on pullbacks. See the latest FSU analysis for more details and new annotated graphs.
>>> FEATURED STOCK ARTICLE : Recently Featured Stock Outpaced Benchmark S&P 500 Index - 7/3/2014
View all notes |
Set NEW NOTE alert |
CANSLIM.net Company Profile |
SEC
News |
Chart |
Request a new note
C
A N
S L
I M
|
TARO
-
NYSE
Taro Pharmaceutical Inds
DRUGS - Drug Manufacturers - Other
|
$145.45
|
+3.68
2.60% |
$145.97
|
105,848
170.72% of 50 DAV
50 DAV is 62,000
|
$146.64
-0.81%
|
6/26/2014
|
$117.31
|
PP = $118.90
|
|
MB = $124.85
|
Most Recent Note - 7/8/2014 1:09:04 PM
G - Perched near its all-time high and stubbornly holding its ground following considerable volume-driven gains, extended from its prior base. Disciplined investors avoid chasing stocks more than +5% above prior highs.
>>> FEATURED STOCK ARTICLE : Fundamentally Strong Stock Challenging Prior Resistance Level - 6/26/2014
View all notes |
Set NEW NOTE alert |
CANSLIM.net Company Profile |
SEC
News |
Chart |
Request a new note
C
A N
S L
I M
|
TRN
-
NYSE
Trinity Industries Inc
TRANSPORTATION - Railroads
|
$43.96
|
-0.27
-0.61% |
$44.28
|
2,190,470
63.84% of 50 DAV
50 DAV is 3,431,000
|
$46.00
-4.43%
|
4/30/2014
|
$37.79
|
PP = $38.03
|
|
MB = $39.93
|
Most Recent Note - 7/8/2014 6:18:09 PM
G - Consolidating near its 52-week high, extended from its prior base. Its 50 DMA line defines important near-term support to watch. See the latest FSU analysis for more details and new annotated graphs.
>>> FEATURED STOCK ARTICLE : Bullish Up/Down Volume and Increasing Institutional Ownership - 7/8/2014
View all notes |
Set NEW NOTE alert |
CANSLIM.net Company Profile |
SEC
News |
Chart |
Request a new note
C
A N
S L
I M
|
WLK
-
NYSE
Westlake Chemical Corp
CHEMICALS - Specialty Chemicals
|
$84.22
|
-0.78
-0.92% |
$84.99
|
627,716
89.16% of 50 DAV
50 DAV is 704,000
|
$85.94
-2.00%
|
4/29/2014
|
$72.79
|
PP = $69.31
|
|
MB = $72.78
|
Most Recent Note - 7/7/2014 5:56:05 PM
G - Perched at its 52-week high, extended from any sound base pattern. Its 50 DMA line defines important near-term support to watch on pullbacks. See the latest FSU analysis for more details and new annotated graphs.
>>> FEATURED STOCK ARTICLE : Great Ranks and Reassuring Leadership in Chemical Group - 7/7/2014
View all notes |
Set NEW NOTE alert |
CANSLIM.net Company Profile |
SEC
News |
Chart |
Request a new note
C
A N
S L
I M
|
Symbol/Exchange
Company Name
Industry Group |
PRICE |
CHANGE
(%Change) |
Day High |
Volume
(% DAV)
(% 50 day avg vol) |
52 Wk Hi
% From Hi |
Featured
Date |
Price
Featured |
Pivot Featured |
|
Max Buy |
|
|
|
THESE ARE NOT BUY RECOMMENDATIONS!
Comments contained in the body of this report are technical
opinions only. The material herein has been obtained
from sources believed to be reliable and accurate, however,
its accuracy and completeness cannot be guaranteed.
This site is not an investment advisor, hence it does
not endorse or recommend any securities or other investments.
Any recommendation contained in this report may not
be suitable for all investors and it is not to be deemed
an offer or solicitation on our part with respect to
the purchase or sale of any securities. All trademarks,
service marks and trade names appearing in this report
are the property of their respective owners, and are
likewise used for identification purposes only.
This report is a service available
only to active Paid Premium Members.
You may opt-out of receiving report notifications
at any time. Questions or comments may be submitted
by writing to Premium Membership Services 665 S.E. 10 Street, Suite 201 Deerfield Beach, FL 33441-5634 or by calling 1-800-965-8307
or 954-785-1121.
|
|
|

