You are not logged in.
This means you
CAN ONLY VIEW reports that were published prior to Monday, April 14, 2025.
You
MUST UPGRADE YOUR MEMBERSHIP if you want to see any current reports.
AFTER MARKET UPDATE - WEDNESDAY, JULY 2ND, 2014
Previous After Market Report Next After Market Report >>>
|
|
|
|
DOW |
+20.17 |
16,976.24 |
+0.12% |
|
Volume |
583,475,790 |
-13% |
|
Volume |
1,486,449,030 |
-17% |
|
NASDAQ |
-0.92 |
4,457.73 |
-0.02% |
|
Advancers |
1,133 |
36% |
|
Advancers |
1,219 |
43% |
|
S&P 500 |
+1.30 |
1,974.62 |
+0.07% |
|
Decliners |
1,939 |
61% |
|
Decliners |
1,525 |
54% |
|
Russell 2000 |
-6.39 |
1,199.56 |
-0.53% |
|
52 Wk Highs |
189 |
|
|
52 Wk Highs |
109 |
|
|
S&P 600 |
-3.95 |
686.93 |
-0.57% |
|
52 Wk Lows |
8 |
|
|
52 Wk Lows |
16 |
|
|
 |
Major Averages Finished Little Changed With Lighter Volume Totals
Kenneth J. Gruneisen - Passed the CAN SLIM® Master's Exam
The major averages were little changed on Wednesday. The volume was reported lighter than the prior session totals on both the NYSE and on the Nasdaq exchange. Breadth was negative as decliners led advancers by more than a 3-2 margin on the NYSE and by a 5-4 margin on the Nasdaq exchange. There were 59 high-ranked companies from the CANSLIM.net Leaders List that made new 52-week highs and appeared on the CANSLIM.net BreakOuts Page, down from the prior session's total of 106 stocks. New 52-week highs contracted yet still easily outnumbered new 52-week lows on the NYSE and on the Nasdaq exchange. There were gains for only 4 of the 15 high-ranked companies currently included on the Featured Stocks Page. The S&P 500 Index and Dow Jones Industrial Average recently surged into new high territory with healthy leadership (new 52-week highs) sending a reassuring signal that the market direction (M criteria) is in a "confirmed uptrend". Any new buying efforts should be selective and focused in stocks meeting all key criteria of the fact-based investment system.
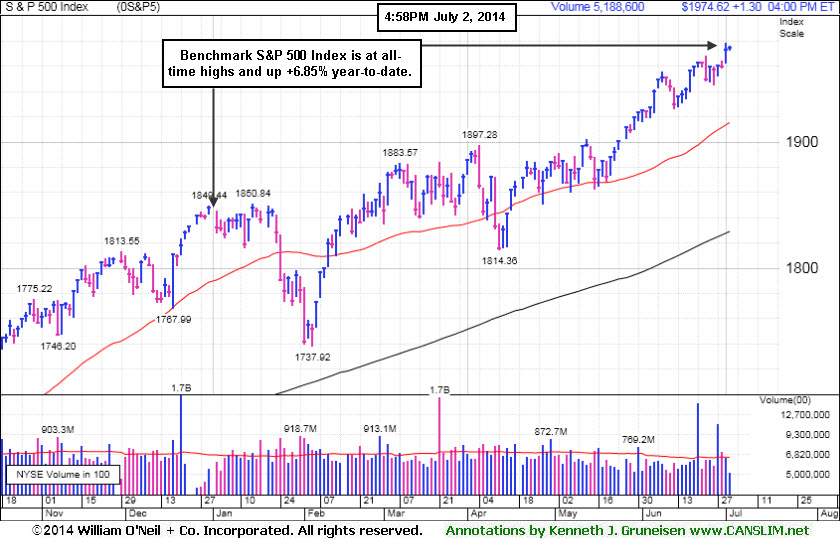
PICTURED: The benchmark S&P 500 Index is at an all-time high and up +6.85% year-to-date.
The major averages spent the session trading in a narrow range following Tuesday's rally. Investors appeared cautious ahead of the Thursday jobs report even after ADP said private payrolls unexpectedly rose 281,000 in June. Projections are that non-farm payrolls increased 215,000 last month and the unemployment rate held steady at 6.3%. Gains were also limited following commentary from Fed Chair Janet Yellen who suggested monetary policy has limitations in promoting financial stability.
On the earnings front, Constellation Brands (STZ +2.3%) rose after the spirits maker reported better-than-expected profits and increased its full-year outlook. Shares of Paychex (PAYX -2.3%) following its in-line quarterly results.
Health care and telecom were the best performing sectors on the session as Pfizer (PFE +1%) and Verizon (VZ +0.6%) were higher. Utilities were down the most with an index of companies in the S&P 500 falling more than -1.9%. Exelon (EXC -3.1%) and Duke Energy (DUK -1.9%) paced the group's decline.
Treasuries retreated with the 10-year note down 16/32 to yield 2.62%.
The CANSLIM.net Featured Stocks Page shows the most action-worthy candidates and their latest notes and a Headline Link directs members to the latest detailed analysis with data-packed graphs annotated by a Certified expert along with links to additional resources. The Premium Member Homepage includes "dynamic archives" to all prior pay reports published. Watch for an announcement via email concerning the next WEBCAST.
|
 Kenneth J. Gruneisen started out as a licensed stockbroker in August 1987, a couple of months prior to the historic stock market crash that took the Dow Jones Industrial Average down -22.6% in a single day. He has published daily fact-based fundamental and technical analysis on high-ranked stocks online for two decades. Through FACTBASEDINVESTING.COM, Kenneth provides educational articles, news, market commentary, and other information regarding proven investment systems that work in good times and bad.
Comments contained in the body of this report are technical opinions only and are not necessarily those of Gruneisen Growth Corp. The material herein has been obtained from sources believed to be reliable and accurate, however, its accuracy and completeness cannot be guaranteed. Our firm, employees, and customers may effect transactions, including transactions contrary to any recommendation herein, or have positions in the securities mentioned herein or options with respect thereto. Any recommendation contained in this report may not be suitable for all investors and it is not to be deemed an offer or solicitation on our part with respect to the purchase or sale of any securities. |
|
 |
Tech Indices and Gold & Silver Index Rose
Kenneth J. Gruneisen - Passed the CAN SLIM® Master's Exam
The tech sector saw modes gains from the Semiconductor Index ($SOX +0.17%), Biotechnology Index ($BTK +0.26%), and the Networking Index ($NWX +0.57%). The Broker/Dealer Index ($XBD -0.39%) and the Bank Index ($BKX -0.14%) edged lower while the Retail Index ($RLX +0.06%) finished flat on Wednesday. Energy-related shares had a slightly negative bias as the Oil Services Index ($OSX -0.36%) and the Integrated Oil Index ($XOI -0.19%) tallied small losses. The Gold & Silver Index ($XAU +1.39%) was a standout gainer on the mostlyu quiet session.
Charts courtesy www.stockcharts.com
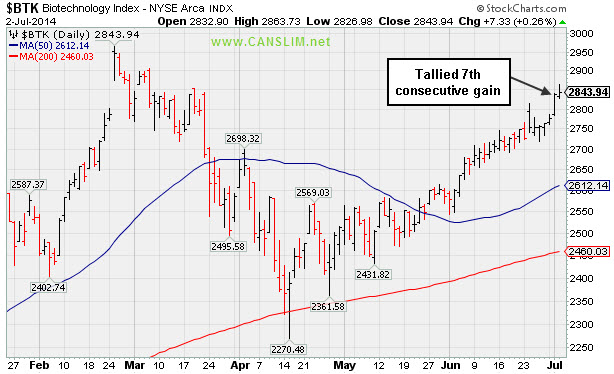
PICTURED: The Biotechnology Index ($BTK +0.26%) tallied its 7th consecutive gain.
| Oil Services |
$OSX |
309.60 |
-1.12 |
-0.36% |
+10.17% |
| Integrated Oil |
$XOI |
1,683.99 |
-3.13 |
-0.19% |
+12.03% |
| Semiconductor |
$SOX |
645.78 |
+1.07 |
+0.17% |
+20.70% |
| Networking |
$NWX |
339.57 |
+1.91 |
+0.57% |
+4.82% |
| Broker/Dealer |
$XBD |
160.31 |
-0.64 |
-0.39% |
-0.16% |
| Retail |
$RLX |
902.83 |
+0.55 |
+0.06% |
-3.93% |
| Gold & Silver |
$XAU |
101.34 |
+1.39 |
+1.39% |
+20.43% |
| Bank |
$BKX |
71.65 |
-0.10 |
-0.14% |
+3.45% |
| Biotech |
$BTK |
2,843.94 |
+7.33 |
+0.26% |
+22.03% |
|
|
|
 |
Finding Support Near 50-Day Moving Average Line
Kenneth J. Gruneisen - Passed the CAN SLIM® Master's Exam
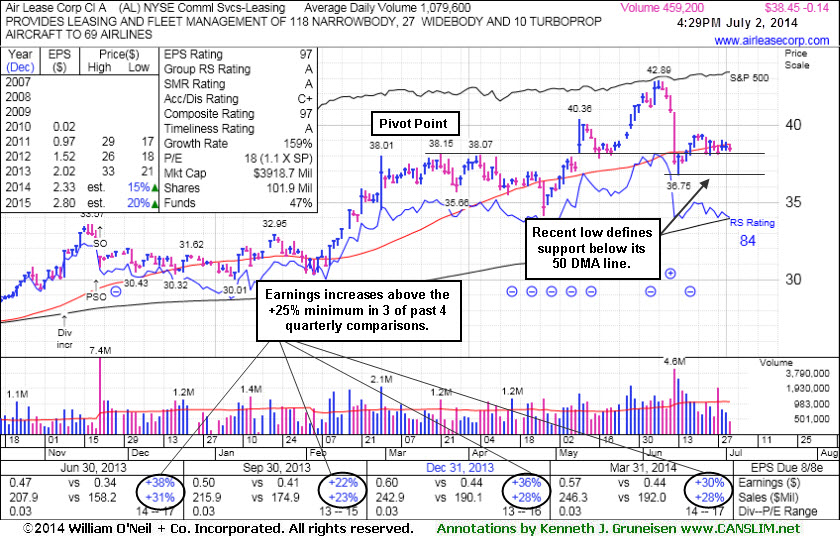
Air Lease Corp (AL -$0.14 or -0.36% to $38.45) is consolidating near its 50-day moving average (DMA) line ($38.76). A subsequent violation of its recent low ($36.55 on 6/13/17) would raise more serious concerns and trigger a worrisome technical sell signal. After last shown in this FSU section on 6/11/14 with an annotated graph under the headline, "Enduring Mild Distributional Pressure on Pullback", it pulled back with higher volume indicative of heavy distributional pressure. Disciplined investors limit losses by always selling if any stock falls more than -7% from their purchase price.
Its earnings Per Share Rank is 97, well above the 80+ minimum for buy candidates. Its Relative Strength Rating of 84 is above the 80+ minimum guideline. The Commercial Services - Leasing firm was highlighted in yellow with pivot point based on its 3/21/14 high plus 10 cents in the 5/09/14 mid-day report (read here) when its gain backed by +119% above average volume clinched a convincing technical buy signal.
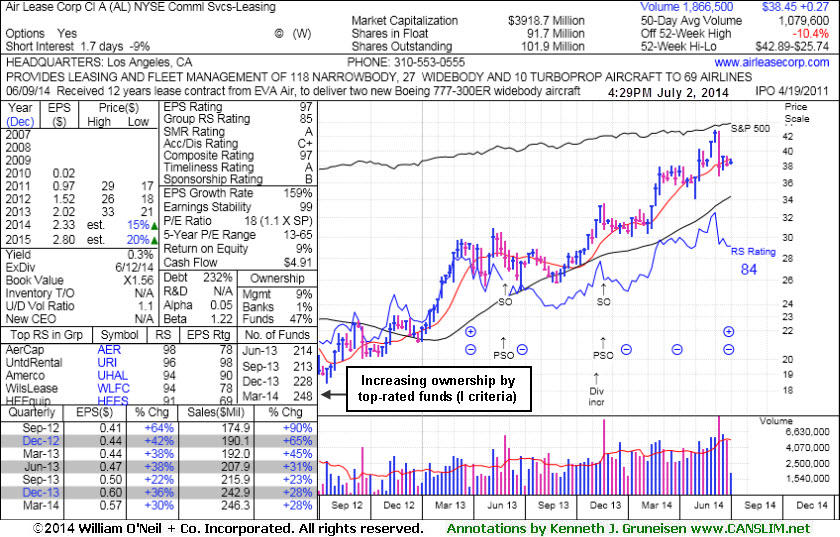
It reported earnings +30% on +28% sales revenues for the Mar '14 quarter, and 3 of the past 4 quarterly comparisons showed earnings increases above the +25% minimum guideline (C criteria). It completed a Secondary Offering on 11/21/13 and an earlier Secondary Offering on 5/31/13. The Commercial Services - Leasing firm has seen the number of top-rated funds owning its shares rise from 177 in Sep '12 to 248 in Mar '14, which is reassuring concerning the I criteria.
|
|
|
Color Codes Explained :
Y - Better candidates highlighted by our
staff of experts.
G - Previously featured
in past reports as yellow but may no longer be buyable under the
guidelines.
***Last / Change / Volume data in this table is the closing quote data***
Symbol/Exchange
Company Name
Industry Group |
PRICE |
CHANGE
(%Change) |
Day High |
Volume
(% DAV)
(% 50 day avg vol) |
52 Wk Hi
% From Hi |
Featured
Date |
Price
Featured |
Pivot Featured |
|
Max Buy |
ACT
-
NYSE
Actavis plc
Medical-Generic Drugs
|
$221.70
|
-2.30
-1.03% |
$226.00
|
3,098,613
135.43% of 50 DAV
50 DAV is 2,288,000
|
$230.77
-3.93%
|
6/20/2014
|
$216.53
|
PP = $230.87
|
|
MB = $242.41
|
Most Recent Note - 7/1/2014 12:00:36 PM
Y - Small gap up today challenging its 52-week high. Subsequent volume-driven gains to new highs may trigger a technical buy signal.
>>> FEATURED STOCK ARTICLE : Volume Above Average as Generic Drug Firm Approaches Highs - 6/24/2014
View all notes |
Set NEW NOTE alert |
CANSLIM.net Company Profile |
SEC
News |
Chart |
Request a new note
C
A N
S L
I M


|
AFSI
-
NASDAQ
Amtrust Financial Svcs
INSURANCE - Property and; Casualty Insurance
|
$42.29
|
-0.16
-0.38% |
$42.88
|
733,140
107.50% of 50 DAV
50 DAV is 682,000
|
$47.10
-10.21%
|
5/21/2014
|
$44.85
|
PP = $44.85
|
|
MB = $47.09
|
 Most Recent Note - 7/2/2014 12:10:09 PM
G - Relative Strength rating improved to 82 and it has been finding support near its 50 DMA line. Faces some resistance due to overhead supply up through the $47 level. See the latest FSU analysis for more details and annotated graphs.
>>> FEATURED STOCK ARTICLE : Found Support Near 50-Day Average and Relative Strength Slightly Improved - 7/1/2014
View all notes |
Set NEW NOTE alert |
CANSLIM.net Company Profile |
SEC
News |
Chart |
Request a new note
C
A N
S L
I M
|
AL
-
NYSE
Air Lease Corp Cl A
DIVERSIFIED SERVICES - Rental and Leasing Services
|
$38.45
|
-0.14
-0.36% |
$38.79
|
486,275
45.07% of 50 DAV
50 DAV is 1,079,000
|
$42.89
-10.35%
|
5/9/2014
|
$38.27
|
PP = $38.25
|
|
MB = $40.16
|
Most Recent Note - 7/2/2014 5:22:54 PM
G - Consolidating near its 50 DMA line ($38.76). A subsequent violation of its recent low ($36.55 on 6/13/17) would raise more serious concerns and trigger a worrisome technical sell signal. See the latest FSU analysis for more details and new annotated graphs.
>>> FEATURED STOCK ARTICLE : Finding Support Near 50-Day Moving Average Line - 7/2/2014
View all notes |
Set NEW NOTE alert |
CANSLIM.net Company Profile |
SEC
News |
Chart |
Request a new note
C
A N
S L
I M
|
BITA
-
NYSE
Bitauto Hldgs Ltd Ads
Internet-Content
|
$47.33
|
-0.35
-0.73% |
$48.48
|
707,565
75.84% of 50 DAV
50 DAV is 933,000
|
$49.20
-3.80%
|
6/26/2014
|
$46.20
|
PP = $47.03
|
|
MB = $49.38
|
Most Recent Note - 6/30/2014 11:54:54 AM
Y - Hit a new 52-week high and rallied above its pivot point with above average volume behind today's 4th consecutive gain. See the latest FSU analysis for more details and annotated graphs. The 6/26/14 mid-day report (read here) noted - "A gain above the pivot point backed by at least +40% above average volume could trigger a technical buy signal."
>>> FEATURED STOCK ARTICLE : Perched At High With No Resistance Remaining Due to Overhead Supply - 6/27/2014
View all notes |
Set NEW NOTE alert |
CANSLIM.net Company Profile |
SEC
News |
Chart |
Request a new note
C
A N
S L
I M
|
BWLD
-
NASDAQ
Buffalo Wild Wings Inc
LEISURE - Restaurants
|
$160.83
|
-4.16
-2.52% |
$163.80
|
678,923
151.88% of 50 DAV
50 DAV is 447,000
|
$167.36
-3.90%
|
6/19/2014
|
$158.52
|
PP = $159.91
|
|
MB = $167.91
|
Most Recent Note - 7/2/2014 12:18:20 PM
Y - Gapped down today while retreating from its 52-week high. Disciplined investors avoid chasing stocks more than +5% above prior highs and always limit losses by selling any stock that falls more than -7% from their purchase price.
>>> FEATURED STOCK ARTICLE : Perched Near Highs With Strong Fundamentals - 6/19/2014
View all notes |
Set NEW NOTE alert |
CANSLIM.net Company Profile |
SEC
News |
Chart |
Request a new note
C
A N
S L
I M
|
Symbol/Exchange
Company Name
Industry Group |
PRICE |
CHANGE
(%Change) |
Day High |
Volume
(% DAV)
(% 50 day avg vol) |
52 Wk Hi
% From Hi |
Featured
Date |
Price
Featured |
Pivot Featured |
|
Max Buy |
EQM
-
NYSE
E Q T Midstream Partners
ENERGY - Oil and Gas Pipelines
|
$96.96
|
-0.29
-0.30% |
$97.42
|
133,559
31.50% of 50 DAV
50 DAV is 424,000
|
$102.51
-5.41%
|
12/12/2013
|
$53.17
|
PP = $56.51
|
|
MB = $59.34
|
Most Recent Note - 7/2/2014 3:59:51 PM
G - Stubbornly holding its ground near its all-time high. Strength has continued despite fundamental flaws repeatedly noted.
>>> FEATURED STOCK ARTICLE : Strength Continued Despite Fundamental Flaws - 6/25/2014
View all notes |
Set NEW NOTE alert |
CANSLIM.net Company Profile |
SEC
News |
Chart |
Request a new note
C
A N
S L
I M
|
GRFS
-
NASDAQ
Grifols Sa Ads
Medical-Ethical Drugs
|
$44.06
|
-0.41
-0.92% |
$44.64
|
357,822
51.63% of 50 DAV
50 DAV is 693,000
|
$46.66
-5.57%
|
5/15/2014
|
$41.14
|
PP = $43.55
|
|
MB = $45.73
|
Most Recent Note - 6/27/2014 5:06:01 PM
Y - Halted its slide today with a small gain on light volume. Subsequent deterioration below its 50 DMA line would raise more serious concerns. Disciplined investors always limit losses by selling any stock that falls more than -7% from their purchase price. Keep in mind that any stock which is sold can be bought again later if strength returns.
>>> FEATURED STOCK ARTICLE : Consolidating Just Below "Max Buy" Level - 6/17/2014
View all notes |
Set NEW NOTE alert |
CANSLIM.net Company Profile |
SEC
News |
Chart |
Request a new note
C
A N
S L
I M
|
HF
-
NYSE
H F F Inc Cl A
REAL ESTATE - Property Management/Developmen
|
$37.17
|
+0.09
0.24% |
$37.41
|
175,713
91.04% of 50 DAV
50 DAV is 193,000
|
$37.58
-1.09%
|
6/20/2014
|
$34.60
|
PP = $36.16
|
|
MB = $37.97
|
Most Recent Note - 6/27/2014 1:00:05 PM
Y - Hitting another new 52-week high with a gain today following 4 volume-driven gains in the span of 5 sessions. Its solid gain above its pivot point on the prior session with +73% above average volume triggered a technical buy signal.
>>> FEATURED STOCK ARTICLE : Approached 52-Week High With Volume-Driven Gain - 6/23/2014
View all notes |
Set NEW NOTE alert |
CANSLIM.net Company Profile |
SEC
News |
Chart |
Request a new note
C
A N
S L
I M
|
ICON
-
NASDAQ
Iconix Brand Group Inc
CONSUMER NON-DURABLES - Textile - Apparel Footwear
|
$42.79
|
-0.40
-0.93% |
$43.04
|
264,143
46.67% of 50 DAV
50 DAV is 566,000
|
$44.81
-4.51%
|
6/5/2014
|
$43.54
|
PP = $43.44
|
|
MB = $45.61
|
Most Recent Note - 6/27/2014 5:08:32 PM
Y - Small gain today with above average volume while consolidating above its 50 DMA line ($41.93) and prior highs in the $43-42 area defining important support to watch.
>>> FEATURED STOCK ARTICLE : Found Support Above Prior Highs During Consolidation - 6/18/2014
View all notes |
Set NEW NOTE alert |
CANSLIM.net Company Profile |
SEC
News |
Chart |
Request a new note
C
A N
S L
I M
|
KS
-
NYSE
Kapstone Paper&Packaging
MANUFACTURING - Paper and Packaging
|
$31.97
|
-1.38
-4.14% |
$33.44
|
1,550,266
167.23% of 50 DAV
50 DAV is 927,000
|
$34.43
-7.14%
|
6/20/2014
|
$32.30
|
PP = $31.92
|
|
MB = $33.52
|
Most Recent Note - 7/2/2014 3:56:52 PM
Y - Pulling back today toward prior highs near $32 defining initial support to watch on pullbacks. Held its ground stubbornly since highlighted in yellow while rallying from a "cup-with-handle" base in the 6/20/14 mid-day report (read here).
>>> FEATURED STOCK ARTICLE : Four Times Average Volume Behind Big Breakout Gain - 6/20/2014
View all notes |
Set NEW NOTE alert |
CANSLIM.net Company Profile |
SEC
News |
Chart |
Request a new note
C
A N
S L
I M
|
Symbol/Exchange
Company Name
Industry Group |
PRICE |
CHANGE
(%Change) |
Day High |
Volume
(% DAV)
(% 50 day avg vol) |
52 Wk Hi
% From Hi |
Featured
Date |
Price
Featured |
Pivot Featured |
|
Max Buy |
PANW
-
NYSE
Palo Alto Networks
Computer Sftwr-Security
|
$81.87
|
-0.39
-0.47% |
$83.37
|
1,446,386
78.10% of 50 DAV
50 DAV is 1,852,000
|
$85.78
-4.56%
|
5/29/2014
|
$75.95
|
PP = $72.50
|
|
MB = $76.13
|
Most Recent Note - 7/1/2014 12:21:42 PM
G - Pulling back today following a gap up for a new all-time high on the prior session. Prior highs near $80 define initial support to watch on pullbacks. See the latest FSU analysis for more details and new annotated graphs.
>>> FEATURED STOCK ARTICLE : Gap Up Gain on Above Average Volume for New Highs - 6/30/2014
View all notes |
Set NEW NOTE alert |
CANSLIM.net Company Profile |
SEC
News |
Chart |
Request a new note
C
A N
S L
I M
|
SN
-
NYSE
Sanchez Energy Corp
ENERGY - Independent Oil and Gas
|
$36.20
|
-0.72
-1.95% |
$37.52
|
1,003,842
64.27% of 50 DAV
50 DAV is 1,562,000
|
$38.95
-7.06%
|
5/22/2014
|
$33.00
|
PP = $31.59
|
|
MB = $33.17
|
Most Recent Note - 7/2/2014 3:58:26 PM
G - Pulling back after getting very extended from its prior base. Prior highs near $32 define support to watch on pullbacks.
>>> FEATURED STOCK ARTICLE : Finished Near Session Low After Hitting new 52-Week High - 6/9/2014
View all notes |
Set NEW NOTE alert |
CANSLIM.net Company Profile |
SEC
News |
Chart |
Request a new note
C
A N
S L
I M
|
TARO
-
NYSE
Taro Pharmaceutical Inds
DRUGS - Drug Manufacturers - Other
|
$143.03
|
+1.05
0.74% |
$146.64
|
100,242
167.07% of 50 DAV
50 DAV is 60,000
|
$144.42
-0.96%
|
6/26/2014
|
$117.31
|
PP = $118.90
|
|
MB = $124.85
|
Most Recent Note - 7/2/2014 12:46:46 PM
G - Hitting yet another new high with today's 6th consecutive gain. Triggered a technical buy signal and quickly got extended with considerable volume-driven gains. Disciplined investors avoid chasing stocks more than +5% above prior highs.
>>> FEATURED STOCK ARTICLE : Fundamentally Strong Stock Challenging Prior Resistance Level - 6/26/2014
View all notes |
Set NEW NOTE alert |
CANSLIM.net Company Profile |
SEC
News |
Chart |
Request a new note
C
A N
S L
I M
|
TRN
-
NYSE
Trinity Industries Inc
TRANSPORTATION - Railroads
|
$44.88
|
+1.11
2.54% |
$46.00
|
3,026,988
87.94% of 50 DAV
50 DAV is 3,442,000
|
$44.87
0.02%
|
4/30/2014
|
$37.79
|
PP = $38.03
|
|
MB = $39.93
|
Most Recent Note - 7/2/2014 4:03:17 PM
G - Gapped up today and hit a new 52-week high with a gain on light volume, getting more extended from its prior base. Its 50 DMA line defines important near-term support to watch.
>>> FEATURED STOCK ARTICLE : Recent Lows and 50-Day Moving Average Line Define Near-Term Support - 6/16/2014
View all notes |
Set NEW NOTE alert |
CANSLIM.net Company Profile |
SEC
News |
Chart |
Request a new note
C
A N
S L
I M
|
WLK
-
NYSE
Westlake Chemical Corp
CHEMICALS - Specialty Chemicals
|
$85.10
|
+0.22
0.26% |
$85.58
|
565,987
80.17% of 50 DAV
50 DAV is 706,000
|
$85.40
-0.35%
|
4/29/2014
|
$72.79
|
PP = $69.31
|
|
MB = $72.78
|
Most Recent Note - 6/27/2014 4:53:22 PM
G - Hovering near its 52-week high, extended from any sound base pattern. Prior highs near $77 define important near-term support to watch on pullbacks.
>>> FEATURED STOCK ARTICLE : Chemical Firm Quietly Posted 7th Consecutive Weekly Gain - 6/13/2014
View all notes |
Set NEW NOTE alert |
CANSLIM.net Company Profile |
SEC
News |
Chart |
Request a new note
C
A N
S L
I M
|
Symbol/Exchange
Company Name
Industry Group |
PRICE |
CHANGE
(%Change) |
Day High |
Volume
(% DAV)
(% 50 day avg vol) |
52 Wk Hi
% From Hi |
Featured
Date |
Price
Featured |
Pivot Featured |
|
Max Buy |
|
|
|
THESE ARE NOT BUY RECOMMENDATIONS!
Comments contained in the body of this report are technical
opinions only. The material herein has been obtained
from sources believed to be reliable and accurate, however,
its accuracy and completeness cannot be guaranteed.
This site is not an investment advisor, hence it does
not endorse or recommend any securities or other investments.
Any recommendation contained in this report may not
be suitable for all investors and it is not to be deemed
an offer or solicitation on our part with respect to
the purchase or sale of any securities. All trademarks,
service marks and trade names appearing in this report
are the property of their respective owners, and are
likewise used for identification purposes only.
This report is a service available
only to active Paid Premium Members.
You may opt-out of receiving report notifications
at any time. Questions or comments may be submitted
by writing to Premium Membership Services 665 S.E. 10 Street, Suite 201 Deerfield Beach, FL 33441-5634 or by calling 1-800-965-8307
or 954-785-1121.
|
|
|

