You are not logged in.
This means you
CAN ONLY VIEW reports that were published prior to Friday, April 4, 2025.
You
MUST UPGRADE YOUR MEMBERSHIP if you want to see any current reports.
AFTER MARKET UPDATE - TUESDAY, JULY 1ST, 2014
Previous After Market Report Next After Market Report >>>
|
|
|
|
DOW |
+129.47 |
16,956.07 |
+0.77% |
|
Volume |
671,182,040 |
-14% |
|
Volume |
1,788,723,630 |
+5% |
|
NASDAQ |
+50.47 |
4,458.65 |
+1.14% |
|
Advancers |
2,076 |
65% |
|
Advancers |
2,146 |
73% |
|
S&P 500 |
+13.09 |
1,973.32 |
+0.67% |
|
Decliners |
1,007 |
32% |
|
Decliners |
728 |
25% |
|
Russell 2000 |
+12.98 |
1,205.94 |
+1.09% |
|
52 Wk Highs |
358 |
|
|
52 Wk Highs |
201 |
|
|
S&P 600 |
+8.01 |
690.88 |
+1.17% |
|
52 Wk Lows |
6 |
|
|
52 Wk Lows |
15 |
|
|
 |
Leadership Expanded as Major Averages Continued to Rally
Kenneth J. Gruneisen - Passed the CAN SLIM® Master's Exam
The major averages rallied on Tuesday amid optimism surrounding the global economy. The volume was reported mixed, lighter than the prior session total on the NYSE and higher on the Nasdaq exchange. Breadth was positive as advancers led decliners by a 2-1 margin on the NYSE and by nearly a 3-1 margin on the Nasdaq exchange. There were 106 high-ranked companies from the CANSLIM.net Leaders List that made new 52-week highs and appeared on the CANSLIM.net BreakOuts Page, up from the prior session's total of 58 stocks. New 52-week highs expanded and solidly outnumbered new 52-week lows on the NYSE and on the Nasdaq exchange. There were gains for 10 of the 15 high-ranked companies currently included on the Featured Stocks Page. The S&P 500 Index and Dow Jones Industrial Average recently surged into new high territory with healthy leadership (new 52-week highs) sending a reassuring signal that the market direction (M criteria) is in a "confirmed uptrend". Any new buying efforts should be selective and focused in stocks meeting all key criteria of the fact-based investment system.
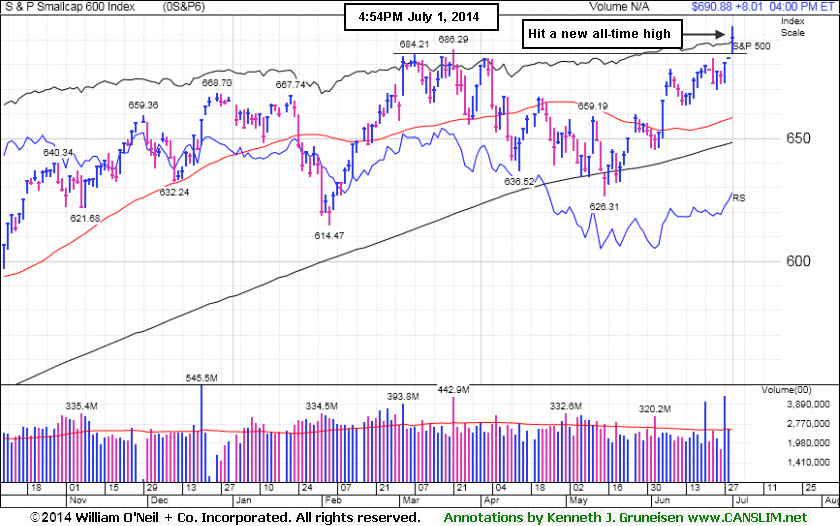
PICTURED: The S&P Small Cap 600 Index hit a new all-time high, however the index is only up +3.8% year-to-date.
Stocks experienced a strong start to the third-quarter. The Dow climbed within 2 points of 17,000 before closing up 129 at an all-time high of 16,956. The S&P 500 advanced 13 points to a record level of 1,973. The NASDAQ gained 50 points to finish at 4,458.
Stocks rose after reports showed U.S. manufacturing activity expanded in June. The encouraging data followed China's purchasing manager's index rising to its best level in six months. A separate release revealed construction spending increased +0.1% in May.
Auto makers also provided a tailwind to the market. The new General Motors (GM +3.6%) rallied after an unexpected +1% gain in June sales. Toyota (TM +2.2%) rose on a year-over-year increase in vehicles sold.
Nine of 10 sectors in the S&P 500 were up on the session. Health care and tech were the best performing groups as Johnson & Johnson (JNJ +1.2%) and Apple (AAPL +0.6%) rose. Utilities were the lone sector to finish lower on the session. Exelon (EXC -2.1%) contributed the most to the group's retreat.
Treasuries finished lower with the 10-year note down 9/32 to yield 2.56%.
The CANSLIM.net Featured Stocks Page shows the most action-worthy candidates and their latest notes and a Headline Link directs members to the latest detailed analysis with data-packed graphs annotated by a Certified expert along with links to additional resources. The Premium Member Homepage includes "dynamic archives" to all prior pay reports published. Watch for an announcement via email concerning the next WEBCAST.
|
 Kenneth J. Gruneisen started out as a licensed stockbroker in August 1987, a couple of months prior to the historic stock market crash that took the Dow Jones Industrial Average down -22.6% in a single day. He has published daily fact-based fundamental and technical analysis on high-ranked stocks online for two decades. Through FACTBASEDINVESTING.COM, Kenneth provides educational articles, news, market commentary, and other information regarding proven investment systems that work in good times and bad.
Comments contained in the body of this report are technical opinions only and are not necessarily those of Gruneisen Growth Corp. The material herein has been obtained from sources believed to be reliable and accurate, however, its accuracy and completeness cannot be guaranteed. Our firm, employees, and customers may effect transactions, including transactions contrary to any recommendation herein, or have positions in the securities mentioned herein or options with respect thereto. Any recommendation contained in this report may not be suitable for all investors and it is not to be deemed an offer or solicitation on our part with respect to the purchase or sale of any securities. |
|
 |
Retail, Tech, and Financial Indexes Rose
Kenneth J. Gruneisen - Passed the CAN SLIM® Master's Exam
The Retail Index ($RLX +1.53%) was a positive influence on the major averages along with financial shares as the Bank Index ($BKX +0.62%) and the Broker/Dealer Index ($XBD +0.79%) posted modest gains. The Biotechnology Index ($BTK +2.17%) led the tech sector higher while the Semiconductor Index ($SOX +1.38%) and the Networking Index ($NWX +0.65%) followed with smaller gains. Meanwhile, the Gold & Silver Index ($XAU -0.90%) was a laggard as it lost ground and energy-related shares were mixed as the Integrated Oil Index ($XOI +0.31%) edged higher while the Oil Services Index ($OSX -0.10%) finished the session with a tiny loss.
Charts courtesy www.stockcharts.com
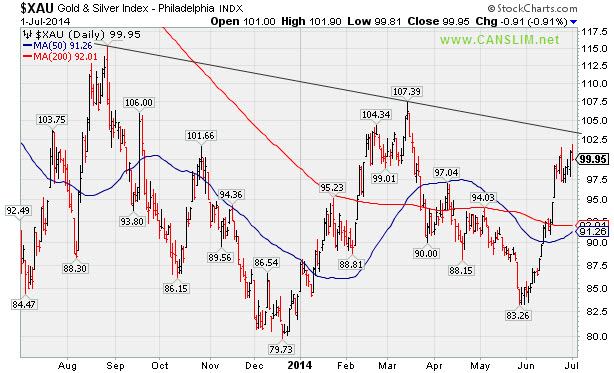
PICTURED: The Gold & Silver Index ($XAU -0.90%) is consolidating above its 50-day and 200-day moving averages lines yet below a downward trendline connecting its August 2013 and March 2014 highs.
| Oil Services |
$OSX |
310.72 |
-0.30 |
-0.10% |
+10.56% |
| Integrated Oil |
$XOI |
1,687.12 |
+5.29 |
+0.31% |
+12.24% |
| Semiconductor |
$SOX |
644.71 |
+8.78 |
+1.38% |
+20.50% |
| Networking |
$NWX |
337.65 |
+2.18 |
+0.65% |
+4.23% |
| Broker/Dealer |
$XBD |
160.94 |
+1.26 |
+0.79% |
+0.24% |
| Retail |
$RLX |
902.28 |
+13.62 |
+1.53% |
-3.99% |
| Gold & Silver |
$XAU |
99.95 |
-0.91 |
-0.90% |
+18.78% |
| Bank |
$BKX |
71.75 |
+0.44 |
+0.62% |
+3.60% |
| Biotech |
$BTK |
2,836.61 |
+60.33 |
+2.17% |
+21.72% |
|
|
|
 |
Found Support Near 50-Day Average and Relative Strength Slightly Improved
Kenneth J. Gruneisen - Passed the CAN SLIM® Master's Exam
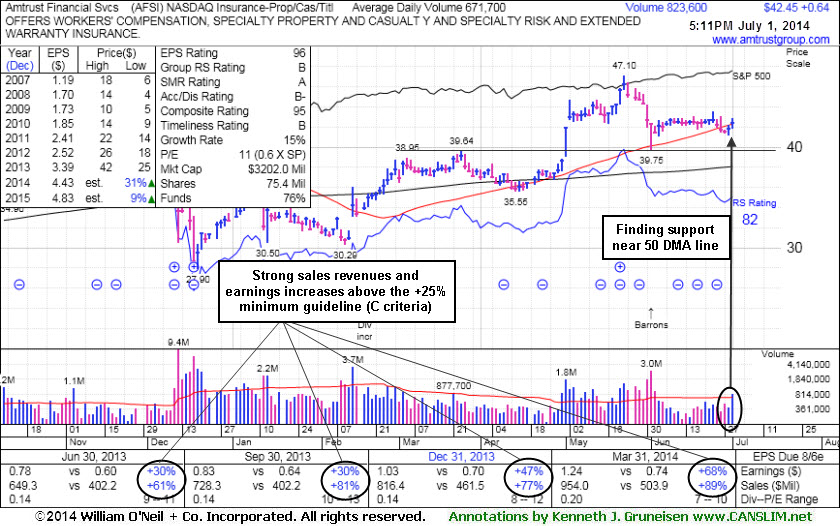
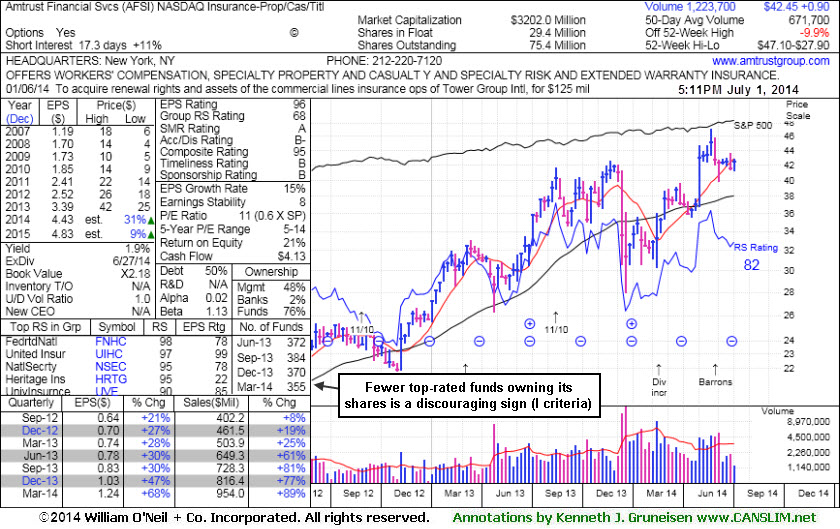
Amtrust Financial Svcs (AFSI +$0.64 or +1.53% to $42.45) managed a prompt rebound above the 50-day moving average (DMA) line helping its outlook improve. Its Relative Strength rating has also rebounded to 82, above the 80+ minimum guideline for buy candidates. It was last shown in this FSU section on 6/06/14 with annotated graphs under the headline, "Halted Slide at 50-Day Moving Average After Distributional Pressure", following damaging losses on higher volume. Disciplined investors always limit losses by selling any stock that falls more than -7% from their purchase price.
The high-ranked Insurance - Property/Casualty/Title firm stalled and encountered distributional pressure soon after rising from an advanced "3-weeks tight" base. It was highlighted in yellow in the 5/21/14 mid-day report (read here) and the pivot point cited was based on its 5/13/14 high plus 10 cents.
The major averages (M criteria) have produced confirming gains coupled with an expansion in leadership (stocks hitting new 52-week highs), a welcome reassurance that the market has established a meaningful rally. It reported earnings +68% on +89% sales revenues for the quarter ended Mar '14 quarter versus the year ago period, its 7th consecutive comparison above the +25% minimum earnings guideline (C criteria). It has a great annual earnings (A criteria) history and it has earned an impressive 96 Earnings Per Share rating, well above the 80+ minimum rating for buy candidates.
Among concerns, we previously noted that the number of top-rated funds owning an interest has been reported lower. Now its current Up/Down Volume Ratio of 1.0 is a neutral indication that its shares have been under neither accumulation or distributional pressure over the past 50 days.
|
|
|
Color Codes Explained :
Y - Better candidates highlighted by our
staff of experts.
G - Previously featured
in past reports as yellow but may no longer be buyable under the
guidelines.
***Last / Change / Volume data in this table is the closing quote data***
Symbol/Exchange
Company Name
Industry Group |
PRICE |
CHANGE
(%Change) |
Day High |
Volume
(% DAV)
(% 50 day avg vol) |
52 Wk Hi
% From Hi |
Featured
Date |
Price
Featured |
Pivot Featured |
|
Max Buy |
ACT
-
NYSE
Actavis plc
Medical-Generic Drugs
|
$224.00
|
+0.95
0.43% |
$229.40
|
5,873,547
266.13% of 50 DAV
50 DAV is 2,207,000
|
$230.77
-2.93%
|
6/20/2014
|
$216.53
|
PP = $230.87
|
|
MB = $242.41
|
 Most Recent Note - 7/1/2014 12:00:36 PM
Y - Small gap up today challenging its 52-week high. Subsequent volume-driven gains to new highs may trigger a technical buy signal.
>>> FEATURED STOCK ARTICLE : Volume Above Average as Generic Drug Firm Approaches Highs - 6/24/2014
View all notes |
Set NEW NOTE alert |
CANSLIM.net Company Profile |
SEC
News |
Chart |
Request a new note
C
A N
S L
I M


|
AFSI
-
NASDAQ
Amtrust Financial Svcs
INSURANCE - Property and; Casualty Insurance
|
$42.45
|
+0.64
1.53% |
$42.85
|
823,619
122.62% of 50 DAV
50 DAV is 671,700
|
$47.10
-9.87%
|
5/21/2014
|
$44.85
|
PP = $44.85
|
|
MB = $47.09
|
Most Recent Note - 7/1/2014 5:27:11 PM
G - Relative Strength rating improved to 82 and it found support near its 50 DMA line. Faces some resistance due to overhead supply up through the $47 level. See the latest FSU analysis for more details and new annotated graphs.
>>> FEATURED STOCK ARTICLE : Found Support Near 50-Day Average and Relative Strength Slightly Improved - 7/1/2014
View all notes |
Set NEW NOTE alert |
CANSLIM.net Company Profile |
SEC
News |
Chart |
Request a new note
C
A N
S L
I M
|
AL
-
NYSE
Air Lease Corp Cl A
DIVERSIFIED SERVICES - Rental and Leasing Services
|
$38.59
|
+0.01
0.03% |
$38.91
|
659,188
61.26% of 50 DAV
50 DAV is 1,076,000
|
$42.89
-10.03%
|
5/9/2014
|
$38.27
|
PP = $38.25
|
|
MB = $40.16
|
Most Recent Note - 6/27/2014 5:11:13 PM
G - Small loss today with above average volume raised concerns as it closed just below its 50 DMA line ($38.63). Any violation of its recent low ($36.55 on 6/13/17) would raise serious concerns and trigger a worrisome technical sell signal.
>>> FEATURED STOCK ARTICLE : Enduring Mild Distributional Pressure on Pullback - 6/11/2014
View all notes |
Set NEW NOTE alert |
CANSLIM.net Company Profile |
SEC
News |
Chart |
Request a new note
C
A N
S L
I M
|
BITA
-
NYSE
Bitauto Hldgs Ltd Ads
Internet-Content
|
$47.68
|
-1.02
-2.09% |
$49.20
|
904,531
97.68% of 50 DAV
50 DAV is 926,000
|
$49.19
-3.07%
|
6/26/2014
|
$46.20
|
PP = $47.03
|
|
MB = $49.38
|
Most Recent Note - 6/30/2014 11:54:54 AM
Y - Hit a new 52-week high and rallied above its pivot point with above average volume behind today's 4th consecutive gain. See the latest FSU analysis for more details and annotated graphs. The 6/26/14 mid-day report (read here) noted - "A gain above the pivot point backed by at least +40% above average volume could trigger a technical buy signal."
>>> FEATURED STOCK ARTICLE : Perched At High With No Resistance Remaining Due to Overhead Supply - 6/27/2014
View all notes |
Set NEW NOTE alert |
CANSLIM.net Company Profile |
SEC
News |
Chart |
Request a new note
C
A N
S L
I M
|
BWLD
-
NASDAQ
Buffalo Wild Wings Inc
LEISURE - Restaurants
|
$164.99
|
-0.72
-0.43% |
$167.36
|
436,369
98.06% of 50 DAV
50 DAV is 445,000
|
$166.40
-0.85%
|
6/19/2014
|
$158.52
|
PP = $159.91
|
|
MB = $167.91
|
Most Recent Note - 6/27/2014 5:03:14 PM
Y - Churned above average volume today while hovering near its 52-week high. A considerable volume-driven gain above its pivot point on 6/23/14 triggered a technical buy signal. No resistance remains due to overhead supply. Disciplined investors avoid chasing stocks more than +5% above prior highs and always limit losses by selling any stock that falls more than -7% from their purchase price.
>>> FEATURED STOCK ARTICLE : Perched Near Highs With Strong Fundamentals - 6/19/2014
View all notes |
Set NEW NOTE alert |
CANSLIM.net Company Profile |
SEC
News |
Chart |
Request a new note
C
A N
S L
I M
|
Symbol/Exchange
Company Name
Industry Group |
PRICE |
CHANGE
(%Change) |
Day High |
Volume
(% DAV)
(% 50 day avg vol) |
52 Wk Hi
% From Hi |
Featured
Date |
Price
Featured |
Pivot Featured |
|
Max Buy |
EQM
-
NYSE
E Q T Midstream Partners
ENERGY - Oil and Gas Pipelines
|
$97.25
|
+0.51
0.53% |
$97.99
|
98,371
23.26% of 50 DAV
50 DAV is 423,000
|
$102.51
-5.13%
|
12/12/2013
|
$53.17
|
PP = $56.51
|
|
MB = $59.34
|
Most Recent Note - 6/25/2014 5:18:55 PM
G - Strength has continued despite fundamental flaws repeatedly noted. It is very extended from any sound base. See the latest FSU analysis for more details and new annotated graphs.
>>> FEATURED STOCK ARTICLE : Strength Continued Despite Fundamental Flaws - 6/25/2014
View all notes |
Set NEW NOTE alert |
CANSLIM.net Company Profile |
SEC
News |
Chart |
Request a new note
C
A N
S L
I M
|
GRFS
-
NASDAQ
Grifols Sa Ads
Medical-Ethical Drugs
|
$44.47
|
+0.42
0.95% |
$44.57
|
566,440
82.57% of 50 DAV
50 DAV is 686,000
|
$46.66
-4.69%
|
5/15/2014
|
$41.14
|
PP = $43.55
|
|
MB = $45.73
|
Most Recent Note - 6/27/2014 5:06:01 PM
Y - Halted its slide today with a small gain on light volume. Subsequent deterioration below its 50 DMA line would raise more serious concerns. Disciplined investors always limit losses by selling any stock that falls more than -7% from their purchase price. Keep in mind that any stock which is sold can be bought again later if strength returns.
>>> FEATURED STOCK ARTICLE : Consolidating Just Below "Max Buy" Level - 6/17/2014
View all notes |
Set NEW NOTE alert |
CANSLIM.net Company Profile |
SEC
News |
Chart |
Request a new note
C
A N
S L
I M
|
HF
-
NYSE
H F F Inc Cl A
REAL ESTATE - Property Management/Developmen
|
$37.08
|
-0.11
-0.30% |
$37.53
|
218,620
114.46% of 50 DAV
50 DAV is 191,000
|
$37.58
-1.33%
|
6/20/2014
|
$34.60
|
PP = $36.16
|
|
MB = $37.97
|
Most Recent Note - 6/27/2014 1:00:05 PM
Y - Hitting another new 52-week high with a gain today following 4 volume-driven gains in the span of 5 sessions. Its solid gain above its pivot point on the prior session with +73% above average volume triggered a technical buy signal.
>>> FEATURED STOCK ARTICLE : Approached 52-Week High With Volume-Driven Gain - 6/23/2014
View all notes |
Set NEW NOTE alert |
CANSLIM.net Company Profile |
SEC
News |
Chart |
Request a new note
C
A N
S L
I M
|
ICON
-
NASDAQ
Iconix Brand Group Inc
CONSUMER NON-DURABLES - Textile - Apparel Footwear
|
$43.19
|
+0.25
0.58% |
$43.52
|
344,632
60.57% of 50 DAV
50 DAV is 569,000
|
$44.81
-3.62%
|
6/5/2014
|
$43.54
|
PP = $43.44
|
|
MB = $45.61
|
Most Recent Note - 6/27/2014 5:08:32 PM
Y - Small gain today with above average volume while consolidating above its 50 DMA line ($41.93) and prior highs in the $43-42 area defining important support to watch.
>>> FEATURED STOCK ARTICLE : Found Support Above Prior Highs During Consolidation - 6/18/2014
View all notes |
Set NEW NOTE alert |
CANSLIM.net Company Profile |
SEC
News |
Chart |
Request a new note
C
A N
S L
I M
|
KS
-
NYSE
Kapstone Paper&Packaging
MANUFACTURING - Paper and Packaging
|
$33.35
|
+0.22
0.66% |
$33.83
|
866,433
92.87% of 50 DAV
50 DAV is 933,000
|
$34.43
-3.14%
|
6/20/2014
|
$32.30
|
PP = $31.92
|
|
MB = $33.52
|
Most Recent Note - 6/27/2014 4:58:24 PM
Y - Tallied a small gain today with light volume and finished at a best-ever close very near its "max buy" level. Prior highs near $32 define initial support to watch on pullbacks. Held its ground stubbornly since highlighted in yellow while rallying from a "cup-with-handle" base in the 6/20/14 mid-day report (read here).
>>> FEATURED STOCK ARTICLE : Four Times Average Volume Behind Big Breakout Gain - 6/20/2014
View all notes |
Set NEW NOTE alert |
CANSLIM.net Company Profile |
SEC
News |
Chart |
Request a new note
C
A N
S L
I M
|
Symbol/Exchange
Company Name
Industry Group |
PRICE |
CHANGE
(%Change) |
Day High |
Volume
(% DAV)
(% 50 day avg vol) |
52 Wk Hi
% From Hi |
Featured
Date |
Price
Featured |
Pivot Featured |
|
Max Buy |
PANW
-
NYSE
Palo Alto Networks
Computer Sftwr-Security
|
$82.26
|
-1.59
-1.90% |
$85.60
|
3,565,764
197.55% of 50 DAV
50 DAV is 1,805,000
|
$85.78
-4.10%
|
5/29/2014
|
$75.95
|
PP = $72.50
|
|
MB = $76.13
|
Most Recent Note - 7/1/2014 12:21:42 PM
G - Pulling back today following a gap up for a new all-time high on the prior session. Prior highs near $80 define initial support to watch on pullbacks. See the latest FSU analysis for more details and new annotated graphs.
>>> FEATURED STOCK ARTICLE : Gap Up Gain on Above Average Volume for New Highs - 6/30/2014
View all notes |
Set NEW NOTE alert |
CANSLIM.net Company Profile |
SEC
News |
Chart |
Request a new note
C
A N
S L
I M
|
SN
-
NYSE
Sanchez Energy Corp
ENERGY - Independent Oil and Gas
|
$36.92
|
-0.67
-1.78% |
$37.84
|
980,104
63.03% of 50 DAV
50 DAV is 1,555,000
|
$38.95
-5.21%
|
5/22/2014
|
$33.00
|
PP = $31.59
|
|
MB = $33.17
|
Most Recent Note - 6/25/2014 3:57:57 PM
G - Rebounding toward its 52-week high with today's big gain. It is very extended from its prior base. Disciplined investors avoid chasing extended stocks. Prior highs near $31-32 define support to watch on pullbacks.
>>> FEATURED STOCK ARTICLE : Finished Near Session Low After Hitting new 52-Week High - 6/9/2014
View all notes |
Set NEW NOTE alert |
CANSLIM.net Company Profile |
SEC
News |
Chart |
Request a new note
C
A N
S L
I M
|
TARO
-
NYSE
Taro Pharmaceutical Inds
DRUGS - Drug Manufacturers - Other
|
$141.98
|
+1.74
1.24% |
$144.42
|
109,299
188.45% of 50 DAV
50 DAV is 58,000
|
$140.49
1.06%
|
6/26/2014
|
$117.31
|
PP = $118.90
|
|
MB = $124.85
|
Most Recent Note - 7/1/2014 12:29:51 PM
G - Hitting yet another new high with today's 5th consecutive gain. Triggered a technical buy signal and quickly got extended with considerable volume-driven gains. Disciplined investors avoid chasing stocks more than +5% above prior highs.
>>> FEATURED STOCK ARTICLE : Fundamentally Strong Stock Challenging Prior Resistance Level - 6/26/2014
View all notes |
Set NEW NOTE alert |
CANSLIM.net Company Profile |
SEC
News |
Chart |
Request a new note
C
A N
S L
I M
|
TRN
-
NYSE
Trinity Industries Inc
TRANSPORTATION - Railroads
|
$43.77
|
+0.05
0.11% |
$44.64
|
2,822,181
82.88% of 50 DAV
50 DAV is 3,405,000
|
$44.87
-2.45%
|
4/30/2014
|
$37.79
|
PP = $38.03
|
|
MB = $39.93
|
Most Recent Note - 6/27/2014 5:14:24 PM
G - Hit a new 52-week high today but it erased most of its gain and ended near the session low while trading above average volume, a sign of distributional pressure termed "churning". Previously noted - "It is extended from its prior base. Recent lows in the $39-40 area and its 50 DMA line coincide defining important near-term support to watch. Do not be confused by the 2:1 share split effective 6/20/14 (Featured Price, Pivot Point, and Max Buy level have been adjusted accordingly)."
>>> FEATURED STOCK ARTICLE : Recent Lows and 50-Day Moving Average Line Define Near-Term Support - 6/16/2014
View all notes |
Set NEW NOTE alert |
CANSLIM.net Company Profile |
SEC
News |
Chart |
Request a new note
C
A N
S L
I M
|
WLK
-
NYSE
Westlake Chemical Corp
CHEMICALS - Specialty Chemicals
|
$84.88
|
+1.12
1.34% |
$85.40
|
319,229
45.03% of 50 DAV
50 DAV is 709,000
|
$85.01
-0.15%
|
4/29/2014
|
$72.79
|
PP = $69.31
|
|
MB = $72.78
|
Most Recent Note - 6/27/2014 4:53:22 PM
G - Hovering near its 52-week high, extended from any sound base pattern. Prior highs near $77 define important near-term support to watch on pullbacks.
>>> FEATURED STOCK ARTICLE : Chemical Firm Quietly Posted 7th Consecutive Weekly Gain - 6/13/2014
View all notes |
Set NEW NOTE alert |
CANSLIM.net Company Profile |
SEC
News |
Chart |
Request a new note
C
A N
S L
I M
|
Symbol/Exchange
Company Name
Industry Group |
PRICE |
CHANGE
(%Change) |
Day High |
Volume
(% DAV)
(% 50 day avg vol) |
52 Wk Hi
% From Hi |
Featured
Date |
Price
Featured |
Pivot Featured |
|
Max Buy |
|
|
|
THESE ARE NOT BUY RECOMMENDATIONS!
Comments contained in the body of this report are technical
opinions only. The material herein has been obtained
from sources believed to be reliable and accurate, however,
its accuracy and completeness cannot be guaranteed.
This site is not an investment advisor, hence it does
not endorse or recommend any securities or other investments.
Any recommendation contained in this report may not
be suitable for all investors and it is not to be deemed
an offer or solicitation on our part with respect to
the purchase or sale of any securities. All trademarks,
service marks and trade names appearing in this report
are the property of their respective owners, and are
likewise used for identification purposes only.
This report is a service available
only to active Paid Premium Members.
You may opt-out of receiving report notifications
at any time. Questions or comments may be submitted
by writing to Premium Membership Services 665 S.E. 10 Street, Suite 201 Deerfield Beach, FL 33441-5634 or by calling 1-800-965-8307
or 954-785-1121.
|
|
|

