You are not logged in.
This means you
CAN ONLY VIEW reports that were published prior to Monday, April 14, 2025.
You
MUST UPGRADE YOUR MEMBERSHIP if you want to see any current reports.
AFTER MARKET UPDATE - THURSDAY, JUNE 26TH, 2014
Previous After Market Report Next After Market Report >>>
|
|
|
|
DOW |
-21.38 |
16,846.13 |
-0.13% |
|
Volume |
578,632,950 |
-9% |
|
Volume |
1,453,186,740 |
-8% |
|
NASDAQ |
-0.71 |
4,379.05 |
-0.02% |
|
Advancers |
1,601 |
50% |
|
Advancers |
1,310 |
44% |
|
S&P 500 |
-2.31 |
1,957.22 |
-0.12% |
|
Decliners |
1,454 |
46% |
|
Decliners |
1,584 |
53% |
|
Russell 2000 |
-1.97 |
1,180.71 |
-0.17% |
|
52 Wk Highs |
165 |
|
|
52 Wk Highs |
49 |
|
|
S&P 600 |
-1.57 |
675.58 |
-0.23% |
|
52 Wk Lows |
16 |
|
|
52 Wk Lows |
30 |
|
|
 |
Major Averages Trimmed Losses But Ended Slightly Lower With Even Breadth
Kenneth J. Gruneisen - Passed the CAN SLIM® Master's Exam
Stocks trimmed earlier losses but finished lower on Thursday. The session's volume was reported lighter than the prior session total on the NYSE and on the Nasdaq exchange, a reassuring sign that the institutional crowd did not increase their selling efforts. Breadth was fairly even as advancers led decliners by a narrow 8-7 margin on the NYSE, meanwhile decliners led advancers by an 8-7 margin on the Nasdaq exchange. There were 26 high-ranked companies from the CANSLIM.net Leaders List that made new 52-week highs and appeared on the CANSLIM.net BreakOuts Page, down a notch from the total of 27 stocks on the prior session. New 52-week highs contracted yet still outnumbered new 52-week lows on the NYSE and on the Nasdaq exchange. There were gains for 7 of the 15 high-ranked companies currently included on the Featured Stocks Page. The S&P 500 Index and Dow Jones Industrial Average recently surged into new high territory with healthy leadership (new 52-week highs) sending a reassuring signal that the market direction (M criteria) is in a "confirmed uptrend". Any new buying efforts should be selective and focused in stocks meeting all key criteria of the fact-based investment system.
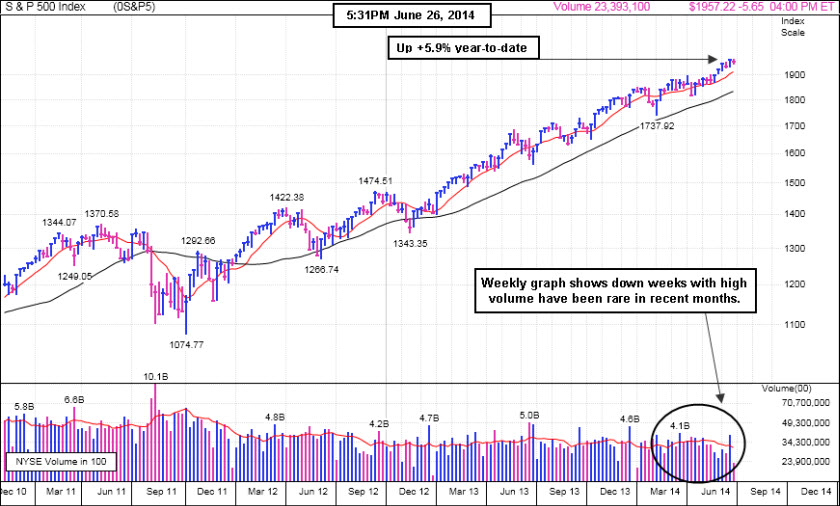
PICTURED: The S&P 500 Index fell 2 points to 1,957 and the benchmark index is up +5.9% year-to-date. The weekly graph illustrates that down weeks with high volume have been rare in recent months which is a reassuring sign that the institutional crowd has not been unloading stocks while the market has advanced.
The market experienced some profit taking amid mixed economic data and hawkish Fed speak. Updates on the consumer showed personal spending increased by a less than anticipated 0.2% in May while incomes rose 0.4%. A separate report showed jobless claims fell by 2,000 last week to a one-month low of 312,000. On the monetary policy front, St. Louis Fed President James Bullard predicted the central bank’s first interest-rate rise will occur in early 2015 as unemployment declines and inflation quickens.
Overall, six of the 10 sectors in the S&P 500 declined. Financials and consumer staples were the worst performing groups. Shares of Citigroup (C -1.3%). Philip Morris International (PM -2.8%) after cutting its full-year earnings outlook. Utilities finished higher led Dominion Resources' (D +1.9%) gain. In other news, Iron Mountain (IRM +20%) rallied after the company said it is moving ahead with its conversion to a REIT.
Treasuries advanced and a government auction of seven-year notes drew lower-than-average demand. The 10-year note gained 9/32 to yield 2.53%.
The CANSLIM.net Featured Stocks Page shows the most action-worthy candidates and their latest notes and a Headline Link directs members to the latest detailed analysis with data-packed graphs annotated by a Certified expert along with links to additional resources. The Premium Member Homepage includes "dynamic archives" to all prior pay reports published. Watch for an announcement via email concerning the next WEBCAST.
|
 Kenneth J. Gruneisen started out as a licensed stockbroker in August 1987, a couple of months prior to the historic stock market crash that took the Dow Jones Industrial Average down -22.6% in a single day. He has published daily fact-based fundamental and technical analysis on high-ranked stocks online for two decades. Through FACTBASEDINVESTING.COM, Kenneth provides educational articles, news, market commentary, and other information regarding proven investment systems that work in good times and bad.
Comments contained in the body of this report are technical opinions only and are not necessarily those of Gruneisen Growth Corp. The material herein has been obtained from sources believed to be reliable and accurate, however, its accuracy and completeness cannot be guaranteed. Our firm, employees, and customers may effect transactions, including transactions contrary to any recommendation herein, or have positions in the securities mentioned herein or options with respect thereto. Any recommendation contained in this report may not be suitable for all investors and it is not to be deemed an offer or solicitation on our part with respect to the purchase or sale of any securities. |
|
 |
Commodity-Linked Groups Led Gainers
Kenneth J. Gruneisen - Passed the CAN SLIM® Master's Exam
Commodity-linked groups had a positive bias as the Gold & Silver Index ($XAU +0.83%) and the Oil Services Index ($OSX +0.58%) rose while the Integrated Oil Index ($XOI +0.02%) finihed flat. Meanwhile, the Bank Index ($BKX -0.31%) and the Broker/Dealer Index ($XBD -0.28%) both ended with small losses on Thursday, weighing on the major averages. The Retail Index ($RLX -0.22%) also edged lower. The Semiconductor Index ($SOX -0.41%) while the Biotechnology Index ($BTK +0.09%) finished flat and the Networking Index ($NWX +0.24%) eked out a small gain.
Charts courtesy www.stockcharts.com
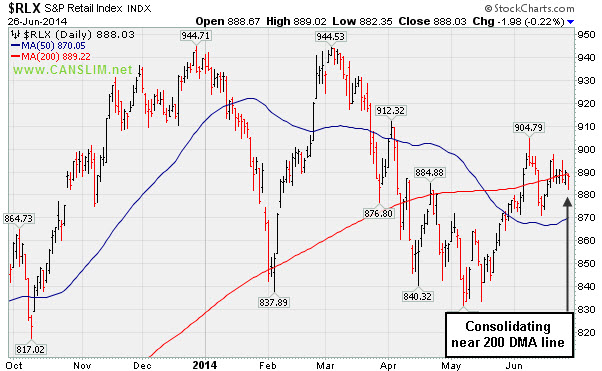
PICTURED: The Retail Index ($RLX -0.22%) is consolidating near its 200-day moving average (DMA) line.
| Oil Services |
$OSX |
305.31 |
+1.77 |
+0.58% |
+8.64% |
| Integrated Oil |
$XOI |
1,687.96 |
+0.28 |
+0.02% |
+12.30% |
| Semiconductor |
$SOX |
628.28 |
-2.59 |
-0.41% |
+17.43% |
| Networking |
$NWX |
332.31 |
+0.79 |
+0.24% |
+2.58% |
| Broker/Dealer |
$XBD |
158.89 |
-0.45 |
-0.28% |
-1.04% |
| Retail |
$RLX |
888.03 |
-1.98 |
-0.22% |
-5.51% |
| Gold & Silver |
$XAU |
98.97 |
+0.81 |
+0.83% |
+17.61% |
| Bank |
$BKX |
71.13 |
-0.22 |
-0.31% |
+2.70% |
| Biotech |
$BTK |
2,755.44 |
+2.58 |
+0.09% |
+18.24% |
|
|
|
 |
Fundamentally Strong Stock Challenging Prior Resistance Level
Kenneth J. Gruneisen - Passed the CAN SLIM® Master's Exam
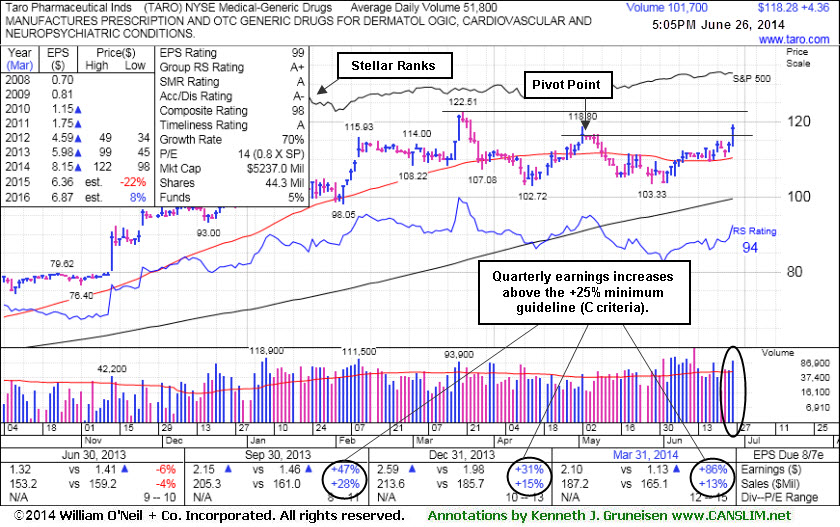
Taro Pharmaceutical Inds (TARO $4.36 or +3.83% to $118.28) traded twice its average volume behind today's considerable gain. However, it is important to realize that it is rallying near an area where it has meet stiff resistance in prior months. No great advantage is to be gained by getting in "early", before fresh proof of robust new institutional buying demand.
Subsequent gains backed by at least +40% above average volume while the stock rallies above its pivot point may trigger a proper technical buy signal. If it does so, it is still facing some additional resistance due to overhead supply up through $122. Additional volume-driven gains into new all-time high territory could technically signal the beginning of a far more significant price advance.
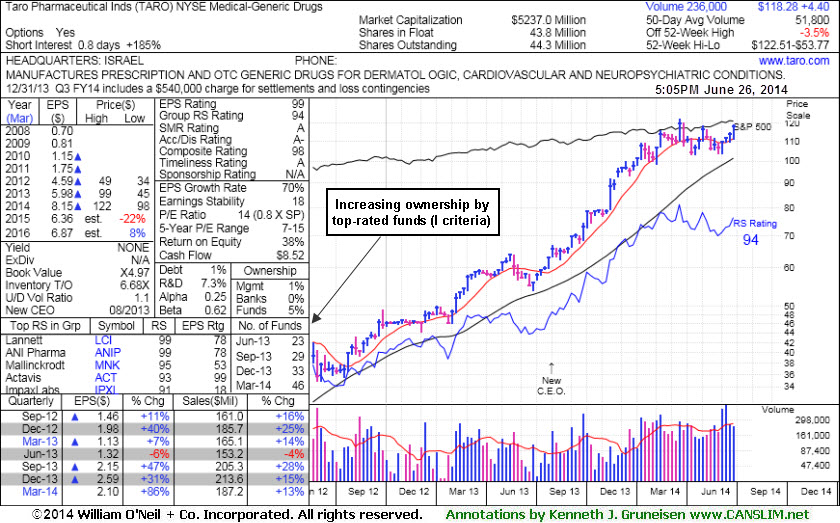
Keep in mind that disciplined investors avoid chasing stocks more than +5% above their pivot point or prior highs. This high-ranked Medical - Generic Drug firm was highlighted in yellow in the earlier mid-day report (read here) while approaching a pivot point cited based upon its 5/02/14 high plus 10 cents. Regular readers may have spotted it in black and white near the bottom of the 6/19/14 mid-day report (read here) - "Patient and disciplined investors may watch for a proper base to possibly develop and be noted in the weeks ahead. Reported earnings +86% on +13% sales revenues for the Mar '14 quarter, a 3rd consecutive quarterly comparison above the +25% minimum guideline (C criteria). The Israel-based Medical - Generic Drugs firm has seen the number of top-rated funds owning its shares rise from 2 in Mar '12 to 46 as of Mar '14, a reassuring sign concerning the I criteria."
TARO has a small supply (S criteria) of only 44.3 million shares outstanding, which is favorable, and any institutional buying or selling could lead to great price volatility. Disciplined investors always limit losses by selling any properly bought stock if it falls more than -7% from their purchase price.
 \ \
|
|
|
Color Codes Explained :
Y - Better candidates highlighted by our
staff of experts.
G - Previously featured
in past reports as yellow but may no longer be buyable under the
guidelines.
***Last / Change / Volume data in this table is the closing quote data***
Symbol/Exchange
Company Name
Industry Group |
PRICE |
CHANGE
(%Change) |
Day High |
Volume
(% DAV)
(% 50 day avg vol) |
52 Wk Hi
% From Hi |
Featured
Date |
Price
Featured |
Pivot Featured |
|
Max Buy |
ACT
-
NYSE
Actavis plc
Medical-Generic Drugs
|
$224.09
|
+1.26
0.57% |
$225.25
|
1,880,632
89.09% of 50 DAV
50 DAV is 2,111,000
|
$230.77
-2.89%
|
6/20/2014
|
$216.53
|
PP = $230.87
|
|
MB = $242.41
|
Most Recent Note - 6/24/2014 7:20:46 PM
Y - Tallied a 3rd consecutive gain today, approaching its pivot point based on its 2/26/14 high plus 10 cents. Subsequent volume-driven gains to new highs may trigger a technical buy signal. See the latest FSU analysis for more details and new annotated graphs.
>>> FEATURED STOCK ARTICLE : Volume Above Average as Generic Drug Firm Approaches Highs - 6/24/2014
View all notes |
Set NEW NOTE alert |
CANSLIM.net Company Profile |
SEC
News |
Chart |
Request a new note
C
A N
S L
I M


|
AFSI
-
NASDAQ
Amtrust Financial Svcs
INSURANCE - Property and; Casualty Insurance
|
$41.70
|
-0.48
-1.14% |
$43.05
|
315,114
46.96% of 50 DAV
50 DAV is 671,000
|
$47.10
-11.46%
|
5/21/2014
|
$44.85
|
PP = $44.85
|
|
MB = $47.09
|
Most Recent Note - 6/20/2014 5:49:04 PM
G - Still consolidating in a tight trading range above its 50 DMA line which acted as support. Disciplined investors always limit losses by selling any stock that falls more than -7% from their purchase price.
>>> FEATURED STOCK ARTICLE : Halted Slide at 50-Day Moving Average After Distributional Pressure - 6/6/2014
View all notes |
Set NEW NOTE alert |
CANSLIM.net Company Profile |
SEC
News |
Chart |
Request a new note
C
A N
S L
I M
|
AL
-
NYSE
Air Lease Corp Cl A
DIVERSIFIED SERVICES - Rental and Leasing Services
|
$38.58
|
-0.30
-0.77% |
$38.98
|
555,478
52.40% of 50 DAV
50 DAV is 1,060,000
|
$42.89
-10.05%
|
5/9/2014
|
$38.27
|
PP = $38.25
|
|
MB = $40.16
|
Most Recent Note - 6/25/2014 4:24:48 PM
G - Still consolidating near its 50 DMA line where it has found recent support. Any violation of its recent low ($36.55 on 6/13/017) would raise serious concerns and trigger a worrisome technical sell signal.
>>> FEATURED STOCK ARTICLE : Enduring Mild Distributional Pressure on Pullback - 6/11/2014
View all notes |
Set NEW NOTE alert |
CANSLIM.net Company Profile |
SEC
News |
Chart |
Request a new note
C
A N
S L
I M
|
BITA
-
NYSE
Bitauto Hldgs Ltd Ads
Internet-Content
|
$46.24
|
+1.24
2.76% |
$47.50
|
1,158,540
124.84% of 50 DAV
50 DAV is 928,000
|
$46.93
-1.47%
|
6/26/2014
|
$46.20
|
PP = $47.03
|
|
MB = $49.38
|
 Most Recent Note - 6/26/2014 6:21:50 PM
Y - It was highlighted in yellow in the earlier mid-day report (read here) with new new pivot point cited based on the 3/06/14 high plus 10 cents while noted - "A gain above the pivot point backed by at least +40% above average volume could trigger a technical buy signal. Fundamentals remain strong with respect to the C and A criteria as it reported earnings +100% on +47% sales revenues for the Mar '14 quarter since dropped from the Featured Stocks list on 1/27/14.

>>> FEATURED STOCK ARTICLE : Finished Strong and Challenged Pivot Point After Highlighted in Mid-Day Report - 1/8/2014
View all notes |
Set NEW NOTE alert |
CANSLIM.net Company Profile |
SEC
News |
Chart |
Request a new note
C
A N
S L
I M
|
BWLD
-
NASDAQ
Buffalo Wild Wings Inc
LEISURE - Restaurants
|
$164.17
|
+0.30
0.18% |
$165.17
|
486,599
111.10% of 50 DAV
50 DAV is 438,000
|
$166.35
-1.31%
|
6/19/2014
|
$158.52
|
PP = $159.91
|
|
MB = $167.91
|
Most Recent Note - 6/23/2014 12:15:56 PM
Y - Hitting a new 52-week high with today's volume-driven gain above its pivot point. No resistance remains due to overhead supply, and a strong finish may clinch a convincing technical buy signal. Disciplined investors avoid chasing stocks more than +5% above prior highs and always limit losses by selling any stock that falls more than -7% from their purchase price.
>>> FEATURED STOCK ARTICLE : Perched Near Highs With Strong Fundamentals - 6/19/2014
View all notes |
Set NEW NOTE alert |
CANSLIM.net Company Profile |
SEC
News |
Chart |
Request a new note
C
A N
S L
I M
|
Symbol/Exchange
Company Name
Industry Group |
PRICE |
CHANGE
(%Change) |
Day High |
Volume
(% DAV)
(% 50 day avg vol) |
52 Wk Hi
% From Hi |
Featured
Date |
Price
Featured |
Pivot Featured |
|
Max Buy |
EQM
-
NYSE
E Q T Midstream Partners
ENERGY - Oil and Gas Pipelines
|
$97.19
|
+0.89
0.92% |
$98.48
|
176,872
42.01% of 50 DAV
50 DAV is 421,000
|
$102.51
-5.19%
|
12/12/2013
|
$53.17
|
PP = $56.51
|
|
MB = $59.34
|
Most Recent Note - 6/25/2014 5:18:55 PM
G - Strength has continued despite fundamental flaws repeatedly noted. It is very extended from any sound base. See the latest FSU analysis for more details and new annotated graphs.
>>> FEATURED STOCK ARTICLE : Strength Continued Despite Fundamental Flaws - 6/25/2014
View all notes |
Set NEW NOTE alert |
CANSLIM.net Company Profile |
SEC
News |
Chart |
Request a new note
C
A N
S L
I M
|
GRFS
-
NASDAQ
Grifols Sa Ads
Medical-Ethical Drugs
|
$43.25
|
-0.40
-0.92% |
$43.40
|
586,607
82.50% of 50 DAV
50 DAV is 711,000
|
$46.66
-7.31%
|
5/15/2014
|
$41.14
|
PP = $43.55
|
|
MB = $45.73
|
Most Recent Note - 6/23/2014 12:25:10 PM
Y - Color code is changed to yellow again as it found prompt support and rebounded quickly after undercutting prior highs near $43 and briefly violating its 50 DMA line with above average volume behind today's considerable early loss. Disciplined investors always limit losses by selling any stock that falls more than -7% from their purchase price. Keep in mind that any stock which is sold can be bought again later if strength returns.
>>> FEATURED STOCK ARTICLE : Consolidating Just Below "Max Buy" Level - 6/17/2014
View all notes |
Set NEW NOTE alert |
CANSLIM.net Company Profile |
SEC
News |
Chart |
Request a new note
C
A N
S L
I M
|
HF
-
NYSE
H F F Inc Cl A
RETAIL - Grocery Stores
|
$36.69
|
+0.23
0.63% |
$36.93
|
313,243
173.06% of 50 DAV
50 DAV is 181,000
|
$36.47
0.60%
|
6/20/2014
|
$34.60
|
PP = $36.16
|
|
MB = $37.97
|
Most Recent Note - 6/26/2014 6:25:53 PM
Y - Hit a new 52-week high with today's 4th volume-driven gain in the span of 5 sessions. Its solid gain above its pivot point with +73% above average volume triggered a technical buy signal.
>>> FEATURED STOCK ARTICLE : Approached 52-Week High With Volume-Driven Gain - 6/23/2014
View all notes |
Set NEW NOTE alert |
CANSLIM.net Company Profile |
SEC
News |
Chart |
Request a new note
C
A N
S L
I M
|
ICON
-
NASDAQ
Iconix Brand Group Inc
CONSUMER NON-DURABLES - Textile - Apparel Footwear
|
$42.67
|
-0.04
-0.09% |
$42.91
|
418,263
77.31% of 50 DAV
50 DAV is 541,000
|
$44.81
-4.78%
|
6/5/2014
|
$43.54
|
PP = $43.44
|
|
MB = $45.61
|
Most Recent Note - 6/23/2014 5:52:52 PM
Y - Finished near the session low today with a loss on above average volume. Slumping near prior highs in the $43-42 area defining initial support to watch.
>>> FEATURED STOCK ARTICLE : Found Support Above Prior Highs During Consolidation - 6/18/2014
View all notes |
Set NEW NOTE alert |
CANSLIM.net Company Profile |
SEC
News |
Chart |
Request a new note
C
A N
S L
I M
|
KS
-
NYSE
Kapstone Paper&Packaging
MANUFACTURING - Paper and Packaging
|
$33.02
|
-0.27
-0.81% |
$33.55
|
742,751
77.37% of 50 DAV
50 DAV is 960,000
|
$34.43
-4.10%
|
6/20/2014
|
$32.30
|
PP = $31.92
|
|
MB = $33.52
|
Most Recent Note - 6/23/2014 12:28:54 PM
Y - Reversed into the red after briefly rallying beyond its "max buy" level in today's early session. Prior highs near $32 define initial support to watch on pullbacks. It was highlighted in yellow while rallying from a cup-with-handle base in the 6/20/14 mid-day report (read here).
>>> FEATURED STOCK ARTICLE : Four Times Average Volume Behind Big Breakout Gain - 6/20/2014
View all notes |
Set NEW NOTE alert |
CANSLIM.net Company Profile |
SEC
News |
Chart |
Request a new note
C
A N
S L
I M
|
Symbol/Exchange
Company Name
Industry Group |
PRICE |
CHANGE
(%Change) |
Day High |
Volume
(% DAV)
(% 50 day avg vol) |
52 Wk Hi
% From Hi |
Featured
Date |
Price
Featured |
Pivot Featured |
|
Max Buy |
PANW
-
NYSE
Palo Alto Networks
Computer Sftwr-Security
|
$80.88
|
+1.13
1.42% |
$82.19
|
2,185,157
122.83% of 50 DAV
50 DAV is 1,779,000
|
$82.27
-1.69%
|
5/29/2014
|
$75.95
|
PP = $72.50
|
|
MB = $76.13
|
Most Recent Note - 6/25/2014 12:29:10 PM
G - Still holding its ground stubbornly near its 52-week and all-time high. Prior highs near $72 define important support above its 50 DMA line.
>>> FEATURED STOCK ARTICLE : Encountered Distributional Pressure After Touching New 52-Week High - 6/12/2014
View all notes |
Set NEW NOTE alert |
CANSLIM.net Company Profile |
SEC
News |
Chart |
Request a new note
C
A N
S L
I M
|
SN
-
NYSE
Sanchez Energy Corp
ENERGY - Independent Oil and Gas
|
$37.13
|
-0.44
-1.17% |
$37.64
|
1,073,233
69.87% of 50 DAV
50 DAV is 1,536,000
|
$38.95
-4.67%
|
5/22/2014
|
$33.00
|
PP = $31.59
|
|
MB = $33.17
|
Most Recent Note - 6/25/2014 3:57:57 PM
G - Rebounding toward its 52-week high with today's big gain. It is very extended from its prior base. Disciplined investors avoid chasing extended stocks. Prior highs near $31-32 define support to watch on pullbacks.
>>> FEATURED STOCK ARTICLE : Finished Near Session Low After Hitting new 52-Week High - 6/9/2014
View all notes |
Set NEW NOTE alert |
CANSLIM.net Company Profile |
SEC
News |
Chart |
Request a new note
C
A N
S L
I M
|
TARO
-
NYSE
Taro Pharmaceutical Inds
DRUGS - Drug Manufacturers - Other
|
$118.28
|
+4.36
3.83% |
$119.29
|
101,772
199.55% of 50 DAV
50 DAV is 51,000
|
$122.51
-3.45%
|
6/26/2014
|
$117.31
|
PP = $118.90
|
|
MB = $124.85
|
Most Recent Note - 6/26/2014 6:19:05 PM
Y - Posted a solid gain backed by 2 times average volume after highlighted in yellow in the earlier mid-day report (read here) while approaching a pivot point based upon its 5/02/14 high plus 10 cents. Subsequent volume-driven gains above the pivot point may trigger a convincing technical buy signal. See the latest FSU analysis for more details and new annotated graphs.
>>> FEATURED STOCK ARTICLE : Fundamentally Strong Stock Challenging Prior Resistance Level - 6/26/2014
View all notes |
Set NEW NOTE alert |
CANSLIM.net Company Profile |
SEC
News |
Chart |
Request a new note
C
A N
S L
I M
|
TRN
-
NYSE
Trinity Industries Inc
TRANSPORTATION - Railroads
|
$43.02
|
-0.23
-0.53% |
$43.40
|
1,985,311
60.22% of 50 DAV
50 DAV is 3,297,000
|
$43.94
-2.10%
|
4/30/2014
|
$37.79
|
PP = $38.03
|
|
MB = $39.93
|
Most Recent Note - 6/25/2014 3:59:12 PM
G - Gapped up today approaching its 52-week high. It is extended from its prior base. Recent lows in the $39-40 area and its 50 DMA line coincide defining important near-term support to watch. Do not be confused by the 2:1 share split effective 6/20/14 (Featured Price, Pivot Point, and Max Buy level have been adjusted accordingly).
>>> FEATURED STOCK ARTICLE : Recent Lows and 50-Day Moving Average Line Define Near-Term Support - 6/16/2014
View all notes |
Set NEW NOTE alert |
CANSLIM.net Company Profile |
SEC
News |
Chart |
Request a new note
C
A N
S L
I M
|
WLK
-
NYSE
Westlake Chemical Corp
CHEMICALS - Specialty Chemicals
|
$83.05
|
+0.00
0.00% |
$83.17
|
482,654
67.04% of 50 DAV
50 DAV is 720,000
|
$85.01
-2.31%
|
4/29/2014
|
$72.79
|
PP = $69.31
|
|
MB = $72.78
|
Most Recent Note - 6/20/2014 5:51:52 PM
G - Inched to another new 52-week high with today's 4th consecutive gain. Prior highs near $77 define important near-term support to watch on pullbacks.
>>> FEATURED STOCK ARTICLE : Chemical Firm Quietly Posted 7th Consecutive Weekly Gain - 6/13/2014
View all notes |
Set NEW NOTE alert |
CANSLIM.net Company Profile |
SEC
News |
Chart |
Request a new note
C
A N
S L
I M
|
Symbol/Exchange
Company Name
Industry Group |
PRICE |
CHANGE
(%Change) |
Day High |
Volume
(% DAV)
(% 50 day avg vol) |
52 Wk Hi
% From Hi |
Featured
Date |
Price
Featured |
Pivot Featured |
|
Max Buy |
|
|
|
THESE ARE NOT BUY RECOMMENDATIONS!
Comments contained in the body of this report are technical
opinions only. The material herein has been obtained
from sources believed to be reliable and accurate, however,
its accuracy and completeness cannot be guaranteed.
This site is not an investment advisor, hence it does
not endorse or recommend any securities or other investments.
Any recommendation contained in this report may not
be suitable for all investors and it is not to be deemed
an offer or solicitation on our part with respect to
the purchase or sale of any securities. All trademarks,
service marks and trade names appearing in this report
are the property of their respective owners, and are
likewise used for identification purposes only.
This report is a service available
only to active Paid Premium Members.
You may opt-out of receiving report notifications
at any time. Questions or comments may be submitted
by writing to Premium Membership Services 665 S.E. 10 Street, Suite 201 Deerfield Beach, FL 33441-5634 or by calling 1-800-965-8307
or 954-785-1121.
|
|
|

