You are not logged in.
This means you
CAN ONLY VIEW reports that were published prior to Monday, April 21, 2025.
You
MUST UPGRADE YOUR MEMBERSHIP if you want to see any current reports.
AFTER MARKET UPDATE - FRIDAY, JUNE 27TH, 2014
Previous After Market Report Next After Market Report >>>
|
|
|
|
DOW |
+5.71 |
16,851.84 |
+0.03% |
|
Volume |
1,476,530,850 |
+155% |
|
Volume |
2,492,429,950 |
+72% |
|
NASDAQ |
+18.88 |
4,397.93 |
+0.43% |
|
Advancers |
2,047 |
64% |
|
Advancers |
1,785 |
61% |
|
S&P 500 |
+3.74 |
1,960.96 |
+0.19% |
|
Decliners |
1,034 |
32% |
|
Decliners |
1,051 |
36% |
|
Russell 2000 |
+8.79 |
1,189.50 |
+0.74% |
|
52 Wk Highs |
215 |
|
|
52 Wk Highs |
83 |
|
|
S&P 600 |
+5.03 |
680.61 |
+0.74% |
|
52 Wk Lows |
10 |
|
|
52 Wk Lows |
31 |
|
|
 |
Major Averages Finished Week on the Rise With Positive Breadth
Kenneth J. Gruneisen - Passed the CAN SLIM® Master's Exam
For the week, the Dow Jones Industrial Average declined -0.6% and the S&P 500 Index fell -0.1%. The Nasdaq Composite Index managed to gain +0.7% this week, its second-straight weekly advance. Stocks finished with minor gains in a volatile trading session on Friday. The volume was reported higher than the prior session total on the NYSE and on the Nasdaq exchange, a reassuring sign that the institutional crowd did some buying. Breadth was positive as advancers led decliners by a 2-1 margin on the NYSE and by a 7-4 margin on the Nasdaq exchange. There were 50 high-ranked companies from the CANSLIM.net Leaders List that made new 52-week highs and appeared on the CANSLIM.net BreakOuts Page, up from Thursday's total of 26 stocks. New 52-week highs expanded and solidly outnumbered new 52-week lows on the NYSE and on the Nasdaq exchange. There were gains for 10 of the 15 high-ranked companies currently included on the Featured Stocks Page. The S&P 500 Index and Dow Jones Industrial Average recently surged into new high territory with healthy leadership (new 52-week highs) sending a reassuring signal that the market direction (M criteria) is in a "confirmed uptrend". Any new buying efforts should be selective and focused in stocks meeting all key criteria of the fact-based investment system.
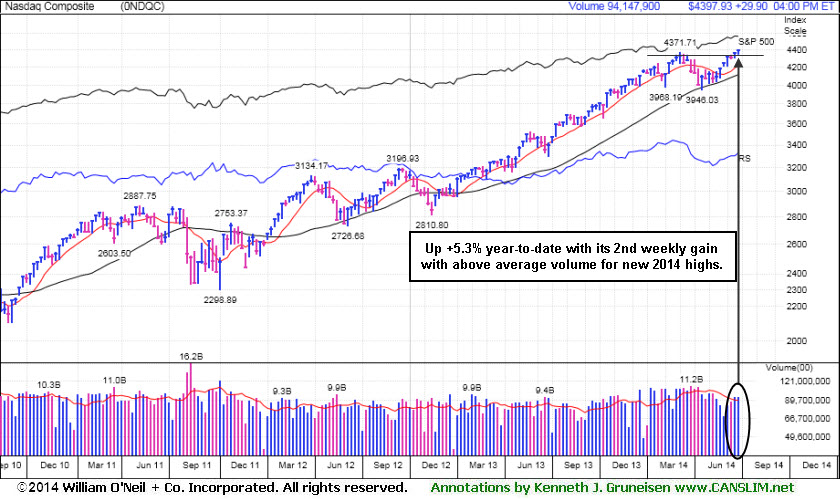
PICTURED: The Nasdaq Composite Index advanced more than 18 points to 4397 on Friday. The tech-heavy index is up +5.3% year-to-date. It tallied a 2nd consecutive weekly gain for new 2014 highs.
Equities spent the day toggling between gains and losses as investors digested economic data and profit tallies. The University of Michigan's consumer confidence survey revealed sentiment improved more than anticipated in June to the best level since April. Earnings results were mixed. DuPont (DD -3.6%) fell, pacing a retreat in the materials sector, after the company cut its full-year profit outlook. On the upside, shares of Nike (NKE +1.6%) and Finish Line (FINL +1.3%) rose after both companies posted earnings above analyst expectations.
Overall, seven of the 10 S&P 500 sectors advanced. Technology and utilities were the best performing groups as Apple (AAPL +1.1%) and Duke Energy (DUK +0.7%) rose. Energy and health care stocks declined including Exxon Mobil (XOM -0.7%) and Merck (MRK -1.5%).
Treasuries finished little changed. The 10-year note was off 1/32 to yield 2.53%.
The CANSLIM.net Featured Stocks Page shows the most action-worthy candidates and their latest notes and a Headline Link directs members to the latest detailed analysis with data-packed graphs annotated by a Certified expert along with links to additional resources. The Premium Member Homepage includes "dynamic archives" to all prior pay reports published. Watch for an announcement via email concerning the next WEBCAST.
|
 Kenneth J. Gruneisen started out as a licensed stockbroker in August 1987, a couple of months prior to the historic stock market crash that took the Dow Jones Industrial Average down -22.6% in a single day. He has published daily fact-based fundamental and technical analysis on high-ranked stocks online for two decades. Through FACTBASEDINVESTING.COM, Kenneth provides educational articles, news, market commentary, and other information regarding proven investment systems that work in good times and bad.
Comments contained in the body of this report are technical opinions only and are not necessarily those of Gruneisen Growth Corp. The material herein has been obtained from sources believed to be reliable and accurate, however, its accuracy and completeness cannot be guaranteed. Our firm, employees, and customers may effect transactions, including transactions contrary to any recommendation herein, or have positions in the securities mentioned herein or options with respect thereto. Any recommendation contained in this report may not be suitable for all investors and it is not to be deemed an offer or solicitation on our part with respect to the purchase or sale of any securities. |
|
 |
Energy and Tech Groups Led Other Gainers
Kenneth J. Gruneisen - Passed the CAN SLIM® Master's Exam
The Retail Index ($RLX +0.01%) finished flat on Friday and there was little change but a slightly positive bias for the Gold & Silver Index ($XAU +0.13%), Broker/Dealer Index ($XBD +0.15%), and the Bank Index ($BKX +0.24%). The Semiconductor Index ($SOX +0.16%) and Biotechnology Index ($BTK +0.33%) were both outpaced by the Networking Index ($NWX +1.02%) as the tech sector helped the Nasdaq Composite Index outpace its peers. The Oil Services Index ($OSX +1.16%) rose an the Integrated Oil Index ($XOI -0.22%) edged lower.
Charts courtesy www.stockcharts.com
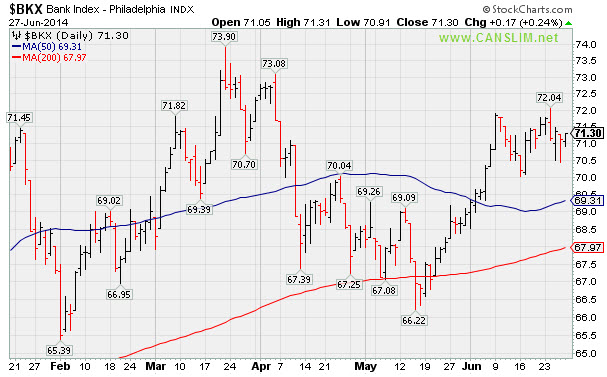
PICTURED: The Bank Index ($BKX +0.24%) is consolidating above its 50-day and 200-day moving average (DMA) lines.
Charts courtesy www.stockcharts.com
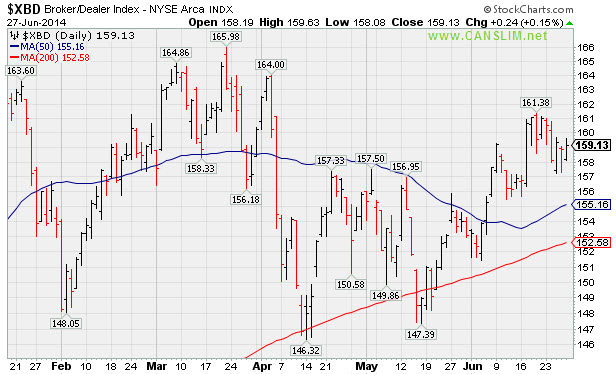
PICTURED: The Broker/Dealer Index ($XBD +0.15%) is consolidating above its 50-day and 200-day moving average (DMA) lines.
| Oil Services |
$OSX |
308.86 |
+3.55 |
+1.16% |
+9.90% |
| Integrated Oil |
$XOI |
1,684.27 |
-3.69 |
-0.22% |
+12.05% |
| Semiconductor |
$SOX |
629.27 |
+0.99 |
+0.16% |
+17.61% |
| Networking |
$NWX |
335.71 |
+3.40 |
+1.02% |
+3.63% |
| Broker/Dealer |
$XBD |
159.13 |
+0.24 |
+0.15% |
-0.89% |
| Retail |
$RLX |
888.12 |
+0.09 |
+0.01% |
-5.50% |
| Gold & Silver |
$XAU |
99.10 |
+0.13 |
+0.13% |
+17.77% |
| Bank |
$BKX |
71.30 |
+0.17 |
+0.24% |
+2.95% |
| Biotech |
$BTK |
2,764.48 |
+9.04 |
+0.33% |
+18.63% |
|
|
|
 |
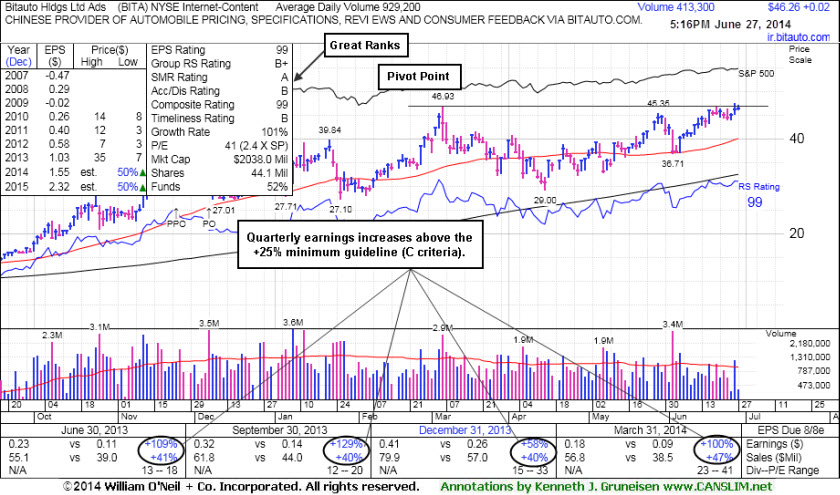
Perched At High With No Resistance Remaining Due to Overhead Supply
Kenneth J. Gruneisen - Passed the CAN SLIM® Master's Exam
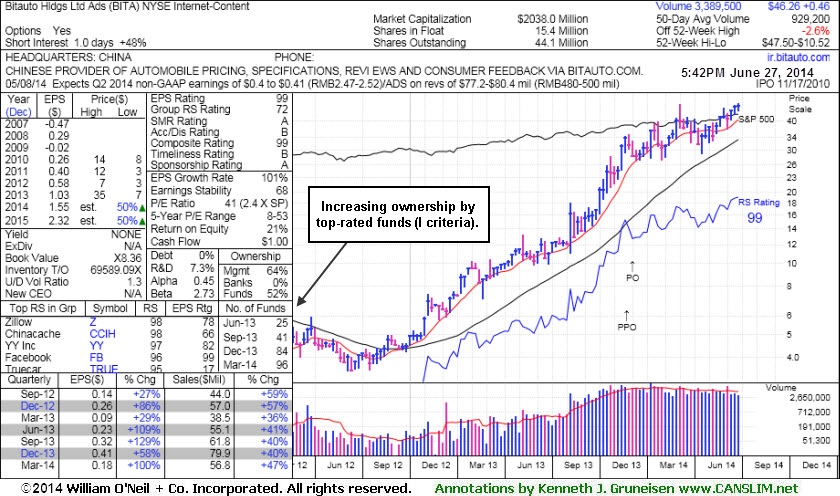
Biotauto Hldgs Ltd Ads (BITA +$0.02 +0.04% to $46.26) highlighted in yellow in the 6/26/14 mid-day report (read here) with pivot point cited based on the 3/06/14 high plus 10 cents while noted - "A gain above the pivot point backed by at least +40% above average volume could trigger a technical buy signal. Fundamentals remain strong with respect to the C and A criteria as it reported earnings +100% on +47% sales revenues for the Mar '14 quarter since dropped from the Featured Stocks list on 1/27/14.
Now it faces little overhead supply to act as resistance. Its 50-day moving average (DMA) line acted as support during its recent consolidation before rebounding.
BITA was last shown in this FSU section on 1/08/14 with an annotated graphs under the headline,"Finished Strong and Challenged Pivot Point After Highlighted in Mid-Day Report". Members were previously - "Like any stock that is dropped from the Featured Stocks list, if fundamentals remain strong while a new base forms, and strength eventually returns, it may one day return to the Featured Stocks list." It was first highlighted in the 8/07/13 mid-day report in yellow at $12.01 with the prior pivot point based on its 5/08/13 high plus 10 cents (read here).
This China-based Internet-Content firm's quarterly and annual earnings (C and A criteria) history has been strong. Its small supply (S criteria) of only 15.4 million shares in the public float can contribute to great volatility in the event of institutional buying or selling. There are 96 top-rated mutual funds as of Mar '14 owning an interest in the company, up from 25 in Jun '13, a reassuring sign concerning the I criteria.
|
|
|
Color Codes Explained :
Y - Better candidates highlighted by our
staff of experts.
G - Previously featured
in past reports as yellow but may no longer be buyable under the
guidelines.
***Last / Change / Volume data in this table is the closing quote data***
Symbol/Exchange
Company Name
Industry Group |
PRICE |
CHANGE
(%Change) |
Day High |
Volume
(% DAV)
(% 50 day avg vol) |
52 Wk Hi
% From Hi |
Featured
Date |
Price
Featured |
Pivot Featured |
|
Max Buy |
ACT
-
NYSE
Actavis plc
Medical-Generic Drugs
|
$223.27
|
-0.82
-0.37% |
$226.23
|
3,545,534
167.96% of 50 DAV
50 DAV is 2,111,000
|
$230.77
-3.25%
|
6/20/2014
|
$216.53
|
PP = $230.87
|
|
MB = $242.41
|
Most Recent Note - 6/24/2014 7:20:46 PM
Y - Tallied a 3rd consecutive gain today, approaching its pivot point based on its 2/26/14 high plus 10 cents. Subsequent volume-driven gains to new highs may trigger a technical buy signal. See the latest FSU analysis for more details and new annotated graphs.
>>> FEATURED STOCK ARTICLE : Volume Above Average as Generic Drug Firm Approaches Highs - 6/24/2014
View all notes |
Set NEW NOTE alert |
CANSLIM.net Company Profile |
SEC
News |
Chart |
Request a new note
C
A N
S L
I M


|
AFSI
-
NASDAQ
Amtrust Financial Svcs
INSURANCE - Property and; Casualty Insurance
|
$41.55
|
+0.05
0.12% |
$41.72
|
477,941
71.23% of 50 DAV
50 DAV is 671,000
|
$47.10
-11.78%
|
5/21/2014
|
$44.85
|
PP = $44.85
|
|
MB = $47.09
|
 Most Recent Note - 6/27/2014 4:51:35 PM
G - Relative Strength rating has slumped to 79, below the 80+ minimum guideline for buy candidates while this week it quietly sank below its 50 DMA line ($42.07) raising concerns. A prompt rebound above the 50 DMA line is needed to help its outlook improve.
>>> FEATURED STOCK ARTICLE : Halted Slide at 50-Day Moving Average After Distributional Pressure - 6/6/2014
View all notes |
Set NEW NOTE alert |
CANSLIM.net Company Profile |
SEC
News |
Chart |
Request a new note
C
A N
S L
I M
|
AL
-
NYSE
Air Lease Corp Cl A
DIVERSIFIED SERVICES - Rental and Leasing Services
|
$38.18
|
-0.40
-1.04% |
$38.73
|
1,989,145
187.66% of 50 DAV
50 DAV is 1,060,000
|
$42.89
-10.98%
|
5/9/2014
|
$38.27
|
PP = $38.25
|
|
MB = $40.16
|
Most Recent Note - 6/27/2014 5:11:13 PM
G - Small loss today with above average volume raised concerns as it closed just below its 50 DMA line ($38.63). Any violation of its recent low ($36.55 on 6/13/17) would raise serious concerns and trigger a worrisome technical sell signal.
>>> FEATURED STOCK ARTICLE : Enduring Mild Distributional Pressure on Pullback - 6/11/2014
View all notes |
Set NEW NOTE alert |
CANSLIM.net Company Profile |
SEC
News |
Chart |
Request a new note
C
A N
S L
I M
|
BITA
-
NYSE
Bitauto Hldgs Ltd Ads
Internet-Content
|
$46.26
|
+0.02
0.04% |
$47.10
|
413,314
44.54% of 50 DAV
50 DAV is 928,000
|
$47.50
-2.61%
|
6/26/2014
|
$46.20
|
PP = $47.03
|
|
MB = $49.38
|
Most Recent Note - 6/27/2014 6:52:23 PM
Y - Perched at its 52-week high today, it quietly held its ground. See the latest FSU analysis for more details and new annotated graphs. It was highlighted in yellow in the 6/26/14 mid-day report (read here) with while noted - "A gain above the pivot point backed by at least +40% above average volume could trigger a technical buy signal."
>>> FEATURED STOCK ARTICLE : Perched At High With No Resistance Remaining Due to Overhead Supply - 6/27/2014
View all notes |
Set NEW NOTE alert |
CANSLIM.net Company Profile |
SEC
News |
Chart |
Request a new note
C
A N
S L
I M
|
BWLD
-
NASDAQ
Buffalo Wild Wings Inc
LEISURE - Restaurants
|
$164.13
|
-0.04
-0.02% |
$166.40
|
641,772
146.52% of 50 DAV
50 DAV is 438,000
|
$166.35
-1.33%
|
6/19/2014
|
$158.52
|
PP = $159.91
|
|
MB = $167.91
|
Most Recent Note - 6/27/2014 5:03:14 PM
Y - Churned above average volume today while hovering near its 52-week high. A considerable volume-driven gain above its pivot point on 6/23/14 triggered a technical buy signal. No resistance remains due to overhead supply. Disciplined investors avoid chasing stocks more than +5% above prior highs and always limit losses by selling any stock that falls more than -7% from their purchase price.
>>> FEATURED STOCK ARTICLE : Perched Near Highs With Strong Fundamentals - 6/19/2014
View all notes |
Set NEW NOTE alert |
CANSLIM.net Company Profile |
SEC
News |
Chart |
Request a new note
C
A N
S L
I M
|
Symbol/Exchange
Company Name
Industry Group |
PRICE |
CHANGE
(%Change) |
Day High |
Volume
(% DAV)
(% 50 day avg vol) |
52 Wk Hi
% From Hi |
Featured
Date |
Price
Featured |
Pivot Featured |
|
Max Buy |
EQM
-
NYSE
E Q T Midstream Partners
ENERGY - Oil and Gas Pipelines
|
$96.54
|
-0.65
-0.67% |
$97.98
|
119,391
28.36% of 50 DAV
50 DAV is 421,000
|
$102.51
-5.82%
|
12/12/2013
|
$53.17
|
PP = $56.51
|
|
MB = $59.34
|
Most Recent Note - 6/25/2014 5:18:55 PM
G - Strength has continued despite fundamental flaws repeatedly noted. It is very extended from any sound base. See the latest FSU analysis for more details and new annotated graphs.
>>> FEATURED STOCK ARTICLE : Strength Continued Despite Fundamental Flaws - 6/25/2014
View all notes |
Set NEW NOTE alert |
CANSLIM.net Company Profile |
SEC
News |
Chart |
Request a new note
C
A N
S L
I M
|
GRFS
-
NASDAQ
Grifols Sa Ads
Medical-Ethical Drugs
|
$43.91
|
+0.66
1.53% |
$43.91
|
372,166
52.34% of 50 DAV
50 DAV is 711,000
|
$46.66
-5.89%
|
5/15/2014
|
$41.14
|
PP = $43.55
|
|
MB = $45.73
|
Most Recent Note - 6/27/2014 5:06:01 PM
Y - Halted its slide today with a small gain on light volume. Subsequent deterioration below its 50 DMA line would raise more serious concerns. Disciplined investors always limit losses by selling any stock that falls more than -7% from their purchase price. Keep in mind that any stock which is sold can be bought again later if strength returns.
>>> FEATURED STOCK ARTICLE : Consolidating Just Below "Max Buy" Level - 6/17/2014
View all notes |
Set NEW NOTE alert |
CANSLIM.net Company Profile |
SEC
News |
Chart |
Request a new note
C
A N
S L
I M
|
HF
-
NYSE
H F F Inc Cl A
RETAIL - Grocery Stores
|
$37.37
|
+0.68
1.85% |
$37.58
|
558,858
308.76% of 50 DAV
50 DAV is 181,000
|
$36.93
1.19%
|
6/20/2014
|
$34.60
|
PP = $36.16
|
|
MB = $37.97
|
Most Recent Note - 6/27/2014 1:00:05 PM
Y - Hitting another new 52-week high with a gain today following 4 volume-driven gains in the span of 5 sessions. Its solid gain above its pivot point on the prior session with +73% above average volume triggered a technical buy signal.
>>> FEATURED STOCK ARTICLE : Approached 52-Week High With Volume-Driven Gain - 6/23/2014
View all notes |
Set NEW NOTE alert |
CANSLIM.net Company Profile |
SEC
News |
Chart |
Request a new note
C
A N
S L
I M
|
ICON
-
NASDAQ
Iconix Brand Group Inc
CONSUMER NON-DURABLES - Textile - Apparel Footwear
|
$42.75
|
+0.08
0.19% |
$42.97
|
1,075,576
198.81% of 50 DAV
50 DAV is 541,000
|
$44.81
-4.60%
|
6/5/2014
|
$43.54
|
PP = $43.44
|
|
MB = $45.61
|
Most Recent Note - 6/27/2014 5:08:32 PM
Y - Small gain today with above average volume while consolidating above its 50 DMA line ($41.93) and prior highs in the $43-42 area defining important support to watch.
>>> FEATURED STOCK ARTICLE : Found Support Above Prior Highs During Consolidation - 6/18/2014
View all notes |
Set NEW NOTE alert |
CANSLIM.net Company Profile |
SEC
News |
Chart |
Request a new note
C
A N
S L
I M
|
KS
-
NYSE
Kapstone Paper&Packaging
MANUFACTURING - Paper and Packaging
|
$33.34
|
+0.32
0.97% |
$33.43
|
756,391
78.79% of 50 DAV
50 DAV is 960,000
|
$34.43
-3.17%
|
6/20/2014
|
$32.30
|
PP = $31.92
|
|
MB = $33.52
|
Most Recent Note - 6/27/2014 4:58:24 PM
Y - Tallied a small gain today with light volume and finished at a best-ever close very near its "max buy" level. Prior highs near $32 define initial support to watch on pullbacks. Held its ground stubbornly since highlighted in yellow while rallying from a "cup-with-handle" base in the 6/20/14 mid-day report (read here).
>>> FEATURED STOCK ARTICLE : Four Times Average Volume Behind Big Breakout Gain - 6/20/2014
View all notes |
Set NEW NOTE alert |
CANSLIM.net Company Profile |
SEC
News |
Chart |
Request a new note
C
A N
S L
I M
|
Symbol/Exchange
Company Name
Industry Group |
PRICE |
CHANGE
(%Change) |
Day High |
Volume
(% DAV)
(% 50 day avg vol) |
52 Wk Hi
% From Hi |
Featured
Date |
Price
Featured |
Pivot Featured |
|
Max Buy |
PANW
-
NYSE
Palo Alto Networks
Computer Sftwr-Security
|
$81.21
|
+0.33
0.41% |
$81.86
|
1,858,118
104.45% of 50 DAV
50 DAV is 1,779,000
|
$82.27
-1.29%
|
5/29/2014
|
$75.95
|
PP = $72.50
|
|
MB = $76.13
|
Most Recent Note - 6/27/2014 5:00:44 PM
G - Tallied its 3rd consecutive small gain today for a best-ever close. Holding its ground stubbornly near its 52-week and all-time high, making little headway while churning higher volume this week. Prior highs near $72 define important support above its 50 DMA line.
>>> FEATURED STOCK ARTICLE : Encountered Distributional Pressure After Touching New 52-Week High - 6/12/2014
View all notes |
Set NEW NOTE alert |
CANSLIM.net Company Profile |
SEC
News |
Chart |
Request a new note
C
A N
S L
I M
|
SN
-
NYSE
Sanchez Energy Corp
ENERGY - Independent Oil and Gas
|
$37.12
|
-0.01
-0.03% |
$37.30
|
1,652,633
107.59% of 50 DAV
50 DAV is 1,536,000
|
$38.95
-4.70%
|
5/22/2014
|
$33.00
|
PP = $31.59
|
|
MB = $33.17
|
Most Recent Note - 6/25/2014 3:57:57 PM
G - Rebounding toward its 52-week high with today's big gain. It is very extended from its prior base. Disciplined investors avoid chasing extended stocks. Prior highs near $31-32 define support to watch on pullbacks.
>>> FEATURED STOCK ARTICLE : Finished Near Session Low After Hitting new 52-Week High - 6/9/2014
View all notes |
Set NEW NOTE alert |
CANSLIM.net Company Profile |
SEC
News |
Chart |
Request a new note
C
A N
S L
I M
|
TARO
-
NYSE
Taro Pharmaceutical Inds
DRUGS - Drug Manufacturers - Other
|
$137.97
|
+19.69
16.65% |
$138.67
|
227,446
445.97% of 50 DAV
50 DAV is 51,000
|
$122.51
12.62%
|
6/26/2014
|
$117.31
|
PP = $118.90
|
|
MB = $124.85
|
Most Recent Note - 6/27/2014 1:17:50 PM
G - Considerable volume-driven gain today rallying above its pivot point and hitting a new 52-week high, triggering a technical buy signal yet quickly getting extended beyond its "max buy" level. Color code is changed to green. Highlighted in yellow in the 6/26/14 mid-day report (read here) while approaching the pivot point based upon its 5/02/14 high plus 10 cents. See the latest FSU analysis for more details and new annotated graphs.
>>> FEATURED STOCK ARTICLE : Fundamentally Strong Stock Challenging Prior Resistance Level - 6/26/2014
View all notes |
Set NEW NOTE alert |
CANSLIM.net Company Profile |
SEC
News |
Chart |
Request a new note
C
A N
S L
I M
|
TRN
-
NYSE
Trinity Industries Inc
TRANSPORTATION - Railroads
|
$43.08
|
+0.06
0.14% |
$44.87
|
5,639,119
171.04% of 50 DAV
50 DAV is 3,297,000
|
$43.94
-1.96%
|
4/30/2014
|
$37.79
|
PP = $38.03
|
|
MB = $39.93
|
Most Recent Note - 6/27/2014 5:14:24 PM
G - Hit a new 52-week high today but it erased most of its gain and ended near the session low while trading above average volume, a sign of distributional pressure termed "churning". Previously noted - "It is extended from its prior base. Recent lows in the $39-40 area and its 50 DMA line coincide defining important near-term support to watch. Do not be confused by the 2:1 share split effective 6/20/14 (Featured Price, Pivot Point, and Max Buy level have been adjusted accordingly)."
>>> FEATURED STOCK ARTICLE : Recent Lows and 50-Day Moving Average Line Define Near-Term Support - 6/16/2014
View all notes |
Set NEW NOTE alert |
CANSLIM.net Company Profile |
SEC
News |
Chart |
Request a new note
C
A N
S L
I M
|
WLK
-
NYSE
Westlake Chemical Corp
CHEMICALS - Specialty Chemicals
|
$83.56
|
+0.51
0.61% |
$83.70
|
535,102
74.32% of 50 DAV
50 DAV is 720,000
|
$85.01
-1.71%
|
4/29/2014
|
$72.79
|
PP = $69.31
|
|
MB = $72.78
|
Most Recent Note - 6/27/2014 4:53:22 PM
G - Hovering near its 52-week high, extended from any sound base pattern. Prior highs near $77 define important near-term support to watch on pullbacks.
>>> FEATURED STOCK ARTICLE : Chemical Firm Quietly Posted 7th Consecutive Weekly Gain - 6/13/2014
View all notes |
Set NEW NOTE alert |
CANSLIM.net Company Profile |
SEC
News |
Chart |
Request a new note
C
A N
S L
I M
|
Symbol/Exchange
Company Name
Industry Group |
PRICE |
CHANGE
(%Change) |
Day High |
Volume
(% DAV)
(% 50 day avg vol) |
52 Wk Hi
% From Hi |
Featured
Date |
Price
Featured |
Pivot Featured |
|
Max Buy |
|
|
|
THESE ARE NOT BUY RECOMMENDATIONS!
Comments contained in the body of this report are technical
opinions only. The material herein has been obtained
from sources believed to be reliable and accurate, however,
its accuracy and completeness cannot be guaranteed.
This site is not an investment advisor, hence it does
not endorse or recommend any securities or other investments.
Any recommendation contained in this report may not
be suitable for all investors and it is not to be deemed
an offer or solicitation on our part with respect to
the purchase or sale of any securities. All trademarks,
service marks and trade names appearing in this report
are the property of their respective owners, and are
likewise used for identification purposes only.
This report is a service available
only to active Paid Premium Members.
You may opt-out of receiving report notifications
at any time. Questions or comments may be submitted
by writing to Premium Membership Services 665 S.E. 10 Street, Suite 201 Deerfield Beach, FL 33441-5634 or by calling 1-800-965-8307
or 954-785-1121.
|
|
|

