You are not logged in.
This means you
CAN ONLY VIEW reports that were published prior to Monday, April 7, 2025.
You
MUST UPGRADE YOUR MEMBERSHIP if you want to see any current reports.
AFTER MARKET UPDATE - WEDNESDAY, JUNE 25TH, 2014
Previous After Market Report Next After Market Report >>>
|
|
|
|
DOW |
+49.38 |
16,867.51 |
+0.29% |
|
Volume |
638,540,770 |
+1% |
|
Volume |
1,584,343,160 |
-14% |
|
NASDAQ |
+29.40 |
4,379.76 |
+0.68% |
|
Advancers |
2,123 |
67% |
|
Advancers |
1,839 |
62% |
|
S&P 500 |
+9.55 |
1,959.53 |
+0.49% |
|
Decliners |
943 |
30% |
|
Decliners |
1,029 |
35% |
|
Russell 2000 |
+9.44 |
1,182.68 |
+0.80% |
|
52 Wk Highs |
146 |
|
|
52 Wk Highs |
46 |
|
|
S&P 600 |
+4.71 |
677.15 |
+0.70% |
|
52 Wk Lows |
24 |
|
|
52 Wk Lows |
29 |
|
|
 |
Nasdaq Composite Index Finished at New 2014 High
Kenneth J. Gruneisen - Passed the CAN SLIM® Master's Exam
The major averages snapped a two-day retreat on Wednesday. The session's volume was reported slightly higher than the prior session total on the NYSE but volume was lighter on the Nasdaq exchange. Advancers led decliners by more than a 2-1 margin on the NYSE and by a 9-5 margin on the Nasdaq exchange. Leadership contracted as here were 27 high-ranked companies from the CANSLIM.net Leaders List that made new 52-week highs and appeared on the CANSLIM.net BreakOuts Page, down from the total of 50 stocks on the prior session. New 52-week highs contracted yet still outnumbered new 52-week lows on the NYSE and Nasdaq exchange. There were gains for 8 of the 13 high-ranked companies currently included on the Featured Stocks Page. The S&P 500 Index and Dow Jones Industrial Average recently surged into new high territory with healthy leadership (new 52-week highs) sending a reassuring signal that the market direction (M criteria) is in a "confirmed uptrend". Any new buying efforts should be selective and focused in stocks meeting all key criteria of the fact-based investment system.
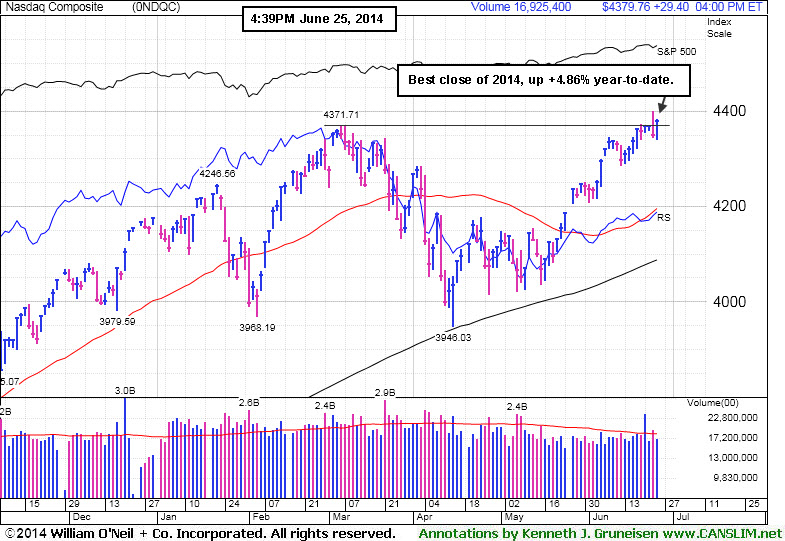
PICTURED: The Nasdaq Composite Index rose 29 points to 4,379, its best close of 2014. The tech-heavy index is up +4.8% year-to-date.
Another batch of economic data was in focus. The final revision to first-quarter GDP showed the U.S. economy contracted at a more than expected annualized rate of 2.9%. In addition, durable goods orders dropped by -1% in May, the largest decline since January. A separate report revealed the U.S. services sector expanded in June at the fastest pace in at least 4-1/2 years.
Overall, nine of the 10 S&P 500 sectors finished in positive territory. Shares of Pfizer (PFE +1.7%) were on the rise while health care and consumer discretionary were the best performing groups. CBS Corp (CBS +6.4%) and Walt Disney (DIS +1.5%) rose following a U.S. Supreme Court ruling that Aereo is violating broadcaster rights. Materials also helped lift the market. Monsanto jumped (MON +5.3%) jumped after the company boosted its full-year forecast and announced a $10 billion share repurchase plan. Consumer staples lagged behind. General Mills (GIS -3.6%) after reporting earnings results below analyst estimates.
Treasuries advanced and a government auction of five-year notes drew higher-than-average demand. The 10-year note gained 5/32 to yield 2.56%.
The CANSLIM.net Featured Stocks Page shows the most action-worthy candidates and their latest notes and a Headline Link directs members to the latest detailed analysis with data-packed graphs annotated by a Certified expert along with links to additional resources. The Premium Member Homepage includes "dynamic archives" to all prior pay reports published. Watch for an announcement via email concerning the next WEBCAST.
|
 Kenneth J. Gruneisen started out as a licensed stockbroker in August 1987, a couple of months prior to the historic stock market crash that took the Dow Jones Industrial Average down -22.6% in a single day. He has published daily fact-based fundamental and technical analysis on high-ranked stocks online for two decades. Through FACTBASEDINVESTING.COM, Kenneth provides educational articles, news, market commentary, and other information regarding proven investment systems that work in good times and bad.
Comments contained in the body of this report are technical opinions only and are not necessarily those of Gruneisen Growth Corp. The material herein has been obtained from sources believed to be reliable and accurate, however, its accuracy and completeness cannot be guaranteed. Our firm, employees, and customers may effect transactions, including transactions contrary to any recommendation herein, or have positions in the securities mentioned herein or options with respect thereto. Any recommendation contained in this report may not be suitable for all investors and it is not to be deemed an offer or solicitation on our part with respect to the purchase or sale of any securities. |
|
 |
Financial and Commodity-Linked Groups Led Gainers
Kenneth J. Gruneisen - Passed the CAN SLIM® Master's Exam
Financial shares were a positive influence on the major averages on Wednesday as the Broker/Dealer Index ($XBD +0.78%) outpaced the Bank Index ($BKX +0.28%). The Retail Index ($RLX +0.35%) posted a modest gain while the Networking Index ($NWX +0.25%) and Semiconductor Index ($SOX +0.38%) both posted small gains and the Biotechnology Index ($BTK +0.01%) finished flat. Commodity-linked groups had a positive bias as the Gold & Silver Index ($XAU +0.87%) and the Oil Services Index ($OSX +0.93%) rose, but the Integrated Oil Index ($XOI -0.34%) was a laggard as it ended sightly lower on the mostly positive session.
Charts courtesy www.stockcharts.com
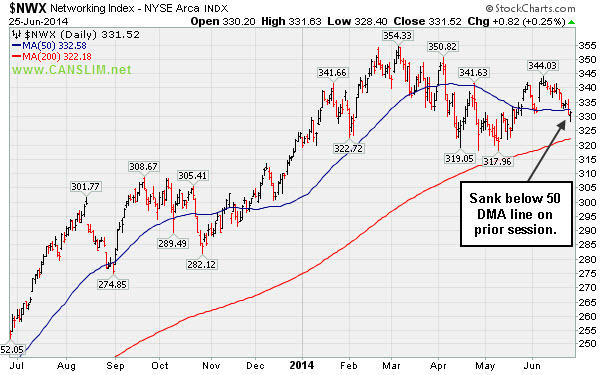
PICTURED: The Networking Index ($NWX +0.25%) sank below its 50-day moving average (DMA) line on the prior session.
| Oil Services |
$OSX |
303.54 |
+2.81 |
+0.93% |
+8.01% |
| Integrated Oil |
$XOI |
1,687.68 |
-5.74 |
-0.34% |
+12.28% |
| Semiconductor |
$SOX |
630.87 |
+2.37 |
+0.38% |
+17.91% |
| Networking |
$NWX |
331.52 |
+0.82 |
+0.25% |
+2.34% |
| Broker/Dealer |
$XBD |
159.34 |
+1.23 |
+0.78% |
-0.76% |
| Retail |
$RLX |
890.01 |
+3.12 |
+0.35% |
-5.30% |
| Gold & Silver |
$XAU |
98.16 |
+0.85 |
+0.87% |
+16.65% |
| Bank |
$BKX |
71.35 |
+0.20 |
+0.28% |
+3.02% |
| Biotech |
$BTK |
2,752.86 |
+0.19 |
+0.01% |
+18.13% |
|
|
|
 |
Strength Continued Despite Fundamental Flaws
Kenneth J. Gruneisen - Passed the CAN SLIM® Master's Exam
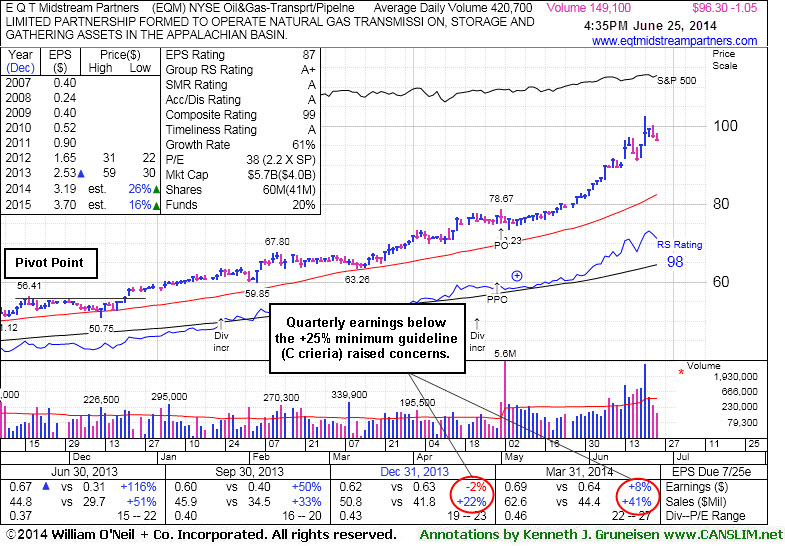
E Q T Midstream Partners (EQM -$1.05 or -1.08% to $96.30) is perched -6.1% off its 52-week high following today's loss with much lighter than average volume. Prior reports repeatedly cautioned members - "It is very extended from any sound base. Fundamental concerns remain after 2 consecutive sub par quarters below the +25% minimum earnings guideline."
It completed a new Public Offering of 10.75 Million common units on 5/01/14. Its last appearance in this FSU section was on 6/04/14 under the headline, "New Highs Again With Light Volume Behind Streak of Gains". It traded up as much as +92.8% since first highlighted in yellow in the 12/12/13 mid-day report (read here) with pivot point based on its 11/18/13 high plus 10 cents. The fact-based system suggests watching for technical sell signals rather than selling purely on fundmentals, yet is wise to sometimes lock in gains at the +20% level. For those watching it and still giving it the benefit of the doubt, it is well above its 50-day moving average (DMA) line ($82.43) where a violation may trigger a technical sell signal.
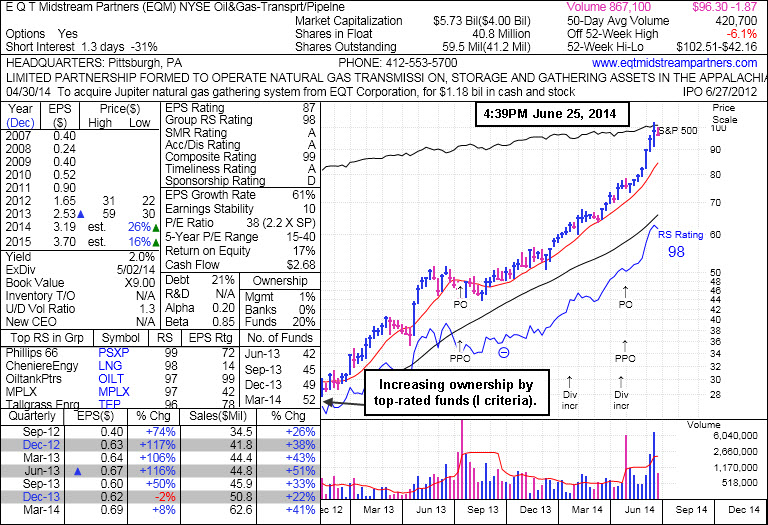
It completed a new Public Offering on 7/16/13, then made gradual progress afterward. This MLP in the Natural Gas business has seen the number of top-rated funds owning its shares rise from 20 in Jun '12 to 52 in Mar '14, a reassuring sign concerning the I criteria. Its Up/Down Volume Ratio of 1.3 is an unbiased indication its shares have been under accumulation over the past 50 days.
|
|
|
Color Codes Explained :
Y - Better candidates highlighted by our
staff of experts.
G - Previously featured
in past reports as yellow but may no longer be buyable under the
guidelines.
***Last / Change / Volume data in this table is the closing quote data***
Symbol/Exchange
Company Name
Industry Group |
PRICE |
CHANGE
(%Change) |
Day High |
Volume
(% DAV)
(% 50 day avg vol) |
52 Wk Hi
% From Hi |
Featured
Date |
Price
Featured |
Pivot Featured |
|
Max Buy |
ACT
-
NYSE
Actavis plc
Medical-Generic Drugs
|
$222.83
|
-1.38
-0.62% |
$225.59
|
2,093,453
99.07% of 50 DAV
50 DAV is 2,113,000
|
$230.77
-3.44%
|
6/20/2014
|
$216.53
|
PP = $230.87
|
|
MB = $242.41
|
Most Recent Note - 6/24/2014 7:20:46 PM
Y - Tallied a 3rd consecutive gain today, approaching its pivot point based on its 2/26/14 high plus 10 cents. Subsequent volume-driven gains to new highs may trigger a technical buy signal. See the latest FSU analysis for more details and new annotated graphs.
>>> FEATURED STOCK ARTICLE : Volume Above Average as Generic Drug Firm Approaches Highs - 6/24/2014
View all notes |
Set NEW NOTE alert |
CANSLIM.net Company Profile |
SEC
News |
Chart |
Request a new note
C
A N
S L
I M


|
AFSI
-
NASDAQ
Amtrust Financial Svcs
INSURANCE - Property and; Casualty Insurance
|
$42.18
|
-0.56
-1.31% |
$42.80
|
408,293
61.03% of 50 DAV
50 DAV is 669,000
|
$47.10
-10.45%
|
5/21/2014
|
$44.85
|
PP = $44.85
|
|
MB = $47.09
|
Most Recent Note - 6/20/2014 5:49:04 PM
G - Still consolidating in a tight trading range above its 50 DMA line which acted as support. Disciplined investors always limit losses by selling any stock that falls more than -7% from their purchase price.
>>> FEATURED STOCK ARTICLE : Halted Slide at 50-Day Moving Average After Distributional Pressure - 6/6/2014
View all notes |
Set NEW NOTE alert |
CANSLIM.net Company Profile |
SEC
News |
Chart |
Request a new note
C
A N
S L
I M
|
AL
-
NYSE
Air Lease Corp Cl A
DIVERSIFIED SERVICES - Rental and Leasing Services
|
$38.88
|
+0.66
1.73% |
$39.07
|
884,579
84.17% of 50 DAV
50 DAV is 1,051,000
|
$42.89
-9.35%
|
5/9/2014
|
$38.27
|
PP = $38.25
|
|
MB = $40.16
|
 Most Recent Note - 6/25/2014 4:24:48 PM
G - Still consolidating near its 50 DMA line where it has found recent support. Any violation of its recent low ($36.55 on 6/13/017) would raise serious concerns and trigger a worrisome technical sell signal.
>>> FEATURED STOCK ARTICLE : Enduring Mild Distributional Pressure on Pullback - 6/11/2014
View all notes |
Set NEW NOTE alert |
CANSLIM.net Company Profile |
SEC
News |
Chart |
Request a new note
C
A N
S L
I M
|
BWLD
-
NASDAQ
Buffalo Wild Wings Inc
LEISURE - Restaurants
|
$163.87
|
+1.67
1.03% |
$164.05
|
425,317
96.66% of 50 DAV
50 DAV is 440,000
|
$166.35
-1.49%
|
6/19/2014
|
$158.52
|
PP = $159.91
|
|
MB = $167.91
|
Most Recent Note - 6/23/2014 12:15:56 PM
Y - Hitting a new 52-week high with today's volume-driven gain above its pivot point. No resistance remains due to overhead supply, and a strong finish may clinch a convincing technical buy signal. Disciplined investors avoid chasing stocks more than +5% above prior highs and always limit losses by selling any stock that falls more than -7% from their purchase price.
>>> FEATURED STOCK ARTICLE : Perched Near Highs With Strong Fundamentals - 6/19/2014
View all notes |
Set NEW NOTE alert |
CANSLIM.net Company Profile |
SEC
News |
Chart |
Request a new note
C
A N
S L
I M
|
EQM
-
NYSE
E Q T Midstream Partners
ENERGY - Oil and Gas Pipelines
|
$96.30
|
-1.05
-1.08% |
$98.13
|
155,637
37.06% of 50 DAV
50 DAV is 420,000
|
$102.51
-6.06%
|
12/12/2013
|
$53.17
|
PP = $56.51
|
|
MB = $59.34
|
Most Recent Note - 6/25/2014 5:18:55 PM
G - Strength has continued despite fundamental flaws repeatedly noted. It is very extended from any sound base. See the latest FSU analysis for more details and new annotated graphs.
>>> FEATURED STOCK ARTICLE : Strength Continued Despite Fundamental Flaws - 6/25/2014
View all notes |
Set NEW NOTE alert |
CANSLIM.net Company Profile |
SEC
News |
Chart |
Request a new note
C
A N
S L
I M
|
Symbol/Exchange
Company Name
Industry Group |
PRICE |
CHANGE
(%Change) |
Day High |
Volume
(% DAV)
(% 50 day avg vol) |
52 Wk Hi
% From Hi |
Featured
Date |
Price
Featured |
Pivot Featured |
|
Max Buy |
GRFS
-
NASDAQ
Grifols Sa Ads
Medical-Ethical Drugs
|
$43.65
|
-1.02
-2.28% |
$44.31
|
450,381
62.99% of 50 DAV
50 DAV is 715,000
|
$46.66
-6.45%
|
5/15/2014
|
$41.14
|
PP = $43.55
|
|
MB = $45.73
|
Most Recent Note - 6/23/2014 12:25:10 PM
Y - Color code is changed to yellow again as it found prompt support and rebounded quickly after undercutting prior highs near $43 and briefly violating its 50 DMA line with above average volume behind today's considerable early loss. Disciplined investors always limit losses by selling any stock that falls more than -7% from their purchase price. Keep in mind that any stock which is sold can be bought again later if strength returns.
>>> FEATURED STOCK ARTICLE : Consolidating Just Below "Max Buy" Level - 6/17/2014
View all notes |
Set NEW NOTE alert |
CANSLIM.net Company Profile |
SEC
News |
Chart |
Request a new note
C
A N
S L
I M
|
HF
-
NYSE
H F F Inc Cl A
RETAIL - Grocery Stores
|
$36.46
|
+0.77
2.16% |
$36.47
|
219,086
122.39% of 50 DAV
50 DAV is 179,000
|
$36.26
0.55%
|
6/20/2014
|
$34.60
|
PP = $36.16
|
|
MB = $37.97
|
Most Recent Note - 6/23/2014 5:55:50 PM
Y - Rallying near its 52-week high with volume-driven gains. A gain above its pivot point with at least +40% above average volume is needed to trigger a proper technical buy signal. See the latest FSU analysis for more details and new annotated graphs.
>>> FEATURED STOCK ARTICLE : Approached 52-Week High With Volume-Driven Gain - 6/23/2014
View all notes |
Set NEW NOTE alert |
CANSLIM.net Company Profile |
SEC
News |
Chart |
Request a new note
C
A N
S L
I M
|
ICON
-
NASDAQ
Iconix Brand Group Inc
CONSUMER NON-DURABLES - Textile - Apparel Footwear
|
$42.71
|
+0.50
1.18% |
$42.71
|
461,424
85.93% of 50 DAV
50 DAV is 537,000
|
$44.81
-4.69%
|
6/5/2014
|
$43.54
|
PP = $43.44
|
|
MB = $45.61
|
Most Recent Note - 6/23/2014 5:52:52 PM
Y - Finished near the session low today with a loss on above average volume. Slumping near prior highs in the $43-42 area defining initial support to watch.
>>> FEATURED STOCK ARTICLE : Found Support Above Prior Highs During Consolidation - 6/18/2014
View all notes |
Set NEW NOTE alert |
CANSLIM.net Company Profile |
SEC
News |
Chart |
Request a new note
C
A N
S L
I M
|
KS
-
NYSE
Kapstone Paper&Packaging
MANUFACTURING - Paper and Packaging
|
$33.29
|
+0.83
2.56% |
$33.30
|
746,553
77.60% of 50 DAV
50 DAV is 962,000
|
$34.43
-3.31%
|
6/20/2014
|
$32.30
|
PP = $31.92
|
|
MB = $33.52
|
Most Recent Note - 6/23/2014 12:28:54 PM
Y - Reversed into the red after briefly rallying beyond its "max buy" level in today's early session. Prior highs near $32 define initial support to watch on pullbacks. It was highlighted in yellow while rallying from a cup-with-handle base in the 6/20/14 mid-day report (read here).
>>> FEATURED STOCK ARTICLE : Four Times Average Volume Behind Big Breakout Gain - 6/20/2014
View all notes |
Set NEW NOTE alert |
CANSLIM.net Company Profile |
SEC
News |
Chart |
Request a new note
C
A N
S L
I M
|
PANW
-
NYSE
Palo Alto Networks
Computer Sftwr-Security
|
$79.75
|
+0.98
1.24% |
$80.00
|
2,320,524
130.07% of 50 DAV
50 DAV is 1,784,000
|
$82.27
-3.06%
|
5/29/2014
|
$75.95
|
PP = $72.50
|
|
MB = $76.13
|
Most Recent Note - 6/25/2014 12:29:10 PM
G - Still holding its ground stubbornly near its 52-week and all-time high. Prior highs near $72 define important support above its 50 DMA line.
>>> FEATURED STOCK ARTICLE : Encountered Distributional Pressure After Touching New 52-Week High - 6/12/2014
View all notes |
Set NEW NOTE alert |
CANSLIM.net Company Profile |
SEC
News |
Chart |
Request a new note
C
A N
S L
I M
|
Symbol/Exchange
Company Name
Industry Group |
PRICE |
CHANGE
(%Change) |
Day High |
Volume
(% DAV)
(% 50 day avg vol) |
52 Wk Hi
% From Hi |
Featured
Date |
Price
Featured |
Pivot Featured |
|
Max Buy |
SN
-
NYSE
Sanchez Energy Corp
ENERGY - Independent Oil and Gas
|
$37.57
|
+1.46
4.04% |
$37.80
|
1,525,346
99.37% of 50 DAV
50 DAV is 1,535,000
|
$38.95
-3.54%
|
5/22/2014
|
$33.00
|
PP = $31.59
|
|
MB = $33.17
|
Most Recent Note - 6/25/2014 3:57:57 PM
G - Rebounding toward its 52-week high with today's big gain. It is very extended from its prior base. Disciplined investors avoid chasing extended stocks. Prior highs near $31-32 define support to watch on pullbacks.
>>> FEATURED STOCK ARTICLE : Finished Near Session Low After Hitting new 52-Week High - 6/9/2014
View all notes |
Set NEW NOTE alert |
CANSLIM.net Company Profile |
SEC
News |
Chart |
Request a new note
C
A N
S L
I M
|
TRN
-
NYSE
Trinity Industries Inc
TRANSPORTATION - Railroads
|
$43.25
|
+1.56
3.74% |
$43.41
|
3,496,522
107.45% of 50 DAV
50 DAV is 3,254,000
|
$43.94
-1.58%
|
4/30/2014
|
$37.79
|
PP = $38.03
|
|
MB = $39.93
|
Most Recent Note - 6/25/2014 3:59:12 PM
G - Gapped up today approaching its 52-week high. It is extended from its prior base. Recent lows in the $39-40 area and its 50 DMA line coincide defining important near-term support to watch. Do not be confused by the 2:1 share split effective 6/20/14 (Featured Price, Pivot Point, and Max Buy level have been adjusted accordingly).
>>> FEATURED STOCK ARTICLE : Recent Lows and 50-Day Moving Average Line Define Near-Term Support - 6/16/2014
View all notes |
Set NEW NOTE alert |
CANSLIM.net Company Profile |
SEC
News |
Chart |
Request a new note
C
A N
S L
I M
|
WLK
-
NYSE
Westlake Chemical Corp
CHEMICALS - Specialty Chemicals
|
$83.05
|
-0.48
-0.57% |
$84.29
|
600,265
83.37% of 50 DAV
50 DAV is 720,000
|
$85.01
-2.31%
|
4/29/2014
|
$72.79
|
PP = $69.31
|
|
MB = $72.78
|
Most Recent Note - 6/20/2014 5:51:52 PM
G - Inched to another new 52-week high with today's 4th consecutive gain. Prior highs near $77 define important near-term support to watch on pullbacks.
>>> FEATURED STOCK ARTICLE : Chemical Firm Quietly Posted 7th Consecutive Weekly Gain - 6/13/2014
View all notes |
Set NEW NOTE alert |
CANSLIM.net Company Profile |
SEC
News |
Chart |
Request a new note
C
A N
S L
I M
|
|
|
|
THESE ARE NOT BUY RECOMMENDATIONS!
Comments contained in the body of this report are technical
opinions only. The material herein has been obtained
from sources believed to be reliable and accurate, however,
its accuracy and completeness cannot be guaranteed.
This site is not an investment advisor, hence it does
not endorse or recommend any securities or other investments.
Any recommendation contained in this report may not
be suitable for all investors and it is not to be deemed
an offer or solicitation on our part with respect to
the purchase or sale of any securities. All trademarks,
service marks and trade names appearing in this report
are the property of their respective owners, and are
likewise used for identification purposes only.
This report is a service available
only to active Paid Premium Members.
You may opt-out of receiving report notifications
at any time. Questions or comments may be submitted
by writing to Premium Membership Services 665 S.E. 10 Street, Suite 201 Deerfield Beach, FL 33441-5634 or by calling 1-800-965-8307
or 954-785-1121.
|
|
|

