You are not logged in.
This means you
CAN ONLY VIEW reports that were published prior to Monday, April 14, 2025.
You
MUST UPGRADE YOUR MEMBERSHIP if you want to see any current reports.
AFTER MARKET UPDATE - WEDNESDAY, JUNE 23RD, 2010
Previous After Market Report Next After Market Report >>>
|
|
|
|
DOW |
+4.92 |
10,298.44 |
+0.05% |
|
Volume |
1,130,468,460 |
+1% |
|
Volume |
1,827,373,440 |
-1% |
|
NASDAQ |
-7.57 |
2,254.23 |
-0.33% |
|
Advancers |
1,426 |
45% |
|
Advancers |
1,190 |
43% |
|
S&P 500 |
-3.27 |
1,092.04 |
-0.30% |
|
Decliners |
1,623 |
51% |
|
Decliners |
1,420 |
52% |
|
Russell 2000 |
-1.66 |
644.25 |
-0.26% |
|
52 Wk Highs |
25 |
|
|
52 Wk Highs |
8 |
|
|
S&P 600 |
-0.87 |
343.84 |
-0.25% |
|
52 Wk Lows |
32 |
|
|
52 Wk Lows |
69 |
|
|
 |
Leadership Evaporates After New Rally Stalls
Adam Sarhan, Contributing Writer,
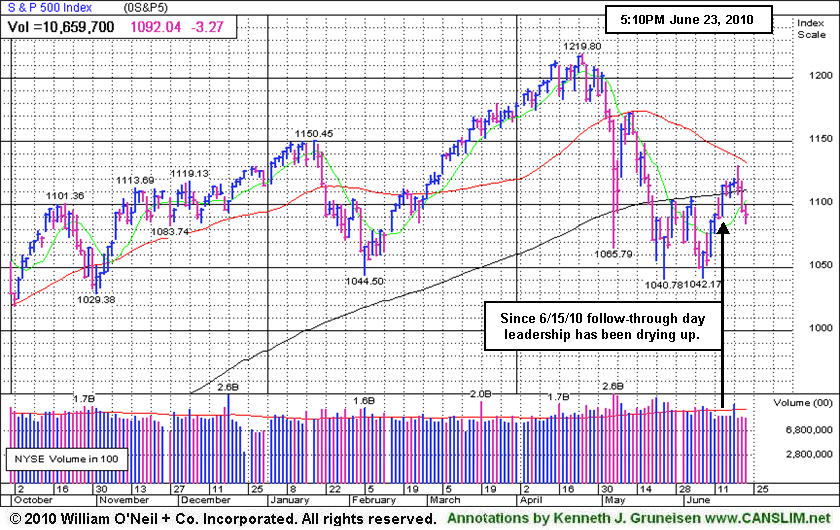
It was another volatile day on Wall Street as investors digested dismal housing data and the Fed left rates unchanged as the economy continues to recover from the worst financial crisis since the Great Depression. Volume totals were reported slightly higher on the NYSE and slightly lower on the Nasdaq exchange compared to Tuesday's levels. Decliners narrowly led advancers on the NYSE and on the Nasdaq exchange. There was only 1 high-ranked company from the CANSLIM.net Leaders List that made a new 52-week high and appeared on the CANSLIM.net BreakOuts Page, sharply lower than the 12 issues that appeared on the prior session. Leadership has evaporated, and without a healthy crop of leaders hitting new highs it is hard for the major averages to sustain a rally. New 52-week lows outnumbered new 52-week highs on the NYSE and on the Nasdaq exchange.
The major averages spent the first half of the session in the red after new-home sales plunged to a record low. The Commerce Department said purchases of new homes plunged nearly -33% to an annual pace of 300,000 last month as the government's tax credit expired. The report also showed that the median home price slid to just over $200,000 and prior months readings were downwardly revised. The overtly weak reading left many to question the health of the already fragile economic recovery. In addition, anyone watching housing stocks in recent weeks should now expect dismal news (possibly a double dip on the ailing housing market) to continue in the near future. Around 2:15PM EST, the Federal Open Market Committee held rates unchanged at a record-low range of 0-to-0.25%. Fed officials reiterated their pledge to hold rates at a record low for an "extended period" and signaled that European contagion woes may adversely affect US economic growth.
Technically, the fact that both the Dow Jones Industrial Average and the S&P 500 Index closed below their respective 200-day moving average (DMA) lines suggests the market may retest its recent lows. Looking forward, the 50 DMA line may act as stubborn resistance and this month's lows should act as support. Since the June 15, 2010 follow-through day (FTD), this column has steadily noted the importance of remaining very selective and disciplined because all of the major averages are still trading below their downward sloping 50-day moving average (DMA) lines. This week's sell-off simply confirms that view. Trade accordingly.
Are You Ready For A Change?
Inquire Today About Our Professional Money Management Services:
If your portfolio is greater than $100,000 and you need assistance, click here to get connected with one of our portfolio managers. ** Serious inquires only, please.
PICTURED: The S&P 500 Index fell for a third straight session. Since the 6/15/10 FTD leadership has been drying up.
|
|
|
 |
Weakness In Broker/Dealer Index Hurting Market Outlook
Kenneth J. Gruneisen - Passed the CAN SLIM® Master's Exam
The Broker/Dealer Index ($XBD -0.69%) and Bank Index ($BKX -0.69%) edged lower, the Healthcare Index ($HMO -0.35%) edged lower, and weakness in energy-related stocks led to similar sized losses for the Integrated Oil Index ($XOI -0.66%) and Oil Services Index ($OSX -0.64%). There were small gains for the Biotechnology Index ($BTK +0.36%) and Semiconductor Index ($SOX +0.41%) while the Networking Index ($NWX +0.12%) and Internet Index ($IIX +0.01%) essentially held their ground. The Retail Index ($RLX +0.22%) and Gold & Silver Index ($XAU +0.26%) also posted small gains on Wednesday's rather quiet trading session.
Charts courtesy www.stockcharts.com
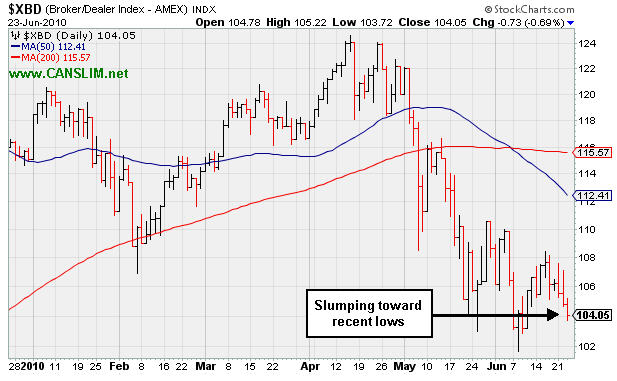
PICTURED: The Broker/Dealer Index ($XBD -0.69%) is slumping toward its 2010 lows, not showing leadership. The weakness is bad news, since the financial group is an important leading indicator for the overall market.
| Oil Services |
$OSX |
174.42 |
-1.13 |
-0.64% |
-10.52% |
| Healthcare |
$HMO |
1,511.48 |
-5.33 |
-0.35% |
+2.62% |
| Integrated Oil |
$XOI |
946.57 |
-6.30 |
-0.66% |
-11.39% |
| Semiconductor |
$SOX |
362.88 |
+1.49 |
+0.41% |
+0.83% |
| Networking |
$NWX |
232.82 |
+0.29 |
+0.12% |
+0.76% |
| Internet |
$IIX |
238.43 |
+0.03 |
+0.01% |
+1.95% |
| Broker/Dealer |
$XBD |
104.05 |
-0.73 |
-0.69% |
-9.56% |
| Retail |
$RLX |
416.74 |
+0.92 |
+0.22% |
+1.37% |
| Gold & Silver |
$XAU |
180.21 |
+0.46 |
+0.26% |
+7.11% |
| Bank |
$BKX |
48.89 |
-0.34 |
-0.69% |
+14.47% |
| Biotech |
$BTK |
1,072.85 |
+3.81 |
+0.36% |
+13.87% |
|
|
|
 |
Medical Products Firm Showing Resilience
Kenneth J. Gruneisen - Passed the CAN SLIM® Master's Exam
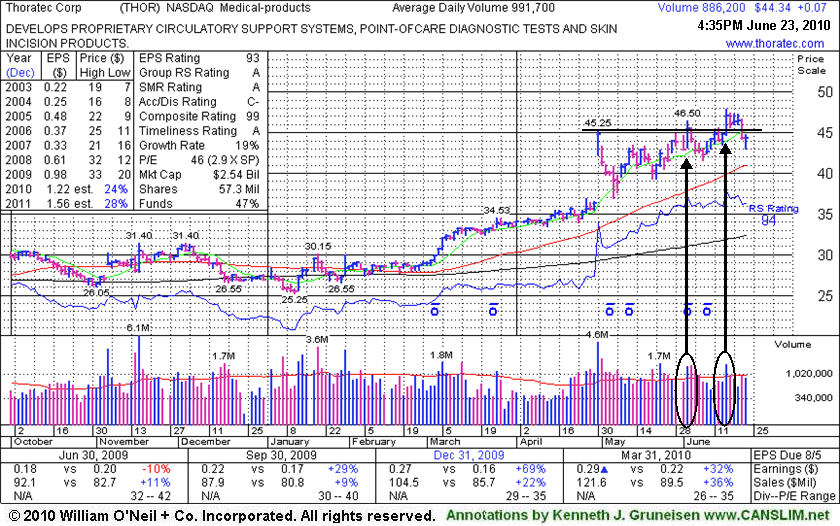
Thoratec Corp (THOR +$0.07 or +0.16% to $44.34) overcame early weakness today, closing -7.5% off its all-time high, but its latest slump under its pivot point has raised some concerns. It struggled initially after breaking out from a choppy 5-week base with a considerable gain on 6/02/10 backed by above average volume. Then it posted a solid gain on 6/16/10 for a new high on above average volume, reconfirming the earlier technical buy signal. In addition to its technical strength, recent quarterly comparisons showed impressive acceleration in its sales revenues increases while earnings above the +25% minimum guideline satisfied the C criteria. If the market's (M criteria) latest confirmed rally produces some strong performing leaders, this high-ranked Medical - Products firm could be among the winners. No overhead supply exists to act as resistance.
Based on weakness it was dropped from the Featured Stocks list on 2/23/09, yet it has shown especially bullish action since its breakout on 3/05/10. It was mentioned long ago in a 12/15/08 interview on WBBM 780AM - (listen here) and it was featured in yellow in the 12/05/08 Mid-Day Breakouts Report (read here). THOR had rebounded impressively after being featured in the past, then subsequently dropped from the CANSLIM.net Featured Stocks list on 2/2/2006.
|
|
|
Color Codes Explained :
Y - Better candidates highlighted by our
staff of experts.
G - Previously featured
in past reports as yellow but may no longer be buyable under the
guidelines.
***Last / Change / Volume data in this table is the closing quote data***
Symbol/Exchange
Company Name
Industry Group |
PRICE |
CHANGE
(%Change) |
Day High |
Volume
(% DAV)
(% 50 day avg vol) |
52 Wk Hi
% From Hi |
Featured
Date |
Price
Featured |
Pivot Featured |
|
Max Buy |
AAPL
-
NASDAQ
Apple Inc
COMPUTER HARDWARE - Personal Computers
|
$270.97
|
-2.88
-1.05% |
$274.66
|
27,403,934
99.33% of 50 DAV
50 DAV is 27,589,600
|
$279.01
-2.88%
|
6/17/2010
|
$270.95
|
PP = $272.56
|
|
MB = $286.19
|
Most Recent Note - 6/22/2010 6:17:21 PM
Y - Gapped up today for a small gain on lighter volume. Hit a new all-time high on 6/21/10 and then negatively reversed, breaking a streak of 7 consecutive gains. In the 6/17/10 mid-day report (read here) it was featured again in yellow with a new pivot point cited based upon its all-time high plus ten cents while "working on the right side of a choppy 9-week consolidation marked by heavy distribution."
>>> The latest Featured Stock Update with an annotated graph appeared on 6/17/2010. Click here.
View all notes |
Alert me of new notes |
CANSLIM.net Company Profile |
SEC |
Zacks Reports |
StockTalk |
News |
Chart |
Request a new note
C
A N
S L
I M


|
APEI
-
NASDAQ
American Public Educ Inc
DIVERSIFIED SERVICES - Education and Training Services
|
$45.39
|
-1.05
-2.26% |
$46.42
|
133,792
77.11% of 50 DAV
50 DAV is 173,500
|
$48.95
-7.27%
|
6/7/2010
|
$46.60
|
PP = $46.29
|
|
MB = $48.60
|
 Most Recent Note - 6/23/2010 4:02:33 PM
Y - Second consecutive loss today on lighter than average volume, pulling back below its pivot point after gains to new highs on better volume.
>>> The latest Featured Stock Update with an annotated graph appeared on 6/14/2010. Click here.
View all notes |
Alert me of new notes |
CANSLIM.net Company Profile |
SEC |
Zacks Reports |
StockTalk |
News |
Chart |
Request a new note
C
A N
S L
I M
|
BIDU
-
NASDAQ
Baidu Inc Ads
INTERNET - Internet Information Providers
|
$76.19
|
+0.51
0.67% |
$76.62
|
9,860,410
64.95% of 50 DAV
50 DAV is 15,182,700
|
$82.29
-7.41%
|
1/13/2010
|
$43.13
|
PP = $42.68
|
|
MB = $44.81
|
Most Recent Note - 6/22/2010 6:25:02 PM
G - Holding its ground perched about -8% below its 52-week high while building a sloppy late-stage base.
>>> The latest Featured Stock Update with an annotated graph appeared on 6/21/2010. Click here.
View all notes |
Alert me of new notes |
CANSLIM.net Company Profile |
SEC |
Zacks Reports |
StockTalk |
News |
Chart |
Request a new note
C
A N
S L
I M
|
BRLI
-
NASDAQ
Bio Reference Labs Inc
HEALTH SERVICES - Medical Laboratories and Researc
|
$23.01
|
+0.21
0.92% |
$23.15
|
353,994
189.40% of 50 DAV
50 DAV is 186,900
|
$24.67
-6.74%
|
6/15/2010
|
$23.57
|
PP = $24.77
|
|
MB = $26.01
|
Most Recent Note - 6/23/2010 12:20:20 PM
Y - Consolidating in a tight range for the past 4 weeks near its 50 DMA line, still perched within close striking distance (-7%) of its all-time high.
>>> The latest Featured Stock Update with an annotated graph appeared on 6/15/2010. Click here.
View all notes |
Alert me of new notes |
CANSLIM.net Company Profile |
SEC |
Zacks Reports |
StockTalk |
News |
Chart |
Request a new note
C
A N
S L
I M
|
CISG
-
NASDAQ
Cninsure Inc Ads
INSURANCE - Insurance Brokers
|
$27.57
|
+0.07
0.25% |
$27.81
|
259,009
84.31% of 50 DAV
50 DAV is 307,200
|
$28.62
-3.67%
|
6/16/2010
|
$27.20
|
PP = $27.75
|
|
MB = $29.14
|
Most Recent Note - 6/23/2010 4:23:25 PM
Y - Hovering near its pivot point since featured in the 6/16/10 mid-day report (read here). It is perched only -4% off its all-time high.
>>> The latest Featured Stock Update with an annotated graph appeared on 6/18/2010. Click here.
View all notes |
Alert me of new notes |
CANSLIM.net Company Profile |
SEC |
Zacks Reports |
StockTalk |
News |
Chart |
Request a new note
C
A N
S L
I M
|
Symbol/Exchange
Company Name
Industry Group |
PRICE |
CHANGE
(%Change) |
Day High |
Volume
(% DAV)
(% 50 day avg vol) |
52 Wk Hi
% From Hi |
Featured
Date |
Price
Featured |
Pivot Featured |
|
Max Buy |
CRM
-
NYSE
Salesforce.Com Inc
INTERNET - Internet Software and Services
|
$92.94
|
+1.04
1.13% |
$93.80
|
2,834,539
105.37% of 50 DAV
50 DAV is 2,690,000
|
$97.94
-5.11%
|
6/2/2010
|
$88.44
|
PP = $89.60
|
|
MB = $94.08
|
Most Recent Note - 6/22/2010 6:43:02 PM
G - Today marked its 3rd consecutive loss and volume was above average while it fell toward its old pivot point. Prior highs in the $89 area are an important support level to watch above its 50 DMA line.
>>> The latest Featured Stock Update with an annotated graph appeared on 6/22/2010. Click here.
View all notes |
Alert me of new notes |
CANSLIM.net Company Profile |
SEC |
Zacks Reports |
StockTalk |
News |
Chart |
Request a new note
C
A N
S L
I M
|
DECK
-
NASDAQ
Deckers Outdoor Corp
CONSUMER NON-DURABLES - Textile - Apparel Footwear
|
$157.76
|
+0.79
0.50% |
$160.29
|
596,368
111.97% of 50 DAV
50 DAV is 532,600
|
$168.52
-6.38%
|
6/11/2010
|
$157.34
|
PP = $158.57
|
|
MB = $166.50
|
Most Recent Note - 6/22/2010 6:45:50 PM
Y - Pulling back today, it closed below its pivot point. After reaching a new all-time high it negatively reversed on the prior session. Prior chart highs may now serve as initial support on pullbacks.
>>> The latest Featured Stock Update with an annotated graph appeared on 6/11/2010. Click here.
View all notes |
Alert me of new notes |
CANSLIM.net Company Profile |
SEC |
Zacks Reports |
StockTalk |
News |
Chart |
Request a new note
C
A N
S L
I M
|
FFIV
-
NASDAQ
F 5 Networks Inc
INTERNET - Internet Software and Services
|
$74.36
|
+1.19
1.63% |
$75.20
|
1,380,843
82.13% of 50 DAV
50 DAV is 1,681,200
|
$77.10
-3.55%
|
6/16/2010
|
$74.50
|
PP = $74.10
|
|
MB = $77.81
|
Most Recent Note - 6/23/2010 4:06:31 PM
Y - Positive reversal for a small gain on light volume after gapping down today, finishing at its second best close ever. Gain on 6/16/10 with +55% above average volume helped it trigger a technical buy signal with its breakout from a flat base of about 5-weeks.
>>> The latest Featured Stock Update with an annotated graph appeared on 6/16/2010. Click here.
View all notes |
Alert me of new notes |
CANSLIM.net Company Profile |
SEC |
Zacks Reports |
StockTalk |
News |
Chart |
Request a new note
C
A N
S L
I M
|
MELI
-
NASDAQ
Mercadolibre Inc
INTERNET - Internet Software and; Services
|
$57.59
|
+0.07
0.12% |
$58.41
|
1,218,014
153.69% of 50 DAV
50 DAV is 792,500
|
$62.14
-7.32%
|
5/13/2010
|
$54.21
|
PP = $55.85
|
|
MB = $58.64
|
Most Recent Note - 6/23/2010 4:11:07 PM
G - Overcame early weakness today, positively reversing and closing near the session high after testing prior chart highs in the $55 area that define support.
>>> The latest Featured Stock Update with an annotated graph appeared on 6/10/2010. Click here.
View all notes |
Alert me of new notes |
CANSLIM.net Company Profile |
SEC |
Zacks Reports |
StockTalk |
News |
Chart |
Request a new note
C
A N
S L
I M
|
NEM
-
NYSE
Newmont Mining Corp
METALS and MINING - Gold
|
$59.08
|
-0.44
-0.74% |
$59.43
|
8,800,363
94.44% of 50 DAV
50 DAV is 9,318,400
|
$61.78
-4.37%
|
6/22/2010
|
$59.60
|
PP = $59.67
|
|
MB = $62.65
|
Most Recent Note - 6/22/2010 6:55:34 PM
Y - A timely new Stock Bulletin with annotated graph was released on this high-ranked leader late this afternoon (read here).
>>> The latest Featured Stock Update with an annotated graph appeared on 6/22/2010. Click here.
View all notes |
Alert me of new notes |
CANSLIM.net Company Profile |
SEC |
Zacks Reports |
StockTalk |
News |
Chart |
Request a new note
C
A N
S L
I M
|
Symbol/Exchange
Company Name
Industry Group |
PRICE |
CHANGE
(%Change) |
Day High |
Volume
(% DAV)
(% 50 day avg vol) |
52 Wk Hi
% From Hi |
Featured
Date |
Price
Featured |
Pivot Featured |
|
Max Buy |
ROVI
-
NASDAQ
Rovi Corp
COMPUTER SOFTWARE andamp; SERVICES - Security Software andamp; Services
|
$36.99
|
+0.73
2.01% |
$37.50
|
1,152,501
85.11% of 50 DAV
50 DAV is 1,354,100
|
$40.06
-7.66%
|
6/3/2010
|
$38.70
|
PP = $40.16
|
|
MB = $42.17
|
Most Recent Note - 6/23/2010 4:14:05 PM
G - Gain today came with higher but still below average volume, rallying toward its 50 DMA line, yet finishing below that important short-term average. Recently found support near prior lows in the $35 area, and stayed above its October 2009 chart high.
>>> The latest Featured Stock Update with an annotated graph appeared on 6/9/2010. Click here.
View all notes |
Alert me of new notes |
CANSLIM.net Company Profile |
SEC |
Zacks Reports |
StockTalk |
News |
Chart |
Request a new note
C
A N
S L
I M
|
SUMR
-
NASDAQ
Summer Infant Inc
CONSUMER NON-DURABLES - Personal Products
|
$6.81
|
-0.18
-2.58% |
$7.10
|
55,911
69.11% of 50 DAV
50 DAV is 80,900
|
$8.42
-19.12%
|
5/4/2010
|
$6.85
|
PP = $7.09
|
|
MB = $7.44
|
Most Recent Note - 6/23/2010 4:16:15 PM
G - Slumping under its 50 DMA line with today's 3rd consecutive loss on light volume. Recent chart lows in the $6.25 area define important support to watch.
>>> The latest Featured Stock Update with an annotated graph appeared on 6/8/2010. Click here.
View all notes |
Alert me of new notes |
CANSLIM.net Company Profile |
SEC |
Zacks Reports |
StockTalk |
News |
Chart |
Request a new note
C
A N
S L
I M
|
THOR
-
NASDAQ
Thoratec Corp
HEALTH SERVICES - Medical Instruments and Supplies
|
$44.34
|
+0.07
0.16% |
$44.76
|
904,652
92.30% of 50 DAV
50 DAV is 980,100
|
$47.93
-7.49%
|
6/3/2010
|
$44.38
|
PP = $45.35
|
|
MB = $47.62
|
Most Recent Note - 6/23/2010 4:19:41 PM
Y- Overcame early weakness today, while its slump under its pivot point raised concerns.
>>> The latest Featured Stock Update with an annotated graph appeared on 6/23/2010. Click here.
View all notes |
Alert me of new notes |
CANSLIM.net Company Profile |
SEC |
Zacks Reports |
StockTalk |
News |
Chart |
Request a new note
C
A N
S L
I M
|
ULTA
-
NASDAQ
Ulta Salon Cosm & Frag
SPECIALTY RETAIL - Specialty Retail, Other
|
$24.97
|
-0.09
-0.34% |
$25.21
|
506,029
80.69% of 50 DAV
50 DAV is 627,100
|
$26.75
-6.67%
|
5/28/2010
|
$25.58
|
PP = $25.86
|
|
MB = $27.15
|
Most Recent Note - 6/22/2010 7:05:41 PM
Y - Pulled back further today after a negative reversal from an all-time high on the prior session. No overhead supply remains to act as resistance, however, on 6/11/10 it completed a Secondary Offering which may hinder upward price progress for the near-term.
>>> The latest Featured Stock Update with an annotated graph appeared on 6/7/2010. Click here.
View all notes |
Alert me of new notes |
CANSLIM.net Company Profile |
SEC |
Zacks Reports |
StockTalk |
News |
Chart |
Request a new note
C
A N
S L
I M
|
|
|
|
THESE ARE NOT BUY RECOMMENDATIONS!
Comments contained in the body of this report are technical
opinions only. The material herein has been obtained
from sources believed to be reliable and accurate, however,
its accuracy and completeness cannot be guaranteed.
This site is not an investment advisor, hence it does
not endorse or recommend any securities or other investments.
Any recommendation contained in this report may not
be suitable for all investors and it is not to be deemed
an offer or solicitation on our part with respect to
the purchase or sale of any securities. All trademarks,
service marks and trade names appearing in this report
are the property of their respective owners, and are
likewise used for identification purposes only.
This report is a service available
only to active Paid Premium Members.
You may opt-out of receiving report notifications
at any time. Questions or comments may be submitted
by writing to Premium Membership Services 665 S.E. 10 Street, Suite 201 Deerfield Beach, FL 33441-5634 or by calling 1-800-965-8307
or 954-785-1121.
|
|
|


