You are not logged in.
This means you
CAN ONLY VIEW reports that were published prior to Monday, February 26, 2024.
You
MUST UPGRADE YOUR MEMBERSHIP if you want to see any current reports.
AFTER MARKET UPDATE - MONDAY, JUNE 22ND, 2020
Previous After Market Report Next After Market Report >>>
|
|
|
|
DOW |
+153.50 |
26,024.96 |
+0.59% |
|
Volume |
1,073,813,640 |
-69% |
|
Volume |
4,438,770,000 |
-26% |
|
NASDAQ |
+109.23 |
10,055.35 |
+1.10% |
|
Advancers |
1,523 |
52% |
|
Advancers |
1,858 |
56% |
|
S&P 500 |
+20.12 |
3,117.86 |
+0.65% |
|
Decliners |
1,378 |
47% |
|
Decliners |
1,475 |
44% |
|
Russell 2000 |
+14.86 |
1,433.50 |
+1.05% |
|
52 Wk Highs |
64 |
|
|
52 Wk Highs |
150 |
|
|
S&P 600 |
+6.32 |
825.08 |
+0.77% |
|
52 Wk Lows |
6 |
|
|
52 Wk Lows |
15 |
|
|
 |
Nasdaq Hits New Record High as Tech Sector Underpins Rally
Kenneth J. Gruneisen - Passed the CAN SLIM® Master's Exam
The Dow gained 153 points, while the S&P 500 rose 0.7%. The Nasdaq Composite rallied 1.1%, notching its longest winning streak this year, rising for the seventh straight session. Advancers led decliners by an 8-7 margin on the NYSE and 9-7 on the Nasdaq exchange. The reported volume totals were lighter than the prior session on the NYSE and on the Nasdaq exchange, as Friday's totals were inflated by options expirations. There were 49 high-ranked companies from the Leaders List that hit new 52-week highs and were listed on the BreakOuts Page, versus the total of 59 on the prior session. New 52-week highs totals contracted yet still easily outnumbered new 52-week lows totals on both exchanges. New lows were in the single digits on the NYSE for the 16th day in a row. The major indices remain in a confirmed uptrend (M criteria). Any sustainable rally requires a healthy crop of new leaders, so it was encouraging to recently see the new highs totals improve. Charts used courtesy of www.stockcharts.com
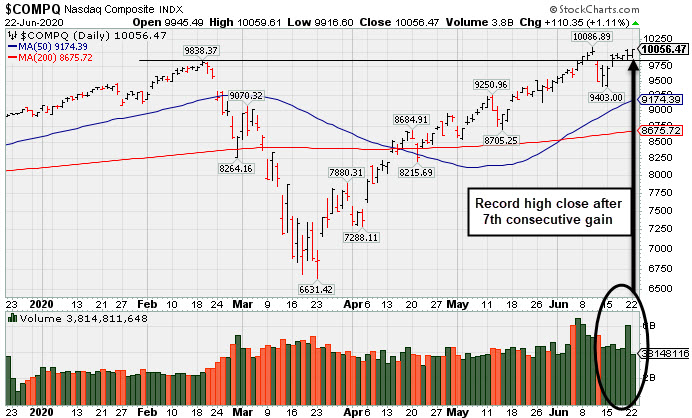
PICTURED: The Nasdaq Composite Index finished at a new record high close after posting a 7th consecutive gain.
Stocks ended higher on Monday, as investors looked past concerns of rising COVID-19 infections, and instead focused on recent signs of stabilization in the economy. Market participants remain hopeful that policymakers will not slow business activity, despite the U.S. reporting the highest daily increase in coronavirus cases since May 1.
Seven of 11 S&P 500 sectors finished in positive territory. The Technology group paced the gains, with Apple (AAPL +2.62%) and Microsoft (MSFT +2.78%) both rising to fresh all-time highs. The iPhone maker caught a bid as investors had positive takeaways from the company’s virtual Worldwide Developers Conference. In other corporate news, American Airlines (AAL -6.75%) fell after the company said it plans secure $3.5 billion in new financing in order to improve liquidity during the coronavirus pandemic. Elsewhere, Tyson Foods (TSN -2.85%) fell after China announced it would suspend poultry imports following a coronavirus outbreak at a meat processing plant.
On the data front, the Chicago Fed National activity Index unexpectedly rebounded into positive territory in May. A separate update showed existing home sales declined 9.7% month-over-month in May to the lowest level since October 2010. Treasuries modestly weakened, with the yield on the 10-year note up one basis point to 0.70%. In commodities, WTI crude rose 1.8% to $40.46/barrel. COMEX gold gained 0.6% to $1,756.30/ounce, near a seven-year high. |
 Kenneth J. Gruneisen started out as a licensed stockbroker in August 1987, a couple of months prior to the historic stock market crash that took the Dow Jones Industrial Average down -22.6% in a single day. He has published daily fact-based fundamental and technical analysis on high-ranked stocks online for two decades. Through FACTBASEDINVESTING.COM, Kenneth provides educational articles, news, market commentary, and other information regarding proven investment systems that work in good times and bad.
Comments contained in the body of this report are technical opinions only and are not necessarily those of Gruneisen Growth Corp. The material herein has been obtained from sources believed to be reliable and accurate, however, its accuracy and completeness cannot be guaranteed. Our firm, employees, and customers may effect transactions, including transactions contrary to any recommendation herein, or have positions in the securities mentioned herein or options with respect thereto. Any recommendation contained in this report may not be suitable for all investors and it is not to be deemed an offer or solicitation on our part with respect to the purchase or sale of any securities. |
|
 |
Gold & Silver, Retail, and Tech Groups Led Gainers
Kenneth J. Gruneisen - Passed the CAN SLIM® Master's Exam
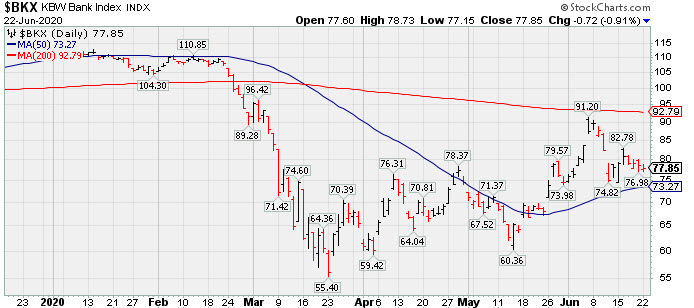
The Retail Index ($RLX +1.24%) finished with a solid gain while financials were mixed on Monday, as the Broker/Dealer Index ($XBD +0.25%) edged higher, but the Bank Index ($BKX -0.91%) slumped. The tech sector had a positive bias as the Biotech Index ($BTK +0.31%), Networking Index ($NWX +0.76%) and the Semiconductor Index ($SOX +0.84%) each ended higher. The Gold & Silver Index ($XAU +4.23%) was a standout gainer. Energy-linked groups had a slightly positive bias as the Oil Services Index ($OSX +0.53%) and the Integrated Oil Index ($XOI +0.35%) both edged higher.
PICTURED: The Bank Index ($BKX -0.91%) is consolidating above near-term support defined by its 50-day moving average (DMA) line.
| Oil Services |
$OSX |
34.79 |
+0.18 |
+0.52% |
-55.56% |
| Integrated Oil |
$XOI |
816.18 |
+2.90 |
+0.36% |
-35.76% |
| Semiconductor |
$SOX |
1,983.78 |
+16.99 |
+0.86% |
+7.25% |
| Networking |
$NWX |
556.61 |
+4.18 |
+0.76% |
-4.59% |
| Broker/Dealer |
$XBD |
273.51 |
+0.68 |
+0.25% |
-5.81% |
| Retail |
$RLX |
2,978.74 |
+36.62 |
+1.24% |
+21.62% |
| Gold & Silver |
$XAU |
121.70 |
+4.95 |
+4.24% |
+13.82% |
| Bank |
$BKX |
77.85 |
-0.72 |
-0.92% |
-31.32% |
| Biotech |
$BTK |
5,846.69 |
+17.89 |
+0.31% |
+15.38% |
|
|
|
 |
Gain for Recent New High Backed by +71% Above Average Volume
Kenneth J. Gruneisen - Passed the CAN SLIM® Master's Exam
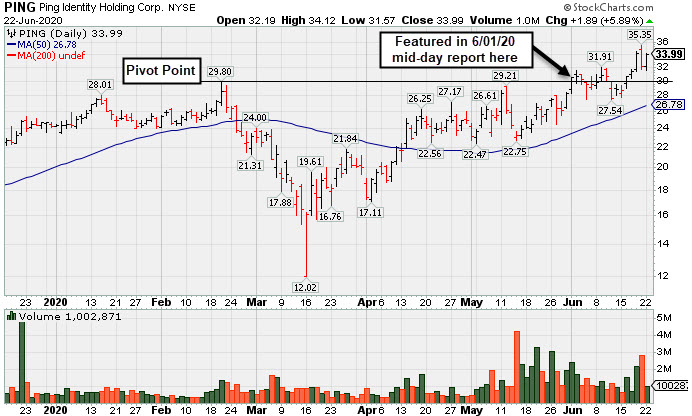
Ping Identity Hldg Corp (PING +$1.89 or +5.89% to $33.99) rebounded for its second best ever close with lighter volume behind a big gain today following a "negative reversal" after hitting a new all-time high on the prior session. The big gain on 6/18/20 with +71% above average volume triggered a technical buy signal. Prior highs in the $29 area define initial support to watch on pullbacks.
PING was highlighted in yellow with new pivot point cited based on its 2/20/20 high plus 10 cents in the 6/01/20 mid-day report (read here). The gain above the pivot point was backed by +127% above average volume triggering a technical buy signal as it hit a new 52-week high (N criteria). It was shown in this FSU section that evening with an annotated graph under the headline, "Strong Gain for New High Backed by 127% Above Average Volume".
Its $15 IPO was completed on 9/19/19 and after a choppy ascent it completed a Secondary Offering on 5/15/20. The number of top-rated funds owning its shares rose from 83 in Sep '19 to156 in Mar '20, a reassuring sign concerning the I criteria. Its current Up/Down Volume Ratio of 1.4 is an unbiased indication its shares have been under accumulation over the past 50 days.
The Computer Software-Security firm reported strong earnings results well above the +25% minimum guideline (C criteria) in the 4 latest quarterly comparisons through Mar '20 versus the year ago periods. Limited earnings history is a concern, however, leadership in the Computer Software - Security industry group (L criteria) is a reassuring sign. The groups is currently ranked 12th of the 197 industry groups.
|
|
|
Color Codes Explained :
Y - Better candidates highlighted by our
staff of experts.
G - Previously featured
in past reports as yellow but may no longer be buyable under the
guidelines.
***Last / Change / Volume data in this table is the closing quote data***
Symbol/Exchange
Company Name
Industry Group |
PRICE |
CHANGE
(%Change) |
Day High |
Volume
(% DAV)
(% 50 day avg vol) |
52 Wk Hi
% From Hi |
Featured
Date |
Price
Featured |
Pivot Featured |
|
Max Buy |
 FTNT
-
NASDAQ
FTNT
-
NASDAQ
Fortinet Inc
Computer Sftwr-Security
|
$142.87
|
+6.16
4.51% |
$144.24
|
2,235,860
126.46% of 50 DAV
50 DAV is 1,768,000
|
$149.69
-4.56%
|
6/22/2020
|
$142.68
|
PP = $149.79
|
|
MB = $157.28
|
 Most Recent Note - 6/22/2020 12:39:01 PM
Y - Color code is changed to yellow with new pivot point cited based on its 5/20/20 high plus 10 cents after a 5-week flat base with volume totals cooling during the orderly consolidation. Subsequent volume-driven gains above the pivot point may trigger a new (or add-on) technical buy signal. The prior low ($126.88 on 6/15/20) and its 50 DMA line ($127.37) define important near-term support to watch on pullbacks.
>>> FEATURED STOCK ARTICLE : Managed a "Positive Reversal" After Brief Dip Below "Max Buy" Level - 6/15/2020 |
View all notes |
Set NEW NOTE alert |
Company Profile |
SEC
News |
Chart |
Request a new note
C
A
S
I |
EBS
-
NYSE
Emergent Biosolutions
DRUGS - Biotechnology
|
$73.11
|
+1.23
1.71% |
$73.15
|
492,741
79.35% of 50 DAV
50 DAV is 621,000
|
$93.58
-21.87%
|
6/1/2020
|
$72.10
|
PP = $90.10
|
|
MB = $94.61
|
Most Recent Note - 6/19/2020 5:46:56 PM
G - Posted a gain with above average volume. Subsequent gains and a convincing rebound above the 50 DMA line ($76.33) are still needed to help its outlook improve. Any damaging losses below the recent low ($66.69) may trigger a more worrisome technical sell signal. Fundamentals remain strong.
>>> FEATURED STOCK ARTICLE : Still Below 50-Day Moving Average Following Damaging Gap Down - 6/16/2020 |
View all notes |
Set NEW NOTE alert |
Company Profile |
SEC
News |
Chart |
Request a new note
C
A
S
I |
NBIX
-
NASDAQ
Neurocrine Biosciences
DRUGS - Biotechnology
|
$127.41
|
-1.42
-1.10% |
$129.73
|
809,353
95.56% of 50 DAV
50 DAV is 847,000
|
$128.95
-1.19%
|
5/19/2020
|
$123.71
|
PP = $119.75
|
|
MB = $125.74
|
Most Recent Note - 6/19/2020 5:45:20 PM
G - Powered to a new 52-week high with a considerable volume-driven gain clinching a technical buy signal while quickly rallying above the "max buy" level. Recent quarterly comparisons through Mar '20 showed greatly improved sales revenues and earnings increases versus year ago periods (C criteria). After years of losses it reported solid annual earnings (A criteria) in FY '18 and '19.
>>> FEATURED STOCK ARTICLE : Pullback Into Prior Base Negated Recent Breakout - 6/8/2020 |
View all notes |
Set NEW NOTE alert |
Company Profile |
SEC
News |
Chart |
Request a new note
C
A
S
I |
BMRN
-
NASDAQ
Biomarin Pharmaceutical
DRUGS - Drug Manufacturers - Other
|
$122.34
|
-1.78
-1.43% |
$123.77
|
2,213,172
133.73% of 50 DAV
50 DAV is 1,655,000
|
$124.95
-2.09%
|
6/17/2020
|
$110.95
|
PP = $112.67
|
|
MB = $118.30
|
Most Recent Note - 6/19/2020 5:40:01 PM
G - Posted a 6th consecutive gain today with +184% above average volume as it clinched a convincing technical buy signal and quickly powered above its "max buy" level. Color code is changed to green. Reported strong results for the Mar '20 quarter and recent comparisons showed improved earnings increases. Annual earnings (A criteria) history has been strong. Prior high ($112.57) defines initial support to watch on pullbacks.
>>> FEATURED STOCK ARTICLE : Hit New 52-Week High But Closed Below Pivot After 3-Weeks Tight - 6/17/2020 |
View all notes |
Set NEW NOTE alert |
Company Profile |
SEC
News |
Chart |
Request a new note
C
A
S
I |
AMD
-
NASDAQ
Advanced Micro Devices
ELECTRONICS - Semiconductor - Broad Line
|
$54.76
|
+0.53
0.98% |
$55.17
|
44,483,592
68.91% of 50 DAV
50 DAV is 64,553,000
|
$59.27
-7.61%
|
6/9/2020
|
$55.41
|
PP = $56.98
|
|
MB = $59.83
|
Most Recent Note - 6/22/2020 3:30:06 PM
Y - Volume totals have been cooling while consolidating above its 50 DMA line ($54.12). The prior low ($49.09 on 5/27/20) defines the next important support to watch. Subsequent gains above the pivot point backed by at least +40% above average volume are still needed to trigger a convincing technical buy signal. Previously met stubborn resistance in the $57-59 area. Gains into new high territory may mark the beginning of a substantial leg higher. The 3 latest quarterly comparisons through Mar '20 showed very strong earnings increases with greatly improved sales revenues growth in the Dec '19 and Mar '20 comparisons versus the year ago period.
>>> FEATURED STOCK ARTICLE : Big Chip Firm Showing Strong Sales Revenues and Earnings Increases - 6/9/2020 |
View all notes |
Set NEW NOTE alert |
Company Profile |
SEC
News |
Chart |
Request a new note
C
A
S
I |
Symbol/Exchange
Company Name
Industry Group |
PRICE |
CHANGE
(%Change) |
Day High |
Volume
(% DAV)
(% 50 day avg vol) |
52 Wk Hi
% From Hi |
Featured
Date |
Price
Featured |
Pivot Featured |
|
Max Buy |
TREX
-
NYSE
Trex Company Inc
MATERIALS and CONSTRUCTION - General Building Materials
|
$123.39
|
+4.24
3.56% |
$123.48
|
655,210
67.55% of 50 DAV
50 DAV is 970,000
|
$132.84
-7.11%
|
5/5/2020
|
$109.05
|
PP = $111.95
|
|
MB = $117.55
|
Most Recent Note - 6/19/2020 5:48:21 PM
G - Color code is changed to green while consolidating above its "max buy" level. Prior highs in the $111 area define important support to watch above its 50 DMA line ($107.89). Fundamentals remain strong.
>>> FEATURED STOCK ARTICLE : Pullback Toward Prior Highs Which Define Near-Term Support - 6/11/2020 |
View all notes |
Set NEW NOTE alert |
Company Profile |
SEC
News |
Chart |
Request a new note
C
A
S
I |
NFLX
-
NASDAQ
Netflix Inc
SPECIALTY RETAIL - Music and Video Stores
|
$468.04
|
+14.32
3.16% |
$468.59
|
6,249,699
77.70% of 50 DAV
50 DAV is 8,043,000
|
$458.97
1.98%
|
5/14/2020
|
$441.95
|
PP = $449.62
|
|
MB = $472.10
|
Most Recent Note - 6/22/2020 3:45:33 PM
Y - Hitting a new all-time high with today's 6th consecutive gain backed by below average volume. Found support near its 50 DMA line ($429.74) recently. Gains above a stock's pivot point must have at least +40% above average volume to trigger a proper new (or add-on) technical buy signal. Any damaging losses below the 50 DMA line and prior lows would trigger a more worrisome technical sell signal.
>>> FEATURED STOCK ARTICLE : Weak Action Led to 50-Day Moving Average Violation - 6/12/2020 |
View all notes |
Set NEW NOTE alert |
Company Profile |
SEC
News |
Chart |
Request a new note
C
A
S
I |
CHGG
-
NYSE
Chegg Inc
Consumer Svcs-Education
|
$69.83
|
+2.02
2.98% |
$70.57
|
5,292,077
132.57% of 50 DAV
50 DAV is 3,992,000
|
$69.05
1.13%
|
6/17/2020
|
$63.71
|
PP = $68.08
|
|
MB = $71.48
|
Most Recent Note - 6/19/2020 5:41:17 PM
Y - Hit a new 52-week high today with +97% above average volume behind a considerable gain. Highlighted in yellow in the 6/17/20 mid-day report with a new pivot point cited based on its 5/15/20 high plus 10 cents after a flat 5-week base noted - "Subsequent gains above the pivot point backed by at least +40% above average volume may trigger a technical buy signal. Bullish action came after it reported earnings +47% on +35% sales revenues for the Mar '20 quarter. Went through a choppy consolidation since dropped from the Featured Stocks list on 9/03/19. Fundamentals have remained strong. See the latest FSU analysis for more details and a new annotated graph."
>>> FEATURED STOCK ARTICLE : Formed a Flat Base Perched Within Striking Distance of 52-Week High - 6/18/2020 |
View all notes |
Set NEW NOTE alert |
Company Profile |
SEC
News |
Chart |
Request a new note
C
A
S
I |
NOW
-
NYSE
Servicenow Inc
Computer Sftwr-Enterprse
|
$402.82
|
+2.95
0.74% |
$403.22
|
1,549,704
72.96% of 50 DAV
50 DAV is 2,124,000
|
$407.99
-1.27%
|
4/30/2020
|
$343.05
|
PP = $363.05
|
|
MB = $381.20
|
Most Recent Note - 6/22/2020 3:40:15 PM
G - Volume totals have generally been cooling while hovering in a tight trading range perched near its all-time high. Recent gains above the pivot point were not backed by the +40% above average volume necessary to clinch a proper technical buy signal. Prior highs in the $362 area define initial support to watch above its 50 DMA line ($359.61).
>>> FEATURED STOCK ARTICLE : Quiet Pullback Below "Max Buy" Level for NOW - 6/4/2020 |
View all notes |
Set NEW NOTE alert |
Company Profile |
SEC
News |
Chart |
Request a new note
C
A
S
I |
TEAM
-
NASDAQ
Atlassian Corp Plc Cl A
Comp Sftwr-Spec Enterprs
|
$184.56
|
+11.92
6.90% |
$184.92
|
2,807,495
146.00% of 50 DAV
50 DAV is 1,923,000
|
$191.72
-3.73%
|
5/4/2020
|
$159.70
|
PP = $156.22
|
|
MB = $164.03
|
Most Recent Note - 6/22/2020 3:23:23 PM
G - Posting a solid gain today, however it is extended from any sound base. Found support above its 50 DMA line ($168.89). The next important near-term support is the prior low ($163.72 on 6/05/20).
>>> FEATURED STOCK ARTICLE : Positive Reversal Near Prior High and 50 DMA Line - 6/5/2020 |
View all notes |
Set NEW NOTE alert |
Company Profile |
SEC
News |
Chart |
Request a new note
C
A
S
I |
Symbol/Exchange
Company Name
Industry Group |
PRICE |
CHANGE
(%Change) |
Day High |
Volume
(% DAV)
(% 50 day avg vol) |
52 Wk Hi
% From Hi |
Featured
Date |
Price
Featured |
Pivot Featured |
|
Max Buy |
TTD
-
NASDAQ
The Trade Desk Inc Cl A
Comml Svcs-Advertising
|
$402.80
|
+8.02
2.03% |
$407.48
|
1,461,265
67.84% of 50 DAV
50 DAV is 2,154,000
|
$406.55
-0.92%
|
6/3/2020
|
$240.61
|
PP = $327.35
|
|
MB = $343.72
|
Most Recent Note - 6/22/2020 5:17:37 PM
G - Hit another new high today with below average volume behind its 7th consecutive gain, getting very extended from any sound base. Prior highs in the $327 area define important near-term support.
>>> FEATURED STOCK ARTICLE : Trade Desk Posts Powerful Gain for New High - 6/3/2020 |
View all notes |
Set NEW NOTE alert |
Company Profile |
SEC
News |
Chart |
Request a new note
C
A
S
I |
DOCU
-
NASDAQ
Docusign Inc
Computer Sftwr-Enterprse
|
$168.30
|
+6.88
4.26% |
$169.85
|
5,612,195
129.22% of 50 DAV
50 DAV is 4,343,000
|
$167.87
0.26%
|
6/10/2020
|
$149.73
|
PP = $152.10
|
|
MB = $159.71
|
Most Recent Note - 6/22/2020 3:43:13 PM
G - Hit yet another new all-time high with today's gain backed by lighter volume, getting more extended from the recently noted new base. Prior high ($152 on 6/02/20) defines initial support to watch well above its 50 DMA line.
>>> FEATURED STOCK ARTICLE : Advanced Ascending Base Formed for Strong E-Signature Firm - 6/10/2020 |
View all notes |
Set NEW NOTE alert |
Company Profile |
SEC
News |
Chart |
Request a new note
C
A
S
I |
PING
-
NYSE
Ping Identity Hldg Corp
Computer Sftwr-Security
|
$33.99
|
+1.89
5.89% |
$34.12
|
1,002,841
76.26% of 50 DAV
50 DAV is 1,315,000
|
$35.36
-3.87%
|
6/1/2020
|
$29.24
|
PP = $29.90
|
|
MB = $31.40
|
Most Recent Note - 6/22/2020 5:16:41 PM
G - Posted a big gain with lighter volume today for its second best ever close. The big gain on 6/18/20 with +71% above average volume triggered a technical buy signal. Prior highs in the $29 area define initial support to watch on pullbacks. See the latest FSU analysis for more details and a new annotated graph.
>>> FEATURED STOCK ARTICLE : Gain for Recent New High Backed by +71% Above Average Volume - 6/22/2020 |
View all notes |
Set NEW NOTE alert |
Company Profile |
SEC
News |
Chart |
Request a new note
C
A
S
I |
AAXN
-
NASDAQ
Axon Enterprise Inc
Security/Sfty
|
$92.50
|
+2.38
2.64% |
$93.70
|
849,721
74.34% of 50 DAV
50 DAV is 1,143,000
|
$104.90
-11.82%
|
5/8/2020
|
$84.86
|
PP = $90.20
|
|
MB = $94.71
|
Most Recent Note - 6/19/2020 5:33:04 PM
Y - Suffered a loss today with higher (above average) volume. Completed a new Pubic Offering on 6/17/20. Prior highs in the $90-91 area have acted as support following a powerful breakout. More damaging losses would raise concerns and trigger a technical sell signal. See the latest FSU analysis for more details and a new annotated graph.
>>> FEATURED STOCK ARTICLE : Completed New Pubic Offering and Found Support Near Prior High - 6/19/2020 |
View all notes |
Set NEW NOTE alert |
Company Profile |
SEC
News |
Chart |
Request a new note
C
A
S
I |
GDDY
-
NYSE
Godaddy Inc Cl A
Computer Sftwr-Enterprse
|
$82.41
|
+1.21
1.49% |
$82.66
|
2,058,947
153.54% of 50 DAV
50 DAV is 1,341,000
|
$82.47
-0.07%
|
6/2/2020
|
$79.62
|
PP = $82.40
|
|
MB = $86.52
|
Most Recent Note - 6/19/2020 5:46:08 PM
Y - Posted a 6th consecutive gain today with heavier volume. Perched within close striking distance of its 52-week high. Subsequent gains above the pivot point backed by at least +40% above average volume are needed to trigger a proper technical buy signal. It previously met stubborn resistance in the $82-84 area.
>>> FEATURED STOCK ARTICLE : Godaddy Could Be Ready to Go for New Highs - 6/2/2020 |
View all notes |
Set NEW NOTE alert |
Company Profile |
SEC
News |
Chart |
Request a new note
C
A
S
I |
Symbol/Exchange
Company Name
Industry Group |
PRICE |
CHANGE
(%Change) |
Day High |
Volume
(% DAV)
(% 50 day avg vol) |
52 Wk Hi
% From Hi |
Featured
Date |
Price
Featured |
Pivot Featured |
|
Max Buy |
|
|
|
THESE ARE NOT BUY RECOMMENDATIONS!
Comments contained in the body of this report are technical
opinions only. The material herein has been obtained
from sources believed to be reliable and accurate, however,
its accuracy and completeness cannot be guaranteed.
This site is not an investment advisor, hence it does
not endorse or recommend any securities or other investments.
Any recommendation contained in this report may not
be suitable for all investors and it is not to be deemed
an offer or solicitation on our part with respect to
the purchase or sale of any securities. All trademarks,
service marks and trade names appearing in this report
are the property of their respective owners, and are
likewise used for identification purposes only.
This report is a service available
only to active Paid Premium Members.
You may opt-out of receiving report notifications
at any time. Questions or comments may be submitted
by writing to Premium Membership Services 665 S.E. 10 Street, Suite 201 Deerfield Beach, FL 33441-5634 or by calling 1-800-965-8307
or 954-785-1121.
|
|
|