You are not logged in.
This means you
CAN ONLY VIEW reports that were published prior to Sunday, March 23, 2025.
You
MUST UPGRADE YOUR MEMBERSHIP if you want to see any current reports.
AFTER MARKET UPDATE - TUESDAY, JUNE 21ST, 2011
Previous After Market Report Next After Market Report >>>
|
|
|
|
DOW |
+109.63 |
12,190.01 |
+0.91% |
|
Volume |
851,159,060 |
+8% |
|
Volume |
1,813,385,750 |
+13% |
|
NASDAQ |
+57.60 |
2,687.26 |
+2.19% |
|
Advancers |
2,584 |
82% |
|
Advancers |
2,092 |
77% |
|
S&P 500 |
+17.16 |
1,295.52 |
+1.34% |
|
Decliners |
474 |
15% |
|
Decliners |
548 |
20% |
|
Russell 2000 |
+17.89 |
806.37 |
+2.27% |
|
52 Wk Highs |
68 |
|
|
52 Wk Highs |
60 |
|
|
S&P 600 |
+8.08 |
433.22 |
+1.90% |
|
52 Wk Lows |
25 |
|
|
52 Wk Lows |
39 |
|
|
 |
Encouraging Signs Include Positive Breadth as New Highs List Expands
Kenneth J. Gruneisen - Passed the CAN SLIM® Master's Exam
It was somewhat encouraging that the volume totals were higher than the prior session totals as the major averages rose on Tuesday, however the volume totals reported on the NYSE and on the Nasdaq exchange both remained below average. Advancers led decliners by about a 5-1 ratio on the NYSE and by almost 4-1 on the Nasdaq exchange. New 52-week highs outnumbered new 52-week lows on the Nasdaq exchange for the first time since May 31st, and new highs also outnumbered new lows on the NYSE. There were 40 high-ranked companies from the CANSLIM.net Leaders List that made new 52-week highs and appeared on the CANSLIM.net BreakOuts Page, more than doubling the total of 16 on the prior session. All 14 of the high-ranked leaders currently included on the Featured Stocks Page posted gains.
May existing home sales declined 3.8% to an annual rate of 4.81 million units, the lowest level in six months. As the Federal Reserve began a two-day meeting in Washington, most analysts expected the Fed to maintain its balance sheet at current levels until October or later. Meanwhile, the euro gained as the Greek government prepared for a confidence vote that may determine its financial future.
Best Buy Co Inc (BBY +2.66%) rose after hiking its dividend and authorizing a new $5 billion share repurchase program. Carnival Corp (CCL +4.23%) rallied after posting better-than-expected earnings, meanwhile investors brushed aside the cruise operator's lowered forecast. Tower Bancorp Inc (TOBC +31.57%) jumped on news Susquehanna Bancshares, Inc (SUSQ -7.67%) will buy the bank for $343 million. Peabody Energy Corp (BTU +5.07%) and other coal company stocks gained as China boosted imports. Walgreen Co (WAG -4.21%) slumped after announcing it won't be part of Express Scripts Inc's (ESRX +0.37%) pharmacy network as of next year after unsuccessful contract negotiations.
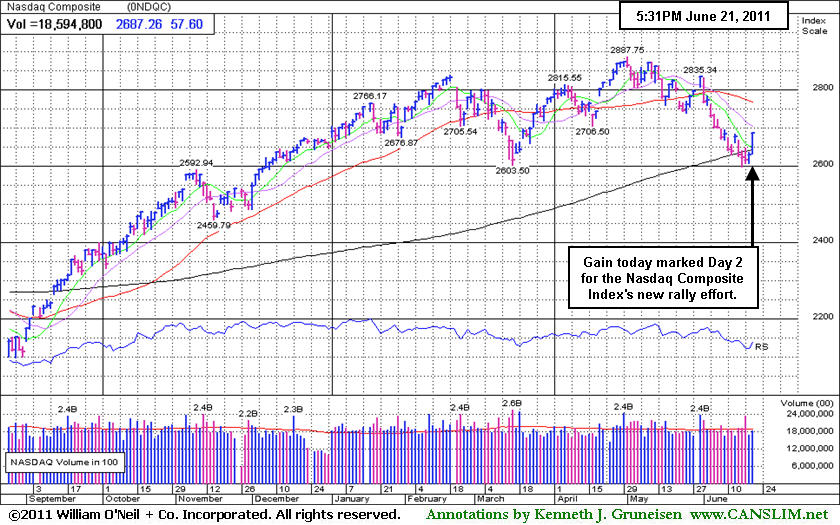
The S&P 500 Index posted a +1.34% gain, which might be considered a questionable gain borderline with the minimum gain expected for a follow-through day. The S&P 400 Mid-Cap Index and S&P 600 Small-Cap Index both posted +1.9% gains on Day 3 and Day 4 of their rally attempts, respectively. The strength in small stocks and expansion in the new 52-week highs list were encouraging signs for growth-oriented investors who might cautiously look to accumulate ideal buy candidates. A follow-through day (FTD) occurring between Day 4 and Day 7 of a new rally is considered the most ideal confirmation of a new rally attempt. As previously explained, to produce a solid FTD there should be a gain of at least +1.4% or more from at least one of the major averages, and the gain must come with higher volume and an expansion in leadership (new 52-week highs). Meanwhile, any deterioration under the Day 1 lows would officially end the nascent rally attempt and signal that the market's correction is continuing.
The June 2011 issue of CANSLIM.net News (read here) is now available to all upgraded members. Only UPGRADED members will also have access to the upcoming Q2 2011 Webcast scheduled for Wednesday, June 29th at 8PM EST.
PICTURED: The Nasdaq Composite Index's +2.19% gain came on only Day 2 of its new rally attempt.
|
 Kenneth J. Gruneisen started out as a licensed stockbroker in August 1987, a couple of months prior to the historic stock market crash that took the Dow Jones Industrial Average down -22.6% in a single day. He has published daily fact-based fundamental and technical analysis on high-ranked stocks online for two decades. Through FACTBASEDINVESTING.COM, Kenneth provides educational articles, news, market commentary, and other information regarding proven investment systems that work in good times and bad.
Comments contained in the body of this report are technical opinions only and are not necessarily those of Gruneisen Growth Corp. The material herein has been obtained from sources believed to be reliable and accurate, however, its accuracy and completeness cannot be guaranteed. Our firm, employees, and customers may effect transactions, including transactions contrary to any recommendation herein, or have positions in the securities mentioned herein or options with respect thereto. Any recommendation contained in this report may not be suitable for all investors and it is not to be deemed an offer or solicitation on our part with respect to the purchase or sale of any securities. |
|
 |
Retail, Tech, Healthcare, and Commodity-Linked Groups Rise
Kenneth J. Gruneisen - Passed the CAN SLIM® Master's Exam
Financial shares were clearly laggards amid Tuesday's broad-based rally as the Broker/Dealer Index ($XBD +0.91%) and Bank Index ($BKX +1.08%) failed to keep pace with stronger gains in technology, energy, and defensive groups. The Retail Index ($RLX +2.31%) had a positive influence on the major averages. Unanimous gains from the Biotechnology Index ($BTK +1.50%), Semiconductor Index ($SOX +2.54%), Internet Index ($IIX +3.03%), and Networking Index ($NWX +3.04%) helped the tech-heavy Nasdaq Composite Index outpace the Dow and S&P 500. Commodity-linked groups were solid gainers as the Gold & Silver Index ($XAU +3.32%) outpaced the Oil Services Index ($OSX +1.83%) and Integrated Oil Index ($XOI +2.23%). The Healthcare Index ($HMO +1.85%) maintained its strength.
Charts courtesy www.stockcharts.com
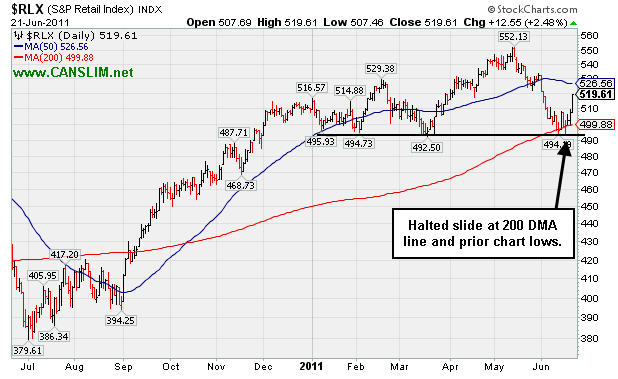
PICTURED: The Retail Index ($RLX +2.31%) halted slide at its 200-day moving average (DMA) line and prior chart lows.
| Oil Services |
$OSX |
254.80 |
+4.58 |
+1.83% |
+3.95% |
| Healthcare |
$HMO |
2,408.14 |
+43.75 |
+1.85% |
+42.33% |
| Integrated Oil |
$XOI |
1,272.83 |
+27.79 |
+2.23% |
+4.92% |
| Semiconductor |
$SOX |
398.61 |
+9.88 |
+2.54% |
-3.21% |
| Networking |
$NWX |
290.03 |
+8.57 |
+3.04% |
+3.38% |
| Internet |
$IIX |
299.68 |
+8.82 |
+3.03% |
-2.62% |
| Broker/Dealer |
$XBD |
107.68 |
+0.97 |
+0.91% |
-11.38% |
| Retail |
$RLX |
519.39 |
+11.74 |
+2.31% |
+2.17% |
| Gold & Silver |
$XAU |
196.74 |
+6.32 |
+3.32% |
-13.17% |
| Bank |
$BKX |
47.73 |
+0.51 |
+1.08% |
-8.58% |
| Biotech |
$BTK |
1,426.01 |
+21.13 |
+1.50% |
+9.89% |
|
|
|
 |
Volume-Driven Gain Clears Resistance For New Highs
Kenneth J. Gruneisen - Passed the CAN SLIM® Master's Exam
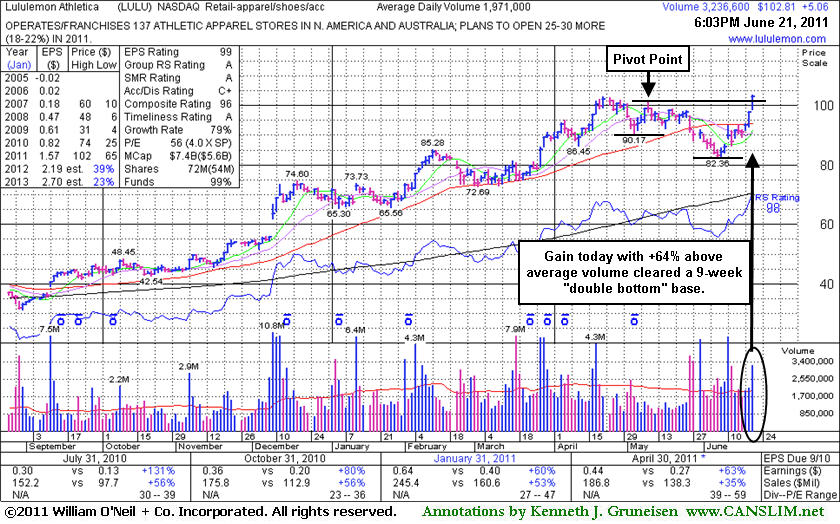
Lululemon Athletica (LULU +$5.06 or +5.18% to $102.81) hit new 52-week and all-time highs today with +68% above average volume behind a 3rd consecutive gain. Technical improvement since dropped from the Featured Stocks list on 6/06/11 has been encouraging. It today's mid-day report its color code was changed to yellow with new pivot point cited based on a "double bottom" base formed over the past 9 weeks. Its last appearance in this FSU section was on 5/27/11 with an annotated graph under the headline, "Damaging Losses Triggered Sell Signal", showing it slumping below its 50-day moving average (DMA) line triggering technical sell signals with 2 consecutive damaging losses on above average volume.
This high-ranked Retail-Apparel firm has confirmed a new technical buy signal with its solid gain above the new pivot point cited. No overhead supply remains to hinder its progress now, and it could go on to produce more climactic gains. As always, limit losses by selling if ever a stock fall more than -7% from your purchase price.
The number of top-rated funds owning its shares rose from 261 in Sep '10 to 306 in Dec '10, but reportedly eased to 304 in Mar '11. Its board of directors recently approved a 2-for-1 stock split (pending). The 7 latest quarterly comparisons showed strong sales revenues and impressive earnings increases (C criteria), and it maintained a good annual earnings history (A criteria) despite a patch of negative comparisons in early '09. LULU was first featured in yellow at $47.66 in the October 8, 2010 mid-day report report (read here) and it traded up as much as +115.7% in less than 7 months.
|
|
|
Color Codes Explained :
Y - Better candidates highlighted by our
staff of experts.
G - Previously featured
in past reports as yellow but may no longer be buyable under the
guidelines.
***Last / Change / Volume data in this table is the closing quote data***
Symbol/Exchange
Company Name
Industry Group |
PRICE |
CHANGE
(%Change) |
Day High |
Volume
(% DAV)
(% 50 day avg vol) |
52 Wk Hi
% From Hi |
Featured
Date |
Price
Featured |
Pivot Featured |
|
Max Buy |
CACC
-
NASDAQ
Credit Acceptance Corp
FINANCIAL SERVICES - Credit Services
|
$80.51
|
+1.16
1.46% |
$80.64
|
34,752
89.34% of 50 DAV
50 DAV is 38,900
|
$82.29
-2.16%
|
6/2/2011
|
$76.10
|
PP = $82.39
|
|
MB = $86.51
|
Most Recent Note - 6/20/2011 1:34:45 PM
Y - High-ranked leader in the Finance - Consumer Loans industry is consolidating above its 50 DMA line. It faces little resistance due to overhead supply while now perched -4.2% off its 52-week high. Its color code was changed back to yellow after its recent resilience. Disciplined investors may watch for gains above its recent highs and wait for a follow-through day to confirm a new rally. Meanwhile, recent lows near $75 define important support to watch.
>>> The latest Featured Stock Update with an annotated graph appeared on 6/6/2011. Click here.
View all notes |
Alert me of new notes |
CANSLIM.net Company Profile |
SEC |
Zacks Reports |
StockTalk |
News |
Chart |
Request a new note
C
A N
S L
I M


|
CMG
-
NYSE
Chipotle Mexican Grill
LEISURE - Restaurants
|
$285.25
|
+9.20
3.33% |
$285.90
|
838,617
80.97% of 50 DAV
50 DAV is 1,035,700
|
$295.99
-3.63%
|
4/1/2011
|
$274.00
|
PP = $275.10
|
|
MB = $288.86
|
 Most Recent Note - 6/21/2011 2:31:46 PM
G - Rising back above its 50 DMA line today and trading within -4.5% of its all-time high, but it has not formed a sound new base pattern. An upward trendline connecting its July 2010 and May 2011 lows defines an initial technical support level to watch.
>>> The latest Featured Stock Update with an annotated graph appeared on 6/15/2011. Click here.
View all notes |
Alert me of new notes |
CANSLIM.net Company Profile |
SEC |
Zacks Reports |
StockTalk |
News |
Chart |
Request a new note
C
A N
S L
I M
|
EZPW
-
NASDAQ
Ezcorp Inc Cl A
SPECIALTY RETAIL - Specialty Retail, Other
|
$31.40
|
+0.75
2.45% |
$31.94
|
515,121
143.77% of 50 DAV
50 DAV is 358,300
|
$33.31
-5.73%
|
6/13/2011
|
$31.18
|
PP = $33.41
|
|
MB = $35.08
|
Most Recent Note - 6/21/2011 2:34:38 PM
Y - Finding support near its 50 DMA line recently, and today's gain has it trading -5.5% from its all-time high. Recent lows also help define important near-term chart support in the $29 area.
>>> The latest Featured Stock Update with an annotated graph appeared on 6/13/2011. Click here.
View all notes |
Alert me of new notes |
CANSLIM.net Company Profile |
SEC |
Zacks Reports |
StockTalk |
News |
Chart |
Request a new note
C
A N
S L
I M
|
FCFS
-
NASDAQ
First Cash Financial Svs
SPECIALTY RETAIL - Specialty Retail, Other
|
$39.47
|
+0.40
1.02% |
$39.64
|
177,347
93.59% of 50 DAV
50 DAV is 189,500
|
$42.36
-6.82%
|
5/31/2011
|
$42.00
|
PP = $40.23
|
|
MB = $42.24
|
Most Recent Note - 6/20/2011 5:02:37 PM
G - Small gain today on lighter than average volume. Its 50 DMA line and prior lows in the $37 area define support to watch. Its color code was changed to green after damaging losses on higher volume negated its latest breakout.
>>> The latest Featured Stock Update with an annotated graph appeared on 5/31/2011. Click here.
View all notes |
Alert me of new notes |
CANSLIM.net Company Profile |
SEC |
Zacks Reports |
StockTalk |
News |
Chart |
Request a new note
C
A N
S L
I M
|
FOSL
-
NASDAQ
Fossil Inc
CONSUMER DURABLES - Recreational Goods, Other
|
$113.80
|
+3.09
2.79% |
$114.45
|
826,574
111.80% of 50 DAV
50 DAV is 739,300
|
$110.98
2.54%
|
2/1/2011
|
$73.30
|
PP = $74.44
|
|
MB = $78.16
|
Most Recent Note - 6/21/2011 12:20:24 PM
G - Hitting another new high today, inching higher after 5 weeks of trading in a very tight range forming a "late-stage" base. Recent lows near $99 define important support to watch just below its 50 DMA line.
>>> The latest Featured Stock Update with an annotated graph appeared on 6/7/2011. Click here.
View all notes |
Alert me of new notes |
CANSLIM.net Company Profile |
SEC |
Zacks Reports |
StockTalk |
News |
Chart |
Request a new note
C
A N
S L
I M
|
Symbol/Exchange
Company Name
Industry Group |
PRICE |
CHANGE
(%Change) |
Day High |
Volume
(% DAV)
(% 50 day avg vol) |
52 Wk Hi
% From Hi |
Featured
Date |
Price
Featured |
Pivot Featured |
|
Max Buy |
HS
-
NYSE
Healthspring Inc
HEALTH SERVICES - Health Care Plans
|
$45.81
|
+1.77
4.02% |
$46.63
|
1,609,088
191.70% of 50 DAV
50 DAV is 839,400
|
$45.11
1.55%
|
6/16/2011
|
$42.44
|
PP = $45.21
|
|
MB = $47.47
|
Most Recent Note - 6/21/2011 12:31:00 PM
Y - Hitting new 52-week and all-time highs today after a small gap up. Its 4th consecutive gain backed by above average volume has helped it rise above its pivot point. A powerful technical breakout could trigger a new (or add-on) technical buy signal.
>>> The latest Featured Stock Update with an annotated graph appeared on 6/16/2011. Click here.
View all notes |
Alert me of new notes |
CANSLIM.net Company Profile |
SEC |
Zacks Reports |
StockTalk |
News |
Chart |
Request a new note
C
A N
S L
I M
|
INFA
-
NASDAQ
Informatica Corp
COMPUTER SOFTWARE and SERVICES - Business Software and Services
|
$56.60
|
+1.15
2.07% |
$57.18
|
1,153,548
91.12% of 50 DAV
50 DAV is 1,266,000
|
$59.98
-5.64%
|
3/24/2011
|
$50.04
|
PP = $49.86
|
|
MB = $52.35
|
Most Recent Note - 6/20/2011 4:38:41 PM
G - Posted a second consecutive gain today with lighter volume, finding support near its 50 DMA line. Hit a new 52-week high on 6/01/11 but then there was a negative reversal noted. This high-ranked Computer Software - Database firm did not form a sound new base pattern.
>>> The latest Featured Stock Update with an annotated graph appeared on 6/17/2011. Click here.
View all notes |
Alert me of new notes |
CANSLIM.net Company Profile |
SEC |
Zacks Reports |
StockTalk |
News |
Chart |
Request a new note
C
A N
S L
I M
|
LULU
-
NASDAQ
Lululemon Athletica
MANUFACTURING - Textile Manufacturing
|
$102.81
|
+5.06
5.18% |
$103.45
|
3,238,145
164.29% of 50 DAV
50 DAV is 1,971,000
|
$102.83
-0.02%
|
6/21/2011
|
$102.95
|
PP = $101.14
|
|
MB = $106.20
|
Most Recent Note - 6/21/2011 6:26:30 PM
Y - Finished strong after noted hitting new 52-week and all-time highs in today's mid-day report. Color code was changed to yellow with new pivot point cited based on a "double bottom" base formed over the past 9 weeks. See the latest FSU analysis for more details and a new annotated graph.
>>> The latest Featured Stock Update with an annotated graph appeared on 6/21/2011. Click here.
View all notes |
Alert me of new notes |
CANSLIM.net Company Profile |
SEC |
Zacks Reports |
StockTalk |
News |
Chart |
Request a new note
C
A N
S L
I M
|
MWIV
-
NASDAQ
M W I Veterinary Supply
HEALTH SERVICES - Medical Instruments and; Supplies
|
$80.91
|
+1.11
1.39% |
$81.12
|
52,422
61.17% of 50 DAV
50 DAV is 85,700
|
$86.99
-6.99%
|
11/4/2010
|
$61.79
|
PP = $59.60
|
|
MB = $62.58
|
Most Recent Note - 6/17/2011 4:04:46 PM
G - It may be forming a new base, however gains have lacked volume conviction following its 50 DMA line violation. Technically, that important short-term average has acted as resistance and a gain above it is needed for its outlook to improve.
>>> The latest Featured Stock Update with an annotated graph appeared on 6/9/2011. Click here.
View all notes |
Alert me of new notes |
CANSLIM.net Company Profile |
SEC |
Zacks Reports |
StockTalk |
News |
Chart |
Request a new note
C
A N
S L
I M
|
OPNT
-
NASDAQ
Opnet Technologies
INTERNET - Internet Software and Services
|
$38.51
|
+1.55
4.19% |
$38.78
|
73,434
59.46% of 50 DAV
50 DAV is 123,500
|
$42.51
-9.41%
|
5/11/2011
|
$41.21
|
PP = $40.50
|
|
MB = $42.53
|
Most Recent Note - 6/21/2011 2:37:11 PM
G - Today's gain without great volume conviction has it rising back above its 50 DMA line which recently has acted as resistance. Subsequent deterioration under its earlier chart low ($35.13 on 4/12/11) would raise more serious concerns.
>>> The latest Featured Stock Update with an annotated graph appeared on 6/10/2011. Click here.
View all notes |
Alert me of new notes |
CANSLIM.net Company Profile |
SEC |
Zacks Reports |
StockTalk |
News |
Chart |
Request a new note
C
A N
S L
I M
|
Symbol/Exchange
Company Name
Industry Group |
PRICE |
CHANGE
(%Change) |
Day High |
Volume
(% DAV)
(% 50 day avg vol) |
52 Wk Hi
% From Hi |
Featured
Date |
Price
Featured |
Pivot Featured |
|
Max Buy |
OTEX
-
NASDAQ
Open Text Corp
INTERNET - Internet Software and Services
|
$61.49
|
+1.77
2.96% |
$61.66
|
361,773
114.89% of 50 DAV
50 DAV is 314,900
|
$67.08
-8.33%
|
6/1/2011
|
$65.86
|
PP = $67.18
|
|
MB = $70.54
|
Most Recent Note - 6/21/2011 2:39:36 PM
G - Technically, today's gain has it rallying back near its 50 DMA line which may now act as resistance. It faces overhead supply up through $66 after trading at higher levels in recent months.
>>> The latest Featured Stock Update with an annotated graph appeared on 6/2/2011. Click here.
View all notes |
Alert me of new notes |
CANSLIM.net Company Profile |
SEC |
Zacks Reports |
StockTalk |
News |
Chart |
Request a new note
C
A N
S L
I M
|
SWI
-
NYSE
Solarwinds Inc
COMPUTER SOFTWARE and SERVICES - Application Software
|
$25.74
|
+0.34
1.34% |
$25.98
|
1,585,226
225.59% of 50 DAV
50 DAV is 702,700
|
$26.68
-3.52%
|
6/7/2011
|
$24.22
|
PP = $25.05
|
|
MB = $26.30
|
Most Recent Note - 6/21/2011 12:49:00 PM
Y - Small gap up gain today, rising further above its pivot point. Following its recent breakout there was a worrisome negative reversal on 6/15/11 with volume 4 times average after hitting a new 52-week high. Prior resistance in the $24-25 area acted as a support level.
>>> The latest Featured Stock Update with an annotated graph appeared on 6/8/2011. Click here.
View all notes |
Alert me of new notes |
CANSLIM.net Company Profile |
SEC |
Zacks Reports |
StockTalk |
News |
Chart |
Request a new note
C
A N
S L
I M
|
ULTA
-
NASDAQ
Ulta Salon Cosm & Frag
SPECIALTY RETAIL - Specialty Retail, Other
|
$62.08
|
+3.34
5.69% |
$62.39
|
1,366,572
191.32% of 50 DAV
50 DAV is 714,300
|
$59.40
4.51%
|
1/6/2011
|
$36.12
|
PP = $37.34
|
|
MB = $39.21
|
Most Recent Note - 6/21/2011 12:59:09 PM
G - Gain today for a new all-time high, getting more extended from any sound base pattern. It may produce more climactic gains, but disciplined investors avoid chasing extended stocks.
>>> The latest Featured Stock Update with an annotated graph appeared on 6/20/2011. Click here.
View all notes |
Alert me of new notes |
CANSLIM.net Company Profile |
SEC |
Zacks Reports |
StockTalk |
News |
Chart |
Request a new note
C
A N
S L
I M
|
ZAGG
-
NASDAQ
Zagg Inc
SPECIALTY RETAIL - Specialty Retail, Other
|
$12.60
|
+0.48
3.98% |
$12.70
|
1,286,691
104.12% of 50 DAV
50 DAV is 1,235,800
|
$13.05
-3.45%
|
6/1/2011
|
$10.92
|
PP = $10.59
|
|
MB = $11.12
|
Most Recent Note - 6/21/2011 2:40:47 PM
G - Holding its ground stubbornly with volume totals cooling. It is extended from the previously noted cup-with-handle type base pattern. Prior highs define initial support to watch on pullbacks.
>>> The latest Featured Stock Update with an annotated graph appeared on 6/1/2011. Click here.
View all notes |
Alert me of new notes |
CANSLIM.net Company Profile |
SEC |
Zacks Reports |
StockTalk |
News |
Chart |
Request a new note
C
A N
S L
I M
|
|
|
|
THESE ARE NOT BUY RECOMMENDATIONS!
Comments contained in the body of this report are technical
opinions only. The material herein has been obtained
from sources believed to be reliable and accurate, however,
its accuracy and completeness cannot be guaranteed.
This site is not an investment advisor, hence it does
not endorse or recommend any securities or other investments.
Any recommendation contained in this report may not
be suitable for all investors and it is not to be deemed
an offer or solicitation on our part with respect to
the purchase or sale of any securities. All trademarks,
service marks and trade names appearing in this report
are the property of their respective owners, and are
likewise used for identification purposes only.
This report is a service available
only to active Paid Premium Members.
You may opt-out of receiving report notifications
at any time. Questions or comments may be submitted
by writing to Premium Membership Services 665 S.E. 10 Street, Suite 201 Deerfield Beach, FL 33441-5634 or by calling 1-800-965-8307
or 954-785-1121.
|
|
|

