You are not logged in.
This means you
CAN ONLY VIEW reports that were published prior to Tuesday, April 15, 2025.
You
MUST UPGRADE YOUR MEMBERSHIP if you want to see any current reports.
AFTER MARKET UPDATE - MONDAY, JUNE 20TH, 2011
Previous After Market Report Next After Market Report >>>
|
|
|
|
DOW |
+76.02 |
12,080.38 |
+0.63% |
|
Volume |
786,443,160 |
-51% |
|
Volume |
1,604,675,190 |
-31% |
|
NASDAQ |
+13.18 |
2,629.66 |
+0.50% |
|
Advancers |
2,033 |
65% |
|
Advancers |
1,492 |
55% |
|
S&P 500 |
+6.86 |
1,278.36 |
+0.54% |
|
Decliners |
969 |
31% |
|
Decliners |
1,126 |
42% |
|
Russell 2000 |
+6.73 |
788.48 |
+0.86% |
|
52 Wk Highs |
32 |
|
|
52 Wk Highs |
29 |
|
|
S&P 600 |
+3.86 |
425.14 |
+0.92% |
|
52 Wk Lows |
53 |
|
|
52 Wk Lows |
104 |
|
|
 |
Indices Post Gains With Light Volume Ahead of FOMC Meeting
Kenneth J. Gruneisen - Passed the CAN SLIM® Master's Exam
The major averages finished with gains on Monday, but anemic volume totals signaled that the institutional crowd was not accumulating shares and the recent weakness may not be over. Advancing issues beat decliners by 2-1 on the NYSE and by 5-4 on the Nasdaq. Options expirations had contributed to Friday's higher volume totals, meanwhile totals reported on the NYSE and on the Nasdaq exchange on Monday were clearly below average. New 52-week lows still outnumbered new 52-week highs on both the NYSE and on the Nasdaq exchange. There were 16 high-ranked companies from the CANSLIM.net Leaders List that made new 52-week highs and appeared on the CANSLIM.net BreakOuts Page, up from 8 on the prior session. There were 12 gainers out of the 13 of the high-ranked leaders currently included on the Featured Stocks Page.
The markets were able to overcome continued Greek debt concerns. European leaders reassured investors that a default could be avoided even after euro-area governments failed to agree on a payment to Greece. US stocks quietly traded higher as the S&P 500 Index bounced off its 200-day moving average, a key technical level. There were no economic reports. The Fed will begin a two-day meeting on interest rates Tuesday. The FOMC's mid-week policy statement has added significance with the expiration of the Fed's second round of quantitative easing (QE2) set to expire soon. World markets are also wondering what the Fed has planned amid the precarious conditions that currently loom over countries in the eurozone periphery.
Microsoft Corp (MSFT +0.87%) said it would announce its next next-generation Office cloud service next week. Wal-Mart Stores Inc (WMT +0.42%) posted a small gain after the U.S. Supreme Court sided with the retailer and rejected class-action status in a potentially huge sex-discrimination lawsuit. Neither of the above mentioned companies has the quarterly and annual earnings growth history to be considered a match with the investment system's model winners. The best candidates our experts have identified are included on the Featured Stocks Page.
Recent weak action was noted as the market (M criteria) correction caused more worrisome technical damage, reminding investors to raise cash and reduce exposure until a new confirmed rally with follow-through day (FTD) occurs. The June 2011 issue of CANSLIM.net News (read here) is now available to all upgraded members. Only UPGRADED members will also have access to the upcoming Q2 2011 Webcast scheduled for Wednesday, June 29th at 8PM EST.
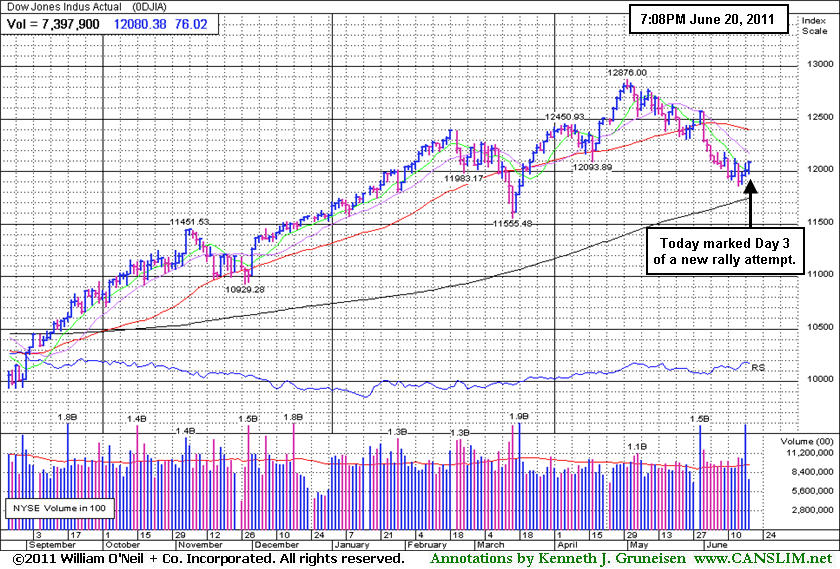
PICTURED: The Dow Jones Industrial Average's modest winning streak reached three days and approximately +1.5%. A follow-through day (FTD) occurring between Day 4 and Day 7 of a new rally is considered the most ideal confirmation of a new rally attempt. To produce a solid FTD there should be a gain of at least +1.4% or more from at least one of the major averages, and the gain must come with higher volume and an expansion in leadership (new 52-week highs). Meanwhile, any deterioration under the Day 1 lows would officially end the nascent rally attempt and signal that the market's correction is continuing.
|
 Kenneth J. Gruneisen started out as a licensed stockbroker in August 1987, a couple of months prior to the historic stock market crash that took the Dow Jones Industrial Average down -22.6% in a single day. He has published daily fact-based fundamental and technical analysis on high-ranked stocks online for two decades. Through FACTBASEDINVESTING.COM, Kenneth provides educational articles, news, market commentary, and other information regarding proven investment systems that work in good times and bad.
Comments contained in the body of this report are technical opinions only and are not necessarily those of Gruneisen Growth Corp. The material herein has been obtained from sources believed to be reliable and accurate, however, its accuracy and completeness cannot be guaranteed. Our firm, employees, and customers may effect transactions, including transactions contrary to any recommendation herein, or have positions in the securities mentioned herein or options with respect thereto. Any recommendation contained in this report may not be suitable for all investors and it is not to be deemed an offer or solicitation on our part with respect to the purchase or sale of any securities. |
|
 |
Healthcare Group Posts Standout Gain
Kenneth J. Gruneisen - Passed the CAN SLIM® Master's Exam
Weakness for the Bank Index ($BKX -0.48%) was an exception while most groups posted modest gains on Monday. The Broker/Dealer Index ($XBD +0.08%) and Gold & Silver Index ($XAU +0.16%) inched higher, and energy-related issues were also very little changed as the Oil Services Index ($OSX -0.10%) and Integrated Oil Index ($XOI +0.06%) hugged the flat line. The Internet Index ($IIX +0.44%), Networking Index ($NWX +0.64%), and Biotechnology Index ($BTK +0.78%) posted modest gains that outpaced the Semiconductor Index ($SOX +0.13%). The Retail Index ($RLX +1.01%) posted an influential gain, and the Healthcare Index ($HMO +2.75%) was a standout gainer.
Charts courtesy www.stockcharts.com
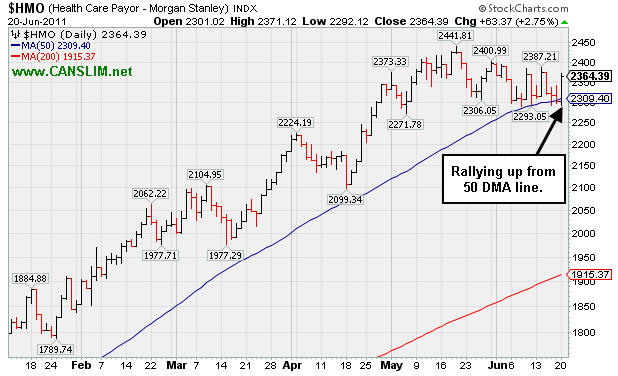
PICTURED: The Healthcare Index ($HMO +2.75%) posted a standout gain, rallying up from its 50-day moving average (DMA) line.
| Oil Services |
$OSX |
250.22 |
-0.26 |
-0.10% |
+2.08% |
| Healthcare |
$HMO |
2,364.39 |
+63.37 |
+2.75% |
+39.74% |
| Integrated Oil |
$XOI |
1,245.05 |
+0.74 |
+0.06% |
+2.63% |
| Semiconductor |
$SOX |
388.73 |
+0.52 |
+0.13% |
-5.61% |
| Networking |
$NWX |
281.47 |
+1.79 |
+0.64% |
+0.32% |
| Internet |
$IIX |
290.85 |
+1.28 |
+0.44% |
-5.48% |
| Broker/Dealer |
$XBD |
106.71 |
+0.08 |
+0.08% |
-12.18% |
| Retail |
$RLX |
507.65 |
+5.07 |
+1.01% |
-0.14% |
| Gold & Silver |
$XAU |
190.42 |
+0.30 |
+0.16% |
-15.96% |
| Bank |
$BKX |
47.22 |
-0.23 |
-0.48% |
-9.56% |
| Biotech |
$BTK |
1,404.88 |
+10.93 |
+0.78% |
+8.27% |
|
|
|
 |
Following Choppy Consolidation New Base Not Yet Formed
Kenneth J. Gruneisen - Passed the CAN SLIM® Master's Exam
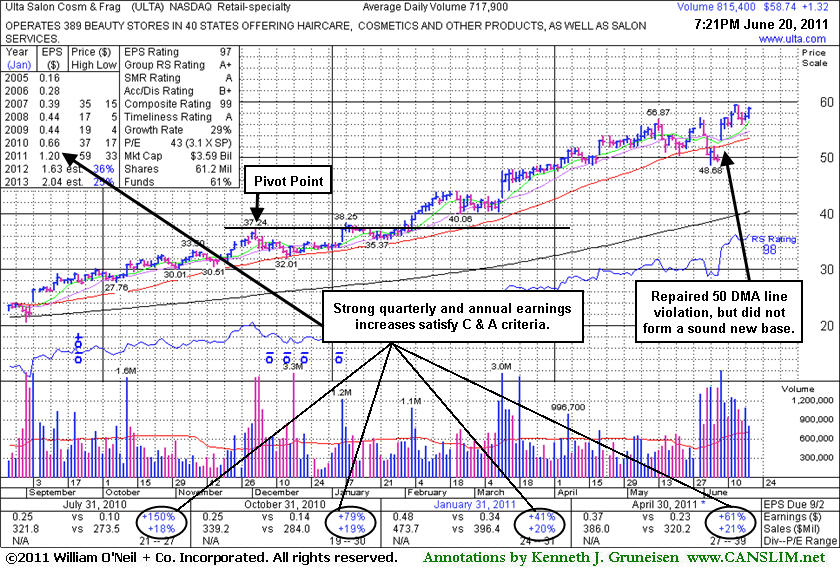
Ulta Salon Cosmetics & Fragrance, Inc. (ULTA +$1.32 or +2.30% to $58.74) posted a gain today with +14% above average volume for its second-best close ever. It is perched near its all-time high, extended from any sound base pattern. Disciplined investors may watch for another sound base to possibly be formed and noted. Since its last appearance in this FSU section on 5/26/11 with analysis and an annotated graph under the headline, "Institutional Ownership Increased During Considerable Rally", it endured distributional pressure, violating its 50-day moving average (DMA) line and slumping briefly under earlier lows raising additional concerns. Its solid 6/08/11 gain with heavy volume, after gapping up, soon repaired the violation and helped its outlook, technically. Its recent low ($48.68 on 6/03/11) defines an important support level to watch now, where any subsequent violation would raise more serious concerns and trigger more worrisome sell signals.
It has been repeatedly noted as extended from any sound base, having steadily climbed, hardly pausing for any sufficient new base to form since its breakout early this year cleared the last pivot point cited. Since first featured in yellow in the 3/12/10 mid-day report at $22.81 and (read here) and in a more detailed Stock Bulletin later that afternoon under the headline "Strong Earnings Increases Help Leader Meet Key Criteria", in just over 15 months it has traded up as much as +160.4%. The number of top-rated funds with an ownership interest has grown from 274 funds in Mar '10 to 463 funds as of Mar '11 which is an encouraging sign of increasing institutional interest (the I criteria). Management's 25% ownership stake (after the latest offering) still keeps the company's directors very motivated to look after and build shareholder value. Its strong quarterly earnings increases above the +25% guideline in the 7 latest comparisons satisfies the C criteria, and its solid annual earnings (A criteria) history is also very reassuring.
|
|
|
Color Codes Explained :
Y - Better candidates highlighted by our
staff of experts.
G - Previously featured
in past reports as yellow but may no longer be buyable under the
guidelines.
***Last / Change / Volume data in this table is the closing quote data***
Symbol/Exchange
Company Name
Industry Group |
PRICE |
CHANGE
(%Change) |
Day High |
Volume
(% DAV)
(% 50 day avg vol) |
52 Wk Hi
% From Hi |
Featured
Date |
Price
Featured |
Pivot Featured |
|
Max Buy |
CACC
-
NASDAQ
Credit Acceptance Corp
FINANCIAL SERVICES - Credit Services
|
$79.35
|
+2.64
3.44% |
$79.67
|
58,284
151.78% of 50 DAV
50 DAV is 38,400
|
$82.29
-3.57%
|
6/2/2011
|
$76.10
|
PP = $82.39
|
|
MB = $86.51
|
 Most Recent Note - 6/20/2011 1:34:45 PM
Y - High-ranked leader in the Finance - Consumer Loans industry is consolidating above its 50 DMA line. It faces little resistance due to overhead supply while now perched -4.2% off its 52-week high. Its color code was changed back to yellow after its recent resilience. Disciplined investors may watch for gains above its recent highs and wait for a follow-through day to confirm a new rally. Meanwhile, recent lows near $75 define important support to watch.
>>> The latest Featured Stock Update with an annotated graph appeared on 6/6/2011. Click here.
View all notes |
Alert me of new notes |
CANSLIM.net Company Profile |
SEC |
Zacks Reports |
StockTalk |
News |
Chart |
Request a new note
C
A N
S L
I M


|
CMG
-
NYSE
Chipotle Mexican Grill
LEISURE - Restaurants
|
$276.05
|
+7.08
2.63% |
$277.25
|
629,213
60.83% of 50 DAV
50 DAV is 1,034,400
|
$295.99
-6.74%
|
4/1/2011
|
$274.00
|
PP = $275.10
|
|
MB = $288.86
|
Most Recent Note - 6/20/2011 1:36:10 PM
G - Gain today with light volume has it trading near its 50 DMA line which has acted as resistance. It has not formed a sound base pattern. An upward trendline connecting its July 2010 and May 2011 lows defines an initial technical support level to watch.
>>> The latest Featured Stock Update with an annotated graph appeared on 6/15/2011. Click here.
View all notes |
Alert me of new notes |
CANSLIM.net Company Profile |
SEC |
Zacks Reports |
StockTalk |
News |
Chart |
Request a new note
C
A N
S L
I M
|
EZPW
-
NASDAQ
Ezcorp Inc Cl A
SPECIALTY RETAIL - Specialty Retail, Other
|
$30.65
|
+0.33
1.09% |
$30.98
|
514,331
145.66% of 50 DAV
50 DAV is 353,100
|
$33.31
-7.99%
|
6/13/2011
|
$31.18
|
PP = $33.41
|
|
MB = $35.08
|
Most Recent Note - 6/20/2011 5:09:34 PM
Y - Overcame early weakness today for a positive reversal near its 50 DMA line as it posted a small gain with slightly above average volume. Recent lows also help define important near-term chart support in the $29 area. The M criteria argues against new buying efforts without a FTD from at least one of the major averages as confirmation of a new rally.
>>> The latest Featured Stock Update with an annotated graph appeared on 6/13/2011. Click here.
View all notes |
Alert me of new notes |
CANSLIM.net Company Profile |
SEC |
Zacks Reports |
StockTalk |
News |
Chart |
Request a new note
C
A N
S L
I M
|
FCFS
-
NASDAQ
First Cash Financial Svs
SPECIALTY RETAIL - Specialty Retail, Other
|
$39.07
|
+0.13
0.33% |
$39.36
|
130,686
68.89% of 50 DAV
50 DAV is 189,700
|
$42.36
-7.77%
|
5/31/2011
|
$42.00
|
PP = $40.23
|
|
MB = $42.24
|
Most Recent Note - 6/20/2011 5:02:37 PM
G - Small gain today on lighter than average volume. Its 50 DMA line and prior lows in the $37 area define support to watch. Its color code was changed to green after damaging losses on higher volume negated its latest breakout.
>>> The latest Featured Stock Update with an annotated graph appeared on 5/31/2011. Click here.
View all notes |
Alert me of new notes |
CANSLIM.net Company Profile |
SEC |
Zacks Reports |
StockTalk |
News |
Chart |
Request a new note
C
A N
S L
I M
|
FOSL
-
NASDAQ
Fossil Inc
CONSUMER DURABLES - Recreational Goods, Other
|
$110.71
|
+4.03
3.78% |
$110.98
|
633,241
85.07% of 50 DAV
50 DAV is 744,400
|
$110.61
0.09%
|
2/1/2011
|
$73.30
|
PP = $74.44
|
|
MB = $78.16
|
Most Recent Note - 6/20/2011 5:05:39 PM
G - Closed near the session high after hitting a new high today with a gain on lighter than average volume. Inching higher after 5 weeks of trading in a very tight range forming a "late-stage" base. Prior highs near $96 define support to watch below its 50 DMA line.
>>> The latest Featured Stock Update with an annotated graph appeared on 6/7/2011. Click here.
View all notes |
Alert me of new notes |
CANSLIM.net Company Profile |
SEC |
Zacks Reports |
StockTalk |
News |
Chart |
Request a new note
C
A N
S L
I M
|
Symbol/Exchange
Company Name
Industry Group |
PRICE |
CHANGE
(%Change) |
Day High |
Volume
(% DAV)
(% 50 day avg vol) |
52 Wk Hi
% From Hi |
Featured
Date |
Price
Featured |
Pivot Featured |
|
Max Buy |
HS
-
NYSE
Healthspring Inc
HEALTH SERVICES - Health Care Plans
|
$44.04
|
+1.00
2.32% |
$44.88
|
1,125,639
135.78% of 50 DAV
50 DAV is 829,000
|
$45.11
-2.37%
|
6/16/2011
|
$42.44
|
PP = $45.21
|
|
MB = $47.47
|
Most Recent Note - 6/20/2011 12:53:22 PM
Y - Gain today has it possibly poised for a new high close while consolidating above its 50 DMA line. A powerful technical breakout could trigger a new (or add-on) technical buy signal, however the M criteria argues against new buying efforts without a follow-through day from at least one of the major averages confirming a new rally. See the latest FSU analysis for more details and a new annotated graph.
>>> The latest Featured Stock Update with an annotated graph appeared on 6/16/2011. Click here.
View all notes |
Alert me of new notes |
CANSLIM.net Company Profile |
SEC |
Zacks Reports |
StockTalk |
News |
Chart |
Request a new note
C
A N
S L
I M
|
INFA
-
NASDAQ
Informatica Corp
COMPUTER SOFTWARE and SERVICES - Business Software and Services
|
$55.45
|
+1.32
2.44% |
$55.52
|
948,542
75.54% of 50 DAV
50 DAV is 1,255,700
|
$59.98
-7.55%
|
3/24/2011
|
$50.04
|
PP = $49.86
|
|
MB = $52.35
|
Most Recent Note - 6/20/2011 4:38:41 PM
G - Posted a second consecutive gain today with lighter volume, finding support near its 50 DMA line. Hit a new 52-week high on 6/01/11 but then there was a negative reversal noted. This high-ranked Computer Software - Database firm did not form a sound new base pattern.
>>> The latest Featured Stock Update with an annotated graph appeared on 6/17/2011. Click here.
View all notes |
Alert me of new notes |
CANSLIM.net Company Profile |
SEC |
Zacks Reports |
StockTalk |
News |
Chart |
Request a new note
C
A N
S L
I M
|
MWIV
-
NASDAQ
M W I Veterinary Supply
HEALTH SERVICES - Medical Instruments and; Supplies
|
$79.80
|
+0.55
0.69% |
$79.95
|
34,730
40.10% of 50 DAV
50 DAV is 86,600
|
$86.99
-8.27%
|
11/4/2010
|
$61.79
|
PP = $59.60
|
|
MB = $62.58
|
Most Recent Note - 6/17/2011 4:04:46 PM
G - It may be forming a new base, however gains have lacked volume conviction following its 50 DMA line violation. Technically, that important short-term average has acted as resistance and a gain above it is needed for its outlook to improve.
>>> The latest Featured Stock Update with an annotated graph appeared on 6/9/2011. Click here.
View all notes |
Alert me of new notes |
CANSLIM.net Company Profile |
SEC |
Zacks Reports |
StockTalk |
News |
Chart |
Request a new note
C
A N
S L
I M
|
OPNT
-
NASDAQ
Opnet Technologies
INTERNET - Internet Software and Services
|
$36.96
|
+0.60
1.65% |
$37.18
|
55,307
44.64% of 50 DAV
50 DAV is 123,900
|
$42.51
-13.06%
|
5/11/2011
|
$41.21
|
PP = $40.50
|
|
MB = $42.53
|
Most Recent Note - 6/20/2011 4:50:36 PM
G - Small gain today on light volume while still consolidating below its 50 DMA line which recently has acted as resistance. Deterioration under its earlier chart low ($35.13 on 4/12/11) would raise more serious concerns.
>>> The latest Featured Stock Update with an annotated graph appeared on 6/10/2011. Click here.
View all notes |
Alert me of new notes |
CANSLIM.net Company Profile |
SEC |
Zacks Reports |
StockTalk |
News |
Chart |
Request a new note
C
A N
S L
I M
|
OTEX
-
NASDAQ
Open Text Corp
INTERNET - Internet Software and Services
|
$59.72
|
+0.86
1.46% |
$59.80
|
186,840
58.90% of 50 DAV
50 DAV is 317,200
|
$67.08
-10.97%
|
6/1/2011
|
$65.86
|
PP = $67.18
|
|
MB = $70.54
|
Most Recent Note - 6/20/2011 4:54:16 PM
G - Closed near the session high today after a positive reversal. It faces resistance up through $66 due to the overhead supply created while trading at higher levels in recent months. Technically, gains above its 50 DMA line are needed for its outlook to improve.
>>> The latest Featured Stock Update with an annotated graph appeared on 6/2/2011. Click here.
View all notes |
Alert me of new notes |
CANSLIM.net Company Profile |
SEC |
Zacks Reports |
StockTalk |
News |
Chart |
Request a new note
C
A N
S L
I M
|
Symbol/Exchange
Company Name
Industry Group |
PRICE |
CHANGE
(%Change) |
Day High |
Volume
(% DAV)
(% 50 day avg vol) |
52 Wk Hi
% From Hi |
Featured
Date |
Price
Featured |
Pivot Featured |
|
Max Buy |
SWI
-
NYSE
Solarwinds Inc
COMPUTER SOFTWARE and SERVICES - Application Software
|
$25.40
|
+0.39
1.56% |
$25.62
|
823,941
119.07% of 50 DAV
50 DAV is 692,000
|
$26.68
-4.80%
|
6/7/2011
|
$24.22
|
PP = $25.05
|
|
MB = $26.30
|
Most Recent Note - 6/20/2011 5:12:59 PM
Y - Small gain today with +18% above average volume, rising back above its pivot point. Following its recent breakout there was a worrisome negative reversal on 6/15/11 with volume 4 times average after hitting a new 52-week high. Prior resistance in the $24-25 area may now act as an initial support level. Previously noted - "Concerns remain until a follow-through day confirms the broader market (M criteria) is truly favorable."
>>> The latest Featured Stock Update with an annotated graph appeared on 6/8/2011. Click here.
View all notes |
Alert me of new notes |
CANSLIM.net Company Profile |
SEC |
Zacks Reports |
StockTalk |
News |
Chart |
Request a new note
C
A N
S L
I M
|
ULTA
-
NASDAQ
Ulta Salon Cosm & Frag
SPECIALTY RETAIL - Specialty Retail, Other
|
$58.74
|
+1.32
2.30% |
$59.01
|
816,500
113.73% of 50 DAV
50 DAV is 717,900
|
$59.40
-1.11%
|
1/6/2011
|
$36.12
|
PP = $37.34
|
|
MB = $39.21
|
Most Recent Note - 6/20/2011 4:43:42 PM
G - Gain today for a second-best close ever, perched near its all-time high, extended from any sound base pattern. The M criteria argues against new buying efforts in stocks until a new confirmed rally with follow-through day from at least one of the major averages.
>>> The latest Featured Stock Update with an annotated graph appeared on 6/20/2011. Click here.
View all notes |
Alert me of new notes |
CANSLIM.net Company Profile |
SEC |
Zacks Reports |
StockTalk |
News |
Chart |
Request a new note
C
A N
S L
I M
|
ZAGG
-
NASDAQ
Zagg Inc
SPECIALTY RETAIL - Specialty Retail, Other
|
$12.12
|
-0.18
-1.48% |
$12.51
|
1,010,699
80.18% of 50 DAV
50 DAV is 1,260,600
|
$13.05
-7.14%
|
6/1/2011
|
$10.92
|
PP = $10.59
|
|
MB = $11.12
|
Most Recent Note - 6/20/2011 4:58:56 PM
G - Holding its ground with volume totals cooling, extended from the previously noted cup-with-handle type base pattern. Prior highs define initial support to watch on pullbacks.
>>> The latest Featured Stock Update with an annotated graph appeared on 6/1/2011. Click here.
View all notes |
Alert me of new notes |
CANSLIM.net Company Profile |
SEC |
Zacks Reports |
StockTalk |
News |
Chart |
Request a new note
C
A N
S L
I M
|
|
|
|
THESE ARE NOT BUY RECOMMENDATIONS!
Comments contained in the body of this report are technical
opinions only. The material herein has been obtained
from sources believed to be reliable and accurate, however,
its accuracy and completeness cannot be guaranteed.
This site is not an investment advisor, hence it does
not endorse or recommend any securities or other investments.
Any recommendation contained in this report may not
be suitable for all investors and it is not to be deemed
an offer or solicitation on our part with respect to
the purchase or sale of any securities. All trademarks,
service marks and trade names appearing in this report
are the property of their respective owners, and are
likewise used for identification purposes only.
This report is a service available
only to active Paid Premium Members.
You may opt-out of receiving report notifications
at any time. Questions or comments may be submitted
by writing to Premium Membership Services 665 S.E. 10 Street, Suite 201 Deerfield Beach, FL 33441-5634 or by calling 1-800-965-8307
or 954-785-1121.
|
|
|

