You are not logged in.
This means you
CAN ONLY VIEW reports that were published prior to Monday, March 31, 2025.
You
MUST UPGRADE YOUR MEMBERSHIP if you want to see any current reports.
AFTER MARKET UPDATE - FRIDAY, JUNE 20TH, 2014
Previous After Market Report Next After Market Report >>>
|
|
|
|
DOW |
+25.62 |
16,947.08 |
+0.15% |
|
Volume |
1,708,356,530 |
+169% |
|
Volume |
2,336,340,410 |
+36% |
|
NASDAQ |
+8.71 |
4,368.04 |
+0.20% |
|
Advancers |
1,761 |
55% |
|
Advancers |
1,563 |
55% |
|
S&P 500 |
+3.39 |
1,962.87 |
+0.17% |
|
Decliners |
1,313 |
41% |
|
Decliners |
1,194 |
42% |
|
Russell 2000 |
+4.39 |
1,188.42 |
+0.37% |
|
52 Wk Highs |
301 |
|
|
52 Wk Highs |
116 |
|
|
S&P 600 |
+2.36 |
679.59 |
+0.35% |
|
52 Wk Lows |
17 |
|
|
52 Wk Lows |
29 |
|
|
 |
Major Averages Rallied With Volume Increase Due to Options Expirations
Kenneth J. Gruneisen - Passed the CAN SLIM® Master's Exam
With Friday's advance, the major averages added to their weekly gains. The Dow rose +1%, the S&P 500 was up +1.4% and the NASDAQ climbed +1.3%. The session's volume was reported much higher than the prior session totals on the NYSE and on the Nasdaq exchange, inflated by options expirations. Advancers led decliners by an 8-7 margin on the NYSE and by a 5-4 margin on the Nasdaq exchange. Leadership expanded as there were 75 high-ranked companies from the CANSLIM.net Leaders List that made new 52-week highs and appeared on the CANSLIM.net BreakOuts Page, up from the total of 55 stocks on the prior session. New 52-week highs swelled and easily outnumbered new 52-week lows on the NYSE and Nasdaq exchange. There were gains for 9 of the 14 high-ranked companies currently included on the Featured Stocks Page. The S&P 500 Index and Dow Jones Industrial Average recently surged into new high territory with healthy leadership (new 52-week highs) sending a reassuring signal that the market direction (M criteria) is in a "confirmed uptrend". Any new buying efforts should be selective and focused in stocks meeting all key criteria of the fact-based investment system.
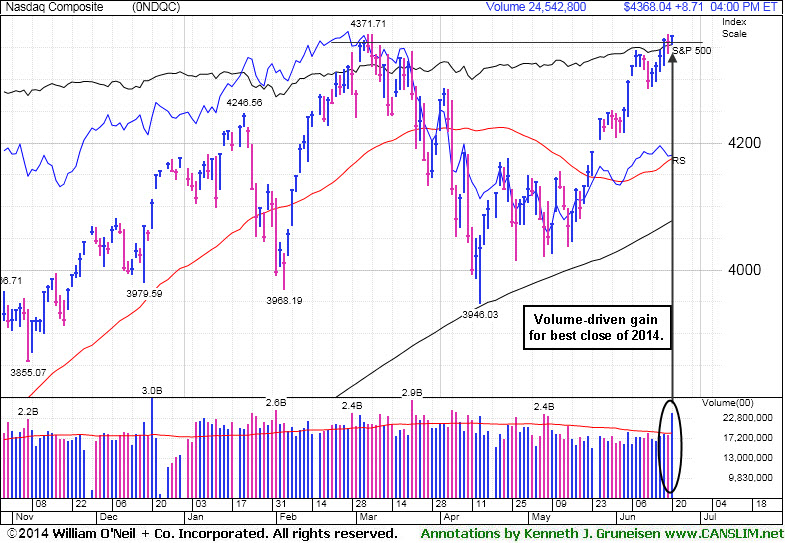
PICTURED: The Nasdaq Composite Index added 9 points while challenging its 52-week high, rallying with heavy volume to close at 4,368, its best close of 2014.
near all-time highs and up +2% year-to-date. Near-term support is at its upward trendline and its 50-day moving average (DMA) line.
The Dow rose 26 points to a record level of 16,947. The S&P 500 gained 3 points to reach an all-time high at 1,962.
The major averages advanced on Friday attributed optimism over this week's positive comments from the Fed. At a press conference following the conclusion of the central bank's policy meeting, Chair Janet Yellen said the economy is rebounding in the current quarter and continue to grow at a moderate pace.
M&A news and earnings releases also provided a modest tailwind to the market. AbbVie (ABBV -1.6%) after Shire (SHPG ) rejected a takeover offer by the drug maker. CarMax (KMX +16.5%) as quarterly results beat projections. Oracle (ORCL -4%) after posting profits below consensus estimates.
Energy and health care were the best performing sectors in the S&P 500 as Exxon (XOM +1.2%) and Johnson & Johnson (JNJ +1.4%) rose. Consumer discretionary was down the most on the session as Amazon.com (AMZN -0.9%) fell.
Treasuries were little changed. The 10-year note rose 3/32 to yield 2.61%. The CANSLIM.net Featured Stocks Page shows the most action-worthy candidates and their latest notes and a Headline Link directs members to the latest detailed analysis with data-packed graphs annotated by a Certified expert along with links to additional resources. The Premium Member Homepage includes "dynamic archives" to all prior pay reports published. Watch for an announcement via email concerning the next WEBCAST.
|
 Kenneth J. Gruneisen started out as a licensed stockbroker in August 1987, a couple of months prior to the historic stock market crash that took the Dow Jones Industrial Average down -22.6% in a single day. He has published daily fact-based fundamental and technical analysis on high-ranked stocks online for two decades. Through FACTBASEDINVESTING.COM, Kenneth provides educational articles, news, market commentary, and other information regarding proven investment systems that work in good times and bad.
Comments contained in the body of this report are technical opinions only and are not necessarily those of Gruneisen Growth Corp. The material herein has been obtained from sources believed to be reliable and accurate, however, its accuracy and completeness cannot be guaranteed. Our firm, employees, and customers may effect transactions, including transactions contrary to any recommendation herein, or have positions in the securities mentioned herein or options with respect thereto. Any recommendation contained in this report may not be suitable for all investors and it is not to be deemed an offer or solicitation on our part with respect to the purchase or sale of any securities. |
|
 |
Financial, Biotech, and Energy-Related Groups Rose
Kenneth J. Gruneisen - Passed the CAN SLIM® Master's Exam
The financial groups had a positive influence on the major averages on Friday as the Broker/Dealer Index ($XBD +0.89%) and the Bank Index ($BKX +0.62%) posted modest gains. The Retail Index ($RLX +0.01%) and the Networking Index ($NWX +0.04%) were both little changed while the Semiconductor Index ($SOX +0.23%) and the Biotechnology Index ($BTK +0.88%) both edged higher. Energy-related shares Integrated Oil Index ($XOI +0.69%) and the Oil Services Index ($OSX +1.60%). The Gold & Silver Index ($XAU -0.67%) pulled back following its big Thursday gain.
Charts courtesy www.stockcharts.com
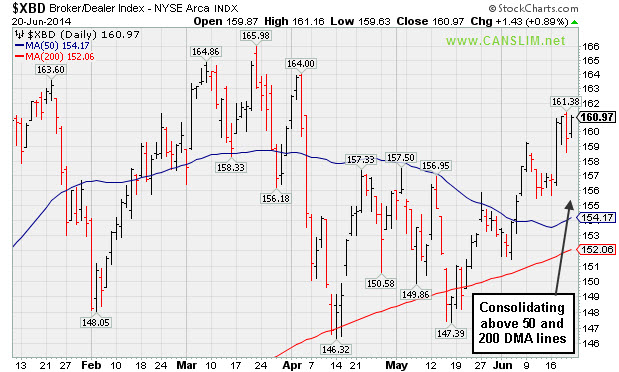
PICTURED 1: The Broker/Dealer Index ($XBD +0.89%) is consolidating above its 50-day and 200-day moving average (DMA) lines. .
Charts courtesy www.stockcharts.com
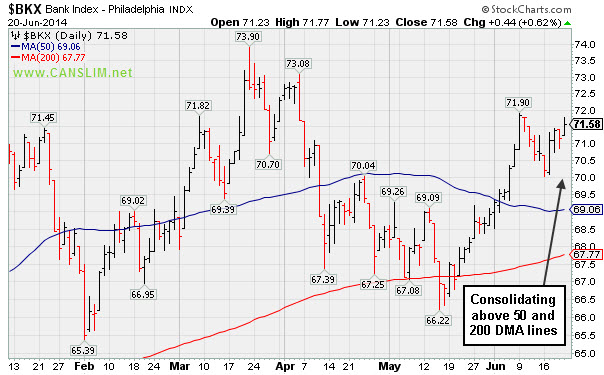
PICTURED 2: The Bank Index ($BKX +0.62%) is consolidating above its 50-day and 200-day moving average (DMA) lines.
| Oil Services |
$OSX |
307.31 |
+4.83 |
+1.60% |
+9.35% |
| Integrated Oil |
$XOI |
1,717.76 |
+11.74 |
+0.69% |
+14.28% |
| Semiconductor |
$SOX |
635.42 |
+1.44 |
+0.23% |
+18.76% |
| Networking |
$NWX |
334.15 |
+0.14 |
+0.04% |
+3.15% |
| Broker/Dealer |
$XBD |
160.97 |
+1.43 |
+0.89% |
+0.26% |
| Retail |
$RLX |
888.05 |
+0.09 |
+0.01% |
-5.51% |
| Gold & Silver |
$XAU |
98.46 |
-0.66 |
-0.67% |
+17.01% |
| Bank |
$BKX |
71.58 |
+0.44 |
+0.62% |
+3.35% |
| Biotech |
$BTK |
2,749.22 |
+23.89 |
+0.88% |
+17.97% |
|
|
|
 |
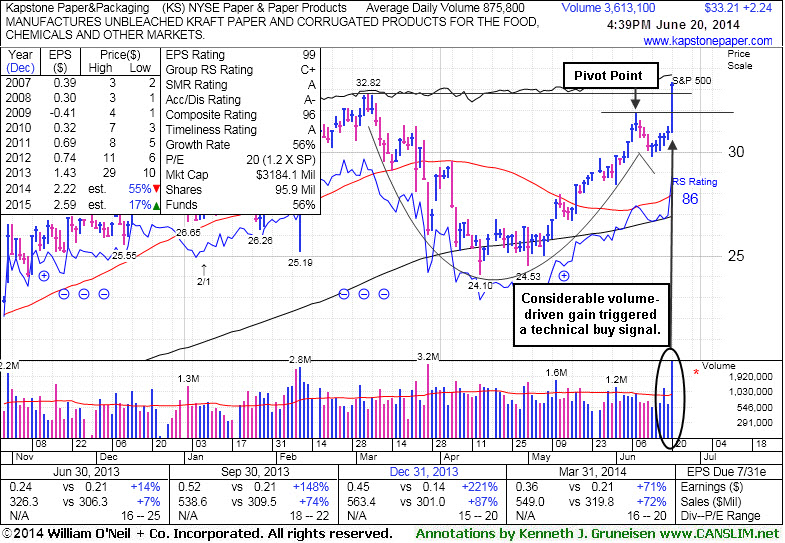
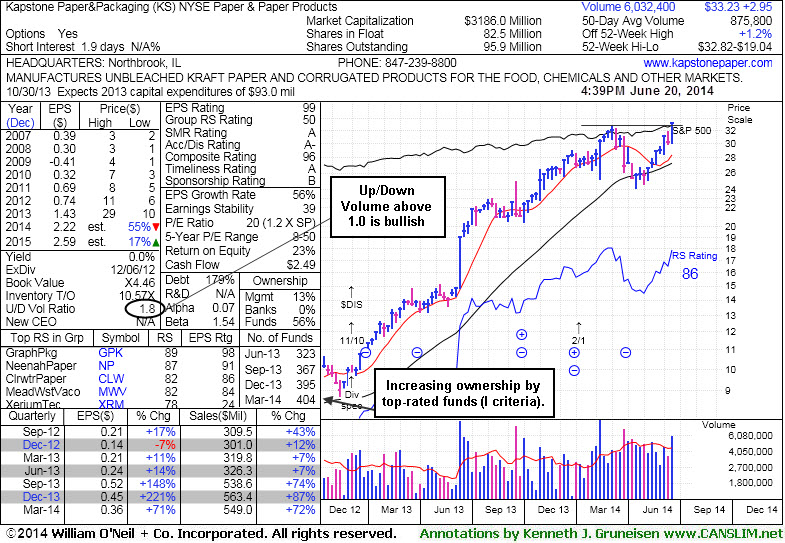
Four Times Average Volume Behind Big Breakout Gain
Kenneth J. Gruneisen - Passed the CAN SLIM® Master's Exam
Kapstone Paper & Packaging (KS +$2.24 or +7.23% to $33.21) finished strong after highlighted in yellow in the earlier mid-day report (read here) while rallying from a cup-with-handle base pattern. It traded more than 4 times average volume while triggering a technical buy signal, rallying above its pivot point, then continuing on into new 52-week high territory. No resistance remains due to overhead supply.
It found support near its 200-day moving average (DMA) line during its consolidation then rebounded. It reported earnings +71% on +72% sales revenues for the Mar '14 quarter, its 3rd consecutive quarterly comparison above the +25% minimum earnings guideline (C criteria). Annual earnings (A criteria) have been improving steadily since a downturn and loss in FY '09. The number of top-rated funds owning its share rose from 323 in Jun '13 to 404 in Mar '14, a reassuring sign concerning the I criteria. Its current Up/Down Volume Ratio of 1.8 is also an unbiased indication its shares have been under accumulation over the past 50 days. The Paper and Paper Products industry group has a mediocre C+ Group Relative Strength rating, however leadership from several other companies in the group is a reassuring sign concerning the L criteria.
|
|
|
Color Codes Explained :
Y - Better candidates highlighted by our
staff of experts.
G - Previously featured
in past reports as yellow but may no longer be buyable under the
guidelines.
***Last / Change / Volume data in this table is the closing quote data***
Symbol/Exchange
Company Name
Industry Group |
PRICE |
CHANGE
(%Change) |
Day High |
Volume
(% DAV)
(% 50 day avg vol) |
52 Wk Hi
% From Hi |
Featured
Date |
Price
Featured |
Pivot Featured |
|
Max Buy |
ACT
-
NYSE
Actavis plc
Medical-Generic Drugs
|
$216.89
|
+1.64
0.76% |
$218.80
|
3,230,849
149.30% of 50 DAV
50 DAV is 2,164,000
|
$230.77
-6.01%
|
6/20/2014
|
$216.53
|
PP = $230.87
|
|
MB = $242.41
|
 Most Recent Note - 6/20/2014 12:08:43 PM
Y - Color code is changed to yellow with pivot point cited based on its 2/26/14 high plus 10 cents. Perched -6.1% off its 52-week high, and subsequent volume-driven gains to new highs may trigger a technical buy signal. Reported earnings +75% on +40% sales revenues for the Mar '14 quarter, and its strong record satisfies the C criteria. Annual earnings (A criteria) history has been strong.
 There are no Featured Stock Updates™ available for this stock at this time. You may request one by clicking the Request a New Note link below
View all notes |
Set NEW NOTE alert |
CANSLIM.net Company Profile |
SEC
News |
Chart |
Request a new note
C
A N
S L
I M


|
AFSI
-
NASDAQ
Amtrust Financial Svcs
INSURANCE - Property and; Casualty Insurance
|
$42.52
|
+0.13
0.31% |
$42.79
|
524,262
78.96% of 50 DAV
50 DAV is 664,000
|
$47.10
-9.72%
|
5/21/2014
|
$44.85
|
PP = $44.85
|
|
MB = $47.09
|
Most Recent Note - 6/20/2014 5:49:04 PM
G - Still consolidating in a tight trading range above its 50 DMA line which acted as support. Disciplined investors always limit losses by selling any stock that falls more than -7% from their purchase price.
>>> FEATURED STOCK ARTICLE : Halted Slide at 50-Day Moving Average After Distributional Pressure - 6/6/2014
View all notes |
Set NEW NOTE alert |
CANSLIM.net Company Profile |
SEC
News |
Chart |
Request a new note
C
A N
S L
I M
|
AL
-
NYSE
Air Lease Corp Cl A
DIVERSIFIED SERVICES - Rental and Leasing Services
|
$39.20
|
-0.06
-0.15% |
$39.41
|
687,404
65.65% of 50 DAV
50 DAV is 1,047,000
|
$42.89
-8.60%
|
5/9/2014
|
$38.27
|
PP = $38.25
|
|
MB = $40.16
|
Most Recent Note - 6/19/2014 10:10:12 AM
G - Found prompt support near its 50 DMA line and prior highs. Any violation of its recent low ($36.55 on 6/13/017) would raise serious concerns and trigger a worrisome technical sell signal.
>>> FEATURED STOCK ARTICLE : Enduring Mild Distributional Pressure on Pullback - 6/11/2014
View all notes |
Set NEW NOTE alert |
CANSLIM.net Company Profile |
SEC
News |
Chart |
Request a new note
C
A N
S L
I M
|
BWLD
-
NASDAQ
Buffalo Wild Wings Inc
LEISURE - Restaurants
|
$156.92
|
-0.20
-0.13% |
$157.40
|
543,347
130.61% of 50 DAV
50 DAV is 416,000
|
$159.81
-1.81%
|
6/19/2014
|
$158.52
|
PP = $159.91
|
|
MB = $167.91
|
Most Recent Note - 6/19/2014 6:44:24 PM
Y - Highlighted in yellow with pivot point cited based on its 3/21/14 high plus 10 cents in the earlier mid-day report (read here). Challenged its 52-week high with today's 3rd consecutive gain while working on the right side of a 13-week base. Subsequent volume-driven gains above the pivot point are still needed to trigger a proper technical buy signal. Reported earnings +71% on +21% sales revenues for the Mar '14 quarter, an improvement after a slightly sub par quarter. See the latest FSU analysis for more details and new annotated graphs.
>>> FEATURED STOCK ARTICLE : Perched Near Highs With Strong Fundamentals - 6/19/2014
View all notes |
Set NEW NOTE alert |
CANSLIM.net Company Profile |
SEC
News |
Chart |
Request a new note
C
A N
S L
I M
|
EQM
-
NYSE
E Q T Midstream Partners
ENERGY - Oil and Gas Pipelines
|
$98.17
|
+3.07
3.23% |
$102.51
|
4,590,153
1,438.92% of 50 DAV
50 DAV is 319,000
|
$97.22
0.98%
|
12/12/2013
|
$53.17
|
PP = $56.51
|
|
MB = $59.34
|
Most Recent Note - 6/20/2014 5:53:01 PM
G - Powered to yet another new 52-week high with today's big volume-driven gain. Prior reports repeatedly cautioned members - "It is very extended from any sound base. Fundamental concerns remain after 2 consecutive sub par quarters below the +25% minimum earnings guideline."
>>> FEATURED STOCK ARTICLE : New Highs Again With Light Volume Behind Streak of Gains - 6/4/2014
View all notes |
Set NEW NOTE alert |
CANSLIM.net Company Profile |
SEC
News |
Chart |
Request a new note
C
A N
S L
I M
|
Symbol/Exchange
Company Name
Industry Group |
PRICE |
CHANGE
(%Change) |
Day High |
Volume
(% DAV)
(% 50 day avg vol) |
52 Wk Hi
% From Hi |
Featured
Date |
Price
Featured |
Pivot Featured |
|
Max Buy |
GRFS
-
NASDAQ
Grifols Sa Ads
Medical-Ethical Drugs
|
$44.82
|
-0.49
-1.08% |
$45.30
|
354,448
52.67% of 50 DAV
50 DAV is 673,000
|
$46.66
-3.94%
|
5/15/2014
|
$41.14
|
PP = $43.55
|
|
MB = $45.73
|
Most Recent Note - 6/17/2014 5:53:44 PM
Y - Volume totals have been cooling while consolidating below its "max buy" level following technical breakout. Prior highs near $43 area define near-term support to watch on pullbacks. See the latest FSU analysis for more details and new annotated graphs.
>>> FEATURED STOCK ARTICLE : Consolidating Just Below "Max Buy" Level - 6/17/2014
View all notes |
Set NEW NOTE alert |
CANSLIM.net Company Profile |
SEC
News |
Chart |
Request a new note
C
A N
S L
I M
|
HF
-
NYSE
H F F Inc Cl A
RETAIL - Grocery Stores
|
$35.11
|
+1.33
3.94% |
$35.12
|
454,168
268.74% of 50 DAV
50 DAV is 169,000
|
$36.06
-2.63%
|
6/20/2014
|
$34.60
|
PP = $36.16
|
|
MB = $37.97
|
Most Recent Note - 6/20/2014 12:36:09 PM
Y - Color code is changed to yellow with pivot point cited based on its 4/02/14 high plus 10 cents. Volume-driven gains above the pivot point are needed to confirm a proper technical buy signal. Consolidating above its 50 DMA line and perched within close striking distance of its 52-week high. Reported earnings +67% on +40% sales revenues for the Mar '14 quarter, its 3rd consecutive quarterly comparison above the +25% minimum earnings guideline (C criteria). Its annual earnings (A criteria) history has improved since a drastic downturn and losses in FY '09.
 There are no Featured Stock Updates™ available for this stock at this time. You may request one by clicking the Request a New Note link below
View all notes |
Set NEW NOTE alert |
CANSLIM.net Company Profile |
SEC
News |
Chart |
Request a new note
C
A N
S L
I M
|
ICON
-
NASDAQ
Iconix Brand Group Inc
CONSUMER NON-DURABLES - Textile - Apparel Footwear
|
$43.38
|
+0.09
0.21% |
$43.78
|
618,724
119.68% of 50 DAV
50 DAV is 517,000
|
$44.81
-3.19%
|
6/5/2014
|
$43.54
|
PP = $43.44
|
|
MB = $45.61
|
Most Recent Note - 6/18/2014 6:30:51 PM
Y - Stalled following its recent technical breakout and it is consolidating above prior highs in the $43-42 area defining initial support to watch. See the latest FSU analysis for more details and new annotated graphs.
>>> FEATURED STOCK ARTICLE : Found Support Above Prior Highs During Consolidation - 6/18/2014
View all notes |
Set NEW NOTE alert |
CANSLIM.net Company Profile |
SEC
News |
Chart |
Request a new note
C
A N
S L
I M
|
KORS
-
NYSE
Michael Kors Hldgs Ltd
RETAIL - Apparel Stores
|
$88.60
|
-0.76
-0.85% |
$90.01
|
2,596,650
90.92% of 50 DAV
50 DAV is 2,855,900
|
$101.04
-12.31%
|
5/27/2014
|
$96.70
|
PP = $101.14
|
|
MB = $106.20
|
Most Recent Note - 6/17/2014 5:58:05 PM
G - Managed an impressive "positive reversal" today after initially slumping well below its 50 DMA line following a damaging loss on the prior session that triggered a technical sell signal. Only a prompt rebound about the 50 DMA line would help its outlook improve.
>>> FEATURED STOCK ARTICLE : Relative Strength Line's Downward Slope a Discouraging Sign - 6/10/2014
View all notes |
Set NEW NOTE alert |
CANSLIM.net Company Profile |
SEC
News |
Chart |
Request a new note
C
A N
S L
I M
|
KS
-
NYSE
Kapstone Paper&Packaging
MANUFACTURING - Paper and Packaging
|
$33.21
|
+2.24
7.23% |
$33.37
|
3,600,438
411.48% of 50 DAV
50 DAV is 875,000
|
$32.82
1.19%
|
6/20/2014
|
$32.30
|
PP = $31.92
|
|
MB = $33.52
|
Most Recent Note - 6/20/2014 5:46:51 PM
Y - Finished strong with a gain on 4 times average volume triggering a technical buy signal today. Highlighted in yellow while rallying from a cup-with-handle base in the earlier mid-day report (read here). See the latest FSU analysis for more details and new annotated graphs.
>>> FEATURED STOCK ARTICLE : Four Times Average Volume Behind Big Breakout Gain - 6/20/2014
View all notes |
Set NEW NOTE alert |
CANSLIM.net Company Profile |
SEC
News |
Chart |
Request a new note
C
A N
S L
I M
|
Symbol/Exchange
Company Name
Industry Group |
PRICE |
CHANGE
(%Change) |
Day High |
Volume
(% DAV)
(% 50 day avg vol) |
52 Wk Hi
% From Hi |
Featured
Date |
Price
Featured |
Pivot Featured |
|
Max Buy |
PANW
-
NYSE
Palo Alto Networks
Computer Sftwr-Security
|
$80.24
|
+0.04
0.05% |
$80.79
|
1,323,627
70.78% of 50 DAV
50 DAV is 1,870,000
|
$82.27
-2.47%
|
5/29/2014
|
$75.95
|
PP = $72.50
|
|
MB = $76.13
|
Most Recent Note - 6/16/2014 5:54:47 PM
G - Finished at a best-ever close with near average volume behind today's 5th consecutive gain. Prior highs near $72 define important support above its 50 DMA line.
>>> FEATURED STOCK ARTICLE : Encountered Distributional Pressure After Touching New 52-Week High - 6/12/2014
View all notes |
Set NEW NOTE alert |
CANSLIM.net Company Profile |
SEC
News |
Chart |
Request a new note
C
A N
S L
I M
|
SN
-
NYSE
Sanchez Energy Corp
ENERGY - Independent Oil and Gas
|
$38.00
|
+0.71
1.90% |
$38.02
|
2,287,181
160.62% of 50 DAV
50 DAV is 1,424,000
|
$37.69
0.82%
|
5/22/2014
|
$33.00
|
PP = $31.59
|
|
MB = $33.17
|
Most Recent Note - 6/20/2014 5:50:37 PM
G - Hit another new 52-week high with above average volume behind today's 3rd consecutive gain, getting more extended from its prior base. Disciplined investors avoid chasing extended stocks. Prior highs near $31-32 define support to watch on pullbacks.
>>> FEATURED STOCK ARTICLE : Finished Near Session Low After Hitting new 52-Week High - 6/9/2014
View all notes |
Set NEW NOTE alert |
CANSLIM.net Company Profile |
SEC
News |
Chart |
Request a new note
C
A N
S L
I M
|
TRN
-
NYSE
Trinity Industries Inc
TRANSPORTATION - Railroads
|
$42.23
|
-0.35
-0.82% |
$43.23
|
4,234,865
132.59% of 50 DAV
50 DAV is 3,194,000
|
$43.94
-3.90%
|
4/30/2014
|
$75.57
|
PP = $76.05
|
|
MB = $79.85
|
Most Recent Note - 6/19/2014 1:18:10 PM
G - Perched within close striking distance of its 52-week high, extended from its prior base. Recent lows in the $79 area and its 50 DMA line coincide defining important near-term support to watch.
>>> FEATURED STOCK ARTICLE : Recent Lows and 50-Day Moving Average Line Define Near-Term Support - 6/16/2014
View all notes |
Set NEW NOTE alert |
CANSLIM.net Company Profile |
SEC
News |
Chart |
Request a new note
C
A N
S L
I M
|
WLK
-
NYSE
Westlake Chemical Corp
CHEMICALS - Specialty Chemicals
|
$84.77
|
+0.41
0.49% |
$84.91
|
479,365
66.03% of 50 DAV
50 DAV is 726,000
|
$84.54
0.27%
|
4/29/2014
|
$72.79
|
PP = $69.31
|
|
MB = $72.78
|
Most Recent Note - 6/20/2014 5:51:52 PM
G - Inched to another new 52-week high with today's 4th consecutive gain. Prior highs near $77 define important near-term support to watch on pullbacks.
>>> FEATURED STOCK ARTICLE : Chemical Firm Quietly Posted 7th Consecutive Weekly Gain - 6/13/2014
View all notes |
Set NEW NOTE alert |
CANSLIM.net Company Profile |
SEC
News |
Chart |
Request a new note
C
A N
S L
I M
|
|
|
|
THESE ARE NOT BUY RECOMMENDATIONS!
Comments contained in the body of this report are technical
opinions only. The material herein has been obtained
from sources believed to be reliable and accurate, however,
its accuracy and completeness cannot be guaranteed.
This site is not an investment advisor, hence it does
not endorse or recommend any securities or other investments.
Any recommendation contained in this report may not
be suitable for all investors and it is not to be deemed
an offer or solicitation on our part with respect to
the purchase or sale of any securities. All trademarks,
service marks and trade names appearing in this report
are the property of their respective owners, and are
likewise used for identification purposes only.
This report is a service available
only to active Paid Premium Members.
You may opt-out of receiving report notifications
at any time. Questions or comments may be submitted
by writing to Premium Membership Services 665 S.E. 10 Street, Suite 201 Deerfield Beach, FL 33441-5634 or by calling 1-800-965-8307
or 954-785-1121.
|
|
|

