You are not logged in.
This means you
CAN ONLY VIEW reports that were published prior to Wednesday, April 9, 2025.
You
MUST UPGRADE YOUR MEMBERSHIP if you want to see any current reports.
AFTER MARKET UPDATE - THURSDAY, JUNE 19TH, 2014
Previous After Market Report Next After Market Report >>>
|
|
|
|
DOW |
+14.84 |
16,921.46 |
+0.09% |
|
Volume |
635,903,620 |
+4% |
|
Volume |
1,715,922,550 |
-1% |
|
NASDAQ |
-3.51 |
4,359.33 |
-0.08% |
|
Advancers |
1,729 |
55% |
|
Advancers |
1,216 |
43% |
|
S&P 500 |
+2.50 |
1,959.48 |
+0.13% |
|
Decliners |
1,310 |
41% |
|
Decliners |
1,532 |
54% |
|
Russell 2000 |
+0.90 |
1,184.03 |
+0.08% |
|
52 Wk Highs |
275 |
|
|
52 Wk Highs |
124 |
|
|
S&P 600 |
+0.26 |
677.23 |
+0.04% |
|
52 Wk Lows |
12 |
|
|
52 Wk Lows |
27 |
|
|
 |
Major Averages Ended Mixed and Little Changed
Kenneth J. Gruneisen - Passed the CAN SLIM® Master's Exam
The major averages ended mixed and little changed on Thursday. The volume was reported mixed, higher than the prior session total on the NYSE and lower on the Nasdaq exchange. Advancers led decliners by a 9-7 margin on the NYSE but decliners led advancers by about a 5-4 margin on the Nasdaq exchange. There were 55 high-ranked companies from the CANSLIM.net Leaders List that made new 52-week highs and appeared on the CANSLIM.net BreakOuts Page, up from the total of 48 stocks on the prior session. New 52-week highs swelled and easily outnumbered new 52-week lows on the NYSE and Nasdaq exchange. There were gains for 6 of the 11 high-ranked companies currently included on the Featured Stocks Page. The S&P 500 Index and Dow Jones Industrial Average recently surged into new high territory with healthy leadership (new 52-week highs) sending a reassuring signal that the market direction (M criteria) is in a "confirmed uptrend". Any new buying efforts should be selective and focused in stocks meeting all key criteria of the fact-based investment system.
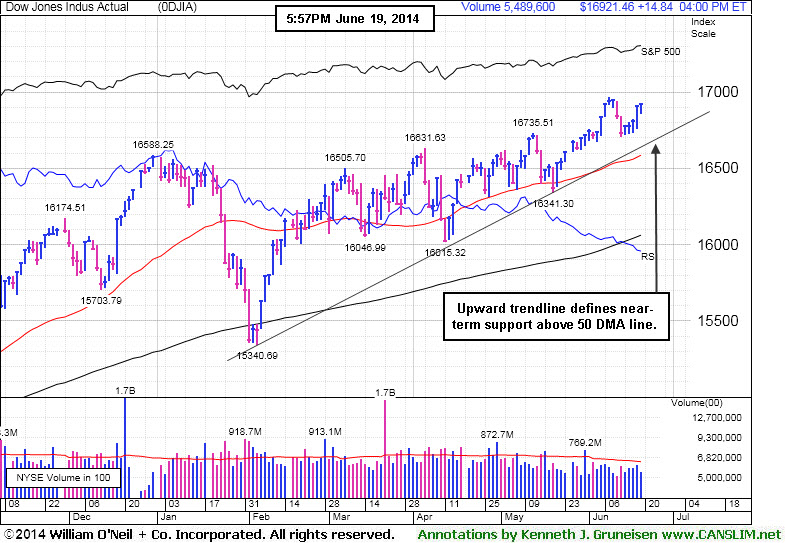
PICTURED: The Dow Jones Industrial Average is consolidating near all-time highs and up +2% year-to-date. Near-term support is at its upward trendline and its 50-day moving average (DMA) line.
The major averages ended a choppy session mixed as investors weighed the latest economic data releases. Before the open, weekly jobless claims fell 6,000 to 312,000, slightly better than the 313,000 consensus estimate. A separate release revealed activity in the Fed's Philadelphia region unexpectedly expanded at a faster pace in June. The index of leading indicators rose +0.5% in May versus expectations to increase +0.6%.
On the earnings front, Kroger (KR +5.06%) rose after quarterly results beat analyst projections and the company increased its full-year forecast. Blackberry (BBRY +9.65%) jumped as the smartphone maker posted a narrower-than-expected loss. Shares of Coach (COH -8.93%) slumped after providing a reduced sales outlook for its North American stores.
The defensive utility and consumer staples sectors were the best performing in S&P 500. Dominion Resources (D +1.5%) and Philip Morris International (PM +1.62%) rose. Financials and materials were down the most on the session. JP Morgan Chase & Co (JPM -0.83%) and Dow Chemical (DOW -0.86%) ended the day lower.
Treasuries retreated with the benchmark note falling 12/32 to yield 2.63%.
The CANSLIM.net Featured Stocks Page shows the most action-worthy candidates and their latest notes and a Headline Link directs members to the latest detailed analysis with data-packed graphs annotated by a Certified expert along with links to additional resources. The Premium Member Homepage includes "dynamic archives" to all prior pay reports published. Watch for an announcement via email concerning the next WEBCAST.
|
 Kenneth J. Gruneisen started out as a licensed stockbroker in August 1987, a couple of months prior to the historic stock market crash that took the Dow Jones Industrial Average down -22.6% in a single day. He has published daily fact-based fundamental and technical analysis on high-ranked stocks online for two decades. Through FACTBASEDINVESTING.COM, Kenneth provides educational articles, news, market commentary, and other information regarding proven investment systems that work in good times and bad.
Comments contained in the body of this report are technical opinions only and are not necessarily those of Gruneisen Growth Corp. The material herein has been obtained from sources believed to be reliable and accurate, however, its accuracy and completeness cannot be guaranteed. Our firm, employees, and customers may effect transactions, including transactions contrary to any recommendation herein, or have positions in the securities mentioned herein or options with respect thereto. Any recommendation contained in this report may not be suitable for all investors and it is not to be deemed an offer or solicitation on our part with respect to the purchase or sale of any securities. |
|
 |
Gold & Silver Index Was a Standout Gainer
Kenneth J. Gruneisen - Passed the CAN SLIM® Master's Exam
The Gold & Silver Index ($XAU +4.66%) was a standout gainer on Thursday while other industry groups had difficulty making headway. energy-related groups had a positive bias as the Oil Services Index ($OSX +0.54%) and the Integrated Oil Index ($XOI +0.68%) both edged higher. Meanwhile the Broker/Dealer Index ($XBD -0.94%) and the Bank Index ($BKX -0.35%) edged lower while a loss from the Retail Index ($RLX -0.73%) also created a drag on the major averages. The Networking Index ($NWX -1.29%) fell while the Biotechnology Index ($BTK -0.06%) and the Semiconductor Index ($SOX +0.12%) finished flat.
Charts courtesy www.stockcharts.com
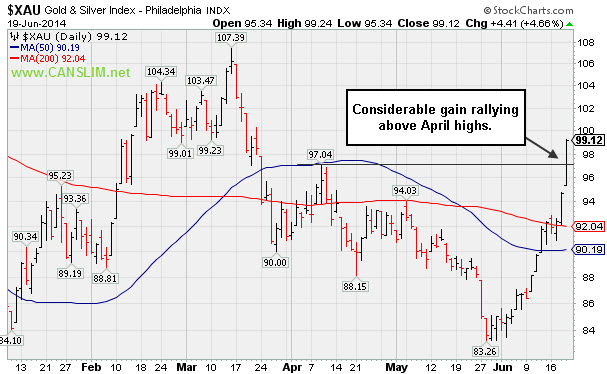
PICTURED: The Gold & Silver Index ($XAU +4.66%) rallied above its April high with a considerable gain on Thursday.
| Oil Services |
$OSX |
302.48 |
+1.63 |
+0.54% |
+7.63% |
| Integrated Oil |
$XOI |
1,706.03 |
+11.46 |
+0.68% |
+13.50% |
| Semiconductor |
$SOX |
633.98 |
+0.78 |
+0.12% |
+18.49% |
| Networking |
$NWX |
334.01 |
-4.36 |
-1.29% |
+3.11% |
| Broker/Dealer |
$XBD |
159.54 |
-1.52 |
-0.94% |
-0.63% |
| Retail |
$RLX |
894.51 |
+10.02 |
+1.13% |
-4.82% |
| Gold & Silver |
$XAU |
99.12 |
+4.41 |
+4.66% |
+17.79% |
| Bank |
$BKX |
71.39 |
+0.30 |
+0.42% |
+3.08% |
| Biotech |
$BTK |
2,725.32 |
-1.66 |
-0.06% |
+16.95% |
|
|
|
 |
Perched Near Highs With Strong Fundamentals
Kenneth J. Gruneisen - Passed the CAN SLIM® Master's Exam
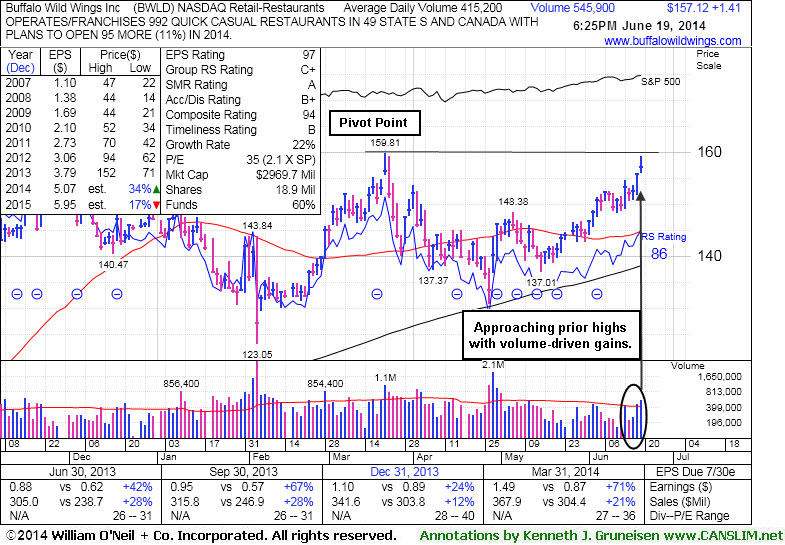
Buffalo Wild Wings Inc (BWLD +$1.41 or +0.91% to $157.12) was highlighted in yellow with pivot point cited based on its 3/21/14 high plus 10 cents in the earlier mid-day report (read here). It challenged its 52-week high with today's 3rd consecutive gain while working on the right side of a 13-week base. Subsequent volume-driven gains above the pivot point are still needed to trigger a proper technical buy signal.
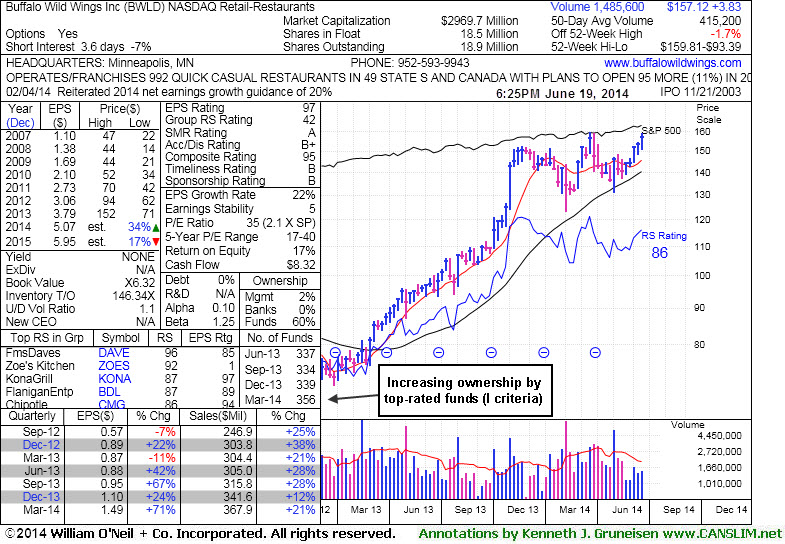
It reported earnings +71% on +21% sales revenues for the Mar '14 quarter, well above the +25% minimum earnings (C criteria) guideline, an improvement after a slightly sub par quarter. It found support at its 200-day moving average (DMA) line then rebounded since last noted with caution in the 4/03/14 mid-day report - "Reported earnings +24% on +12% sales revenues for the Dec '13 quarter."
The number of top-rated funds owning its shares rose from 337 in Jun '13 to 356 in Mar '14, a reassuring sign concerning the I criteria. Its small supply of only 18.9 million shares (S criteria) outstanding can contribute to great price volatility in the event of institutional buying or selling.
|
|
|
Color Codes Explained :
Y - Better candidates highlighted by our
staff of experts.
G - Previously featured
in past reports as yellow but may no longer be buyable under the
guidelines.
***Last / Change / Volume data in this table is the closing quote data***
Symbol/Exchange
Company Name
Industry Group |
PRICE |
CHANGE
(%Change) |
Day High |
Volume
(% DAV)
(% 50 day avg vol) |
52 Wk Hi
% From Hi |
Featured
Date |
Price
Featured |
Pivot Featured |
|
Max Buy |
AFSI
-
NASDAQ
Amtrust Financial Svcs
INSURANCE - Property and; Casualty Insurance
|
$42.39
|
-0.06
-0.14% |
$42.78
|
351,924
53.08% of 50 DAV
50 DAV is 663,000
|
$47.10
-10.00%
|
5/21/2014
|
$44.85
|
PP = $44.85
|
|
MB = $47.09
|
Most Recent Note - 6/13/2014 5:13:01 PM
G - Volume totals have been cooling while consolidating above its 50 DMA line which acted as support. Disciplined investors always limit losses by selling any stock that falls more than -7% from their purchase price.
>>> FEATURED STOCK ARTICLE : Halted Slide at 50-Day Moving Average After Distributional Pressure - 6/6/2014
View all notes |
Set NEW NOTE alert |
CANSLIM.net Company Profile |
SEC
News |
Chart |
Request a new note
C
A N
S L
I M


|
AL
-
NYSE
Air Lease Corp Cl A
DIVERSIFIED SERVICES - Rental and Leasing Services
|
$39.26
|
+0.49
1.26% |
$39.38
|
1,073,961
102.58% of 50 DAV
50 DAV is 1,047,000
|
$42.89
-8.46%
|
5/9/2014
|
$38.27
|
PP = $38.25
|
|
MB = $40.16
|
 Most Recent Note - 6/19/2014 10:10:12 AM
G - Found prompt support near its 50 DMA line and prior highs. Any violation of its recent low ($36.55 on 6/13/017) would raise serious concerns and trigger a worrisome technical sell signal.
>>> FEATURED STOCK ARTICLE : Enduring Mild Distributional Pressure on Pullback - 6/11/2014
View all notes |
Set NEW NOTE alert |
CANSLIM.net Company Profile |
SEC
News |
Chart |
Request a new note
C
A N
S L
I M
|
BWLD
-
NASDAQ
Buffalo Wild Wings Inc
LEISURE - Restaurants
|
$157.12
|
+1.41
0.91% |
$159.17
|
546,103
131.59% of 50 DAV
50 DAV is 415,000
|
$159.81
-1.68%
|
6/19/2014
|
$158.52
|
PP = $159.91
|
|
MB = $167.91
|
Most Recent Note - 6/19/2014 6:44:24 PM
Y - Highlighted in yellow with pivot point cited based on its 3/21/14 high plus 10 cents in the earlier mid-day report (read here). Challenged its 52-week high with today's 3rd consecutive gain while working on the right side of a 13-week base. Subsequent volume-driven gains above the pivot point are still needed to trigger a proper technical buy signal. Reported earnings +71% on +21% sales revenues for the Mar '14 quarter, an improvement after a slightly sub par quarter. See the latest FSU analysis for more details and new annotated graphs.
>>> FEATURED STOCK ARTICLE : Perched Near Highs With Strong Fundamentals - 6/19/2014
View all notes |
Set NEW NOTE alert |
CANSLIM.net Company Profile |
SEC
News |
Chart |
Request a new note
C
A N
S L
I M
|
EQM
-
NYSE
E Q T Midstream Partners
ENERGY - Oil and Gas Pipelines
|
$95.10
|
+3.47
3.79% |
$95.41
|
851,649
280.15% of 50 DAV
50 DAV is 304,000
|
$97.22
-2.18%
|
12/12/2013
|
$53.17
|
PP = $56.51
|
|
MB = $59.34
|
Most Recent Note - 6/19/2014 12:47:15 PM
G - Perched near its 52-week high today. Prior reports repeatedly cautioned members - "It is very extended from any sound base. Fundamental concerns remain after 2 consecutive sub par quarters below the +25% minimum earnings guideline."
>>> FEATURED STOCK ARTICLE : New Highs Again With Light Volume Behind Streak of Gains - 6/4/2014
View all notes |
Set NEW NOTE alert |
CANSLIM.net Company Profile |
SEC
News |
Chart |
Request a new note
C
A N
S L
I M
|
GRFS
-
NASDAQ
Grifols Sa Ads
Medical-Ethical Drugs
|
$45.31
|
-0.43
-0.94% |
$45.84
|
314,170
46.13% of 50 DAV
50 DAV is 681,000
|
$46.66
-2.89%
|
5/15/2014
|
$41.14
|
PP = $43.55
|
|
MB = $45.73
|
Most Recent Note - 6/17/2014 5:53:44 PM
Y - Volume totals have been cooling while consolidating below its "max buy" level following technical breakout. Prior highs near $43 area define near-term support to watch on pullbacks. See the latest FSU analysis for more details and new annotated graphs.
>>> FEATURED STOCK ARTICLE : Consolidating Just Below "Max Buy" Level - 6/17/2014
View all notes |
Set NEW NOTE alert |
CANSLIM.net Company Profile |
SEC
News |
Chart |
Request a new note
C
A N
S L
I M
|
Symbol/Exchange
Company Name
Industry Group |
PRICE |
CHANGE
(%Change) |
Day High |
Volume
(% DAV)
(% 50 day avg vol) |
52 Wk Hi
% From Hi |
Featured
Date |
Price
Featured |
Pivot Featured |
|
Max Buy |
ICON
-
NASDAQ
Iconix Brand Group Inc
CONSUMER NON-DURABLES - Textile - Apparel Footwear
|
$43.29
|
-0.58
-1.32% |
$43.98
|
305,115
59.02% of 50 DAV
50 DAV is 517,000
|
$44.81
-3.39%
|
6/5/2014
|
$43.54
|
PP = $43.44
|
|
MB = $45.61
|
Most Recent Note - 6/18/2014 6:30:51 PM
Y - Stalled following its recent technical breakout and it is consolidating above prior highs in the $43-42 area defining initial support to watch. See the latest FSU analysis for more details and new annotated graphs.
>>> FEATURED STOCK ARTICLE : Found Support Above Prior Highs During Consolidation - 6/18/2014
View all notes |
Set NEW NOTE alert |
CANSLIM.net Company Profile |
SEC
News |
Chart |
Request a new note
C
A N
S L
I M
|
KORS
-
NYSE
Michael Kors Hldgs Ltd
RETAIL - Apparel Stores
|
$89.36
|
-1.46
-1.61% |
$91.00
|
4,382,578
154.29% of 50 DAV
50 DAV is 2,840,500
|
$101.04
-11.56%
|
5/27/2014
|
$96.70
|
PP = $101.14
|
|
MB = $106.20
|
Most Recent Note - 6/17/2014 5:58:05 PM
G - Managed an impressive "positive reversal" today after initially slumping well below its 50 DMA line following a damaging loss on the prior session that triggered a technical sell signal. Only a prompt rebound about the 50 DMA line would help its outlook improve.
>>> FEATURED STOCK ARTICLE : Relative Strength Line's Downward Slope a Discouraging Sign - 6/10/2014
View all notes |
Set NEW NOTE alert |
CANSLIM.net Company Profile |
SEC
News |
Chart |
Request a new note
C
A N
S L
I M
|
PANW
-
NYSE
Palo Alto Networks
Computer Sftwr-Security
|
$80.20
|
-0.30
-0.37% |
$81.79
|
1,012,077
53.27% of 50 DAV
50 DAV is 1,900,000
|
$82.27
-2.52%
|
5/29/2014
|
$75.95
|
PP = $72.50
|
|
MB = $76.13
|
Most Recent Note - 6/16/2014 5:54:47 PM
G - Finished at a best-ever close with near average volume behind today's 5th consecutive gain. Prior highs near $72 define important support above its 50 DMA line.
>>> FEATURED STOCK ARTICLE : Encountered Distributional Pressure After Touching New 52-Week High - 6/12/2014
View all notes |
Set NEW NOTE alert |
CANSLIM.net Company Profile |
SEC
News |
Chart |
Request a new note
C
A N
S L
I M
|
SN
-
NYSE
Sanchez Energy Corp
ENERGY - Independent Oil and Gas
|
$37.29
|
+0.28
0.76% |
$37.69
|
1,020,226
72.20% of 50 DAV
50 DAV is 1,413,000
|
$37.23
0.16%
|
5/22/2014
|
$33.00
|
PP = $31.59
|
|
MB = $33.17
|
Most Recent Note - 6/13/2014 12:49:07 PM
G - Perched at its 52-week high today, extended from its prior base. Disciplined investors avoid chasing extended stocks. Prior highs near $31-32 define support to watch on pullbacks. Priced the recently announced offering of Common Stock and Senior Notes.
>>> FEATURED STOCK ARTICLE : Finished Near Session Low After Hitting new 52-Week High - 6/9/2014
View all notes |
Set NEW NOTE alert |
CANSLIM.net Company Profile |
SEC
News |
Chart |
Request a new note
C
A N
S L
I M
|
TRN
-
NYSE
Trinity Industries Inc
TRANSPORTATION - Railroads
|
$85.16
|
+0.15
0.18% |
$86.69
|
2,046,005
129.33% of 50 DAV
50 DAV is 1,582,000
|
$87.89
-3.10%
|
4/30/2014
|
$75.57
|
PP = $76.05
|
|
MB = $79.85
|
Most Recent Note - 6/19/2014 1:18:10 PM
G - Perched within close striking distance of its 52-week high, extended from its prior base. Recent lows in the $79 area and its 50 DMA line coincide defining important near-term support to watch.
>>> FEATURED STOCK ARTICLE : Recent Lows and 50-Day Moving Average Line Define Near-Term Support - 6/16/2014
View all notes |
Set NEW NOTE alert |
CANSLIM.net Company Profile |
SEC
News |
Chart |
Request a new note
C
A N
S L
I M
|
Symbol/Exchange
Company Name
Industry Group |
PRICE |
CHANGE
(%Change) |
Day High |
Volume
(% DAV)
(% 50 day avg vol) |
52 Wk Hi
% From Hi |
Featured
Date |
Price
Featured |
Pivot Featured |
|
Max Buy |
WLK
-
NYSE
Westlake Chemical Corp
CHEMICALS - Specialty Chemicals
|
$84.36
|
+0.61
0.73% |
$84.54
|
482,189
66.23% of 50 DAV
50 DAV is 728,000
|
$83.79
0.68%
|
4/29/2014
|
$72.79
|
PP = $69.31
|
|
MB = $72.78
|
Most Recent Note - 6/13/2014 5:56:43 PM
G - Quietly hovering near its 52-week high. Prior highs near $77 define important near-term support to watch on pullbacks. See the latest FSU analysis for more details and new annotated graphs.
>>> FEATURED STOCK ARTICLE : Chemical Firm Quietly Posted 7th Consecutive Weekly Gain - 6/13/2014
View all notes |
Set NEW NOTE alert |
CANSLIM.net Company Profile |
SEC
News |
Chart |
Request a new note
C
A N
S L
I M
|
|
|
|
THESE ARE NOT BUY RECOMMENDATIONS!
Comments contained in the body of this report are technical
opinions only. The material herein has been obtained
from sources believed to be reliable and accurate, however,
its accuracy and completeness cannot be guaranteed.
This site is not an investment advisor, hence it does
not endorse or recommend any securities or other investments.
Any recommendation contained in this report may not
be suitable for all investors and it is not to be deemed
an offer or solicitation on our part with respect to
the purchase or sale of any securities. All trademarks,
service marks and trade names appearing in this report
are the property of their respective owners, and are
likewise used for identification purposes only.
This report is a service available
only to active Paid Premium Members.
You may opt-out of receiving report notifications
at any time. Questions or comments may be submitted
by writing to Premium Membership Services 665 S.E. 10 Street, Suite 201 Deerfield Beach, FL 33441-5634 or by calling 1-800-965-8307
or 954-785-1121.
|
|
|

