You are not logged in.
This means you
CAN ONLY VIEW reports that were published prior to Monday, April 14, 2025.
You
MUST UPGRADE YOUR MEMBERSHIP if you want to see any current reports.
AFTER MARKET UPDATE - WEDNESDAY, JUNE 18TH, 2014
Previous After Market Report Next After Market Report >>>
|
|
|
|
DOW |
+98.13 |
16,906.62 |
+0.58% |
|
Volume |
613,851,930 |
+5% |
|
Volume |
1,732,472,170 |
+3% |
|
NASDAQ |
+25.61 |
4,362.84 |
+0.59% |
|
Advancers |
2,244 |
70% |
|
Advancers |
1,748 |
59% |
|
S&P 500 |
+14.99 |
1,956.98 |
+0.77% |
|
Decliners |
814 |
26% |
|
Decliners |
1,078 |
37% |
|
Russell 2000 |
+6.51 |
1,183.13 |
+0.55% |
|
52 Wk Highs |
148 |
|
|
52 Wk Highs |
81 |
|
|
S&P 600 |
+3.39 |
676.97 |
+0.50% |
|
52 Wk Lows |
10 |
|
|
52 Wk Lows |
27 |
|
|
 |
S&P 500 Index Hits Record High With Late-Afternoon Rally
Kenneth J. Gruneisen - Passed the CAN SLIM® Master's Exam
The major averages extended their gains in the afternoon and finished firmly in positive territory following the Fed's policy meeting. The volume was reported higher than the prior session total on the Nasdaq exchange and on the NYSE, a sign of greater institutional buying demand. Advancers led decliners by nearly a 3-1 margin on the NYSE and by about a 3-2 margin on the Nasdaq exchange. There were 48 high-ranked companies from the CANSLIM.net Leaders List that made new 52-week highs and appeared on the CANSLIM.net BreakOuts Page, matching the total of 48 stocks on the prior session. New 52-week highs outnumbered new 52-week lows on the NYSE and Nasdaq exchange. There were gains for 6 of the 10 high-ranked companies currently included on the Featured Stocks Page. The S&P 500 Index and Dow Jones Industrial Average recently surged into new high territory with healthy leadership (new 52-week highs) sending a reassuring signal that the market direction (M criteria) is in a "confirmed uptrend". Any new buying efforts should be selective and focused in stocks meeting all key criteria of the fact-based investment system.
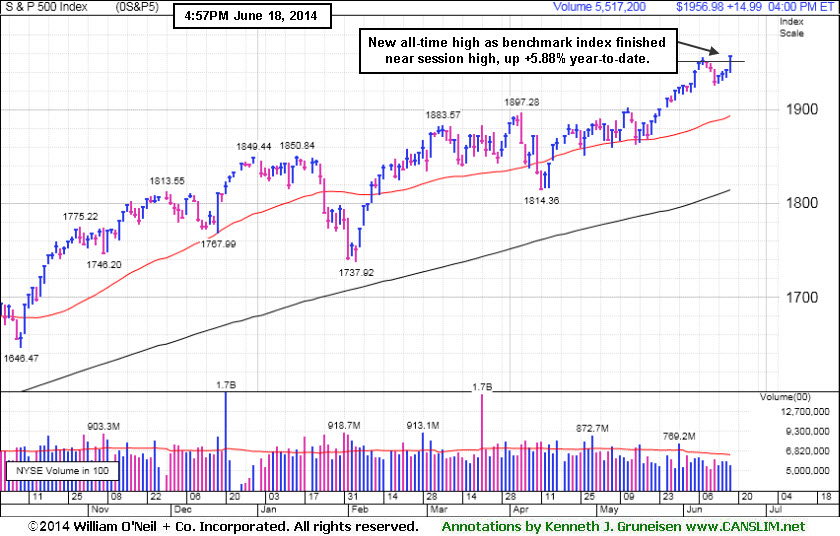
PICTURED: The S&P 500 Index advanced 15 points to a new all-time high of 1,956. The benchmark index is up +5.88% year-to-date.
The Nasdaq Composite Index climbed 26 points to 4,362. The Dow rose 98 points to 16,906. As expected, the central bank trimmed its monthly asset purchases by another $10 billion to $35 billion. The market added to its advance following comments from Chair Janet Yellen. At a press conference, Yellen said the economy is recovering in the current quarter and should continue to improve at a moderate pace.
On the earnings front, Adobe (ADBE +8.2%) after posting quarterly results above analyst projections. FedEx (FDX +6.16%) as its profits topped consensus estimates. Shares of ConAgra (CAG -7.3%) following its reduced outlook for the current quarter.
All 10 sectors in the S&P 500 were up on the session. Utilities and materials were the best performing groups. Duke Energy (DUK +2.4%) was higher. Shares of Air Products (APD +7.5%) after the industrial gas maker appointed a new Chairman and CEO. Amazon.com (AMZN +2.7%) rose after the company introduced a new smartphone to challenge Apple's (AAPL +0.11%) iPhone.
Treasuries rose on the session. Benchmark 10-year notes gained 17/32 to yield 2.59%.
The CANSLIM.net Featured Stocks Page shows the most action-worthy candidates and their latest notes and a Headline Link directs members to the latest detailed analysis with data-packed graphs annotated by a Certified expert along with links to additional resources. The Premium Member Homepage includes "dynamic archives" to all prior pay reports published. Watch for an announcement via email concerning the next WEBCAST.
|
 Kenneth J. Gruneisen started out as a licensed stockbroker in August 1987, a couple of months prior to the historic stock market crash that took the Dow Jones Industrial Average down -22.6% in a single day. He has published daily fact-based fundamental and technical analysis on high-ranked stocks online for two decades. Through FACTBASEDINVESTING.COM, Kenneth provides educational articles, news, market commentary, and other information regarding proven investment systems that work in good times and bad.
Comments contained in the body of this report are technical opinions only and are not necessarily those of Gruneisen Growth Corp. The material herein has been obtained from sources believed to be reliable and accurate, however, its accuracy and completeness cannot be guaranteed. Our firm, employees, and customers may effect transactions, including transactions contrary to any recommendation herein, or have positions in the securities mentioned herein or options with respect thereto. Any recommendation contained in this report may not be suitable for all investors and it is not to be deemed an offer or solicitation on our part with respect to the purchase or sale of any securities. |
|
 |
Retail, Financial, Biotech, and Gold & Silver Indexes Rose
Kenneth J. Gruneisen - Passed the CAN SLIM® Master's Exam
The Retail Index ($RLX +1.13%) helped provide a positive influence on the major averages on Wednesday while the Broker/Dealer Index ($XBD +0.27%) and the Bank Index ($BKX +0.42%) both also edged higher. The Gold & Silver Index ($XAU +2.51%) outpaced energy-related groups as the Oil Services Index ($OSX +0.76%) and the Integrated Oil Index ($XOI +1.12%) had a positive bias. The Biotechnology Index ($BTK +0.76%) led the tech sector while there were modest losses for the Networking Index ($NWX -0.42%) and the Semiconductor Index ($SOX -0.36%).
Charts courtesy www.stockcharts.com
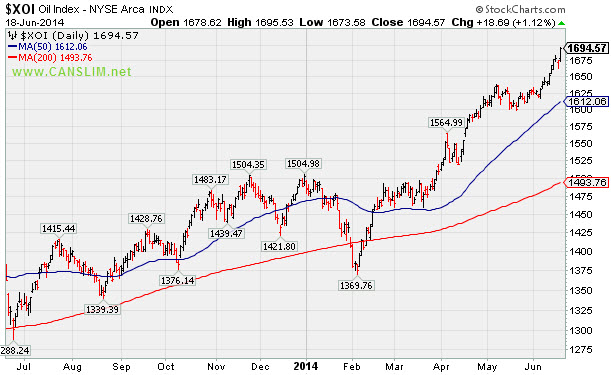
PICTURED: The Integrated Oil Index ($XOI +1.12%) hit a new 2014 high.
| Oil Services |
$OSX |
300.85 |
+2.26 |
+0.76% |
+7.05% |
| Integrated Oil |
$XOI |
1,694.57 |
+18.69 |
+1.12% |
+12.74% |
| Semiconductor |
$SOX |
633.20 |
-2.30 |
-0.36% |
+18.35% |
| Networking |
$NWX |
338.37 |
-1.42 |
-0.42% |
+4.45% |
| Broker/Dealer |
$XBD |
161.06 |
+0.43 |
+0.27% |
+0.31% |
| Retail |
$RLX |
894.51 |
+10.02 |
+1.13% |
-4.82% |
| Gold & Silver |
$XAU |
94.71 |
+2.32 |
+2.51% |
+12.55% |
| Bank |
$BKX |
71.39 |
+0.30 |
+0.42% |
+3.08% |
| Biotech |
$BTK |
2,726.98 |
+20.63 |
+0.76% |
+17.02% |
|
|
|
 |
Found Support Above Prior Highs During Consolidation
Kenneth J. Gruneisen - Passed the CAN SLIM® Master's Exam
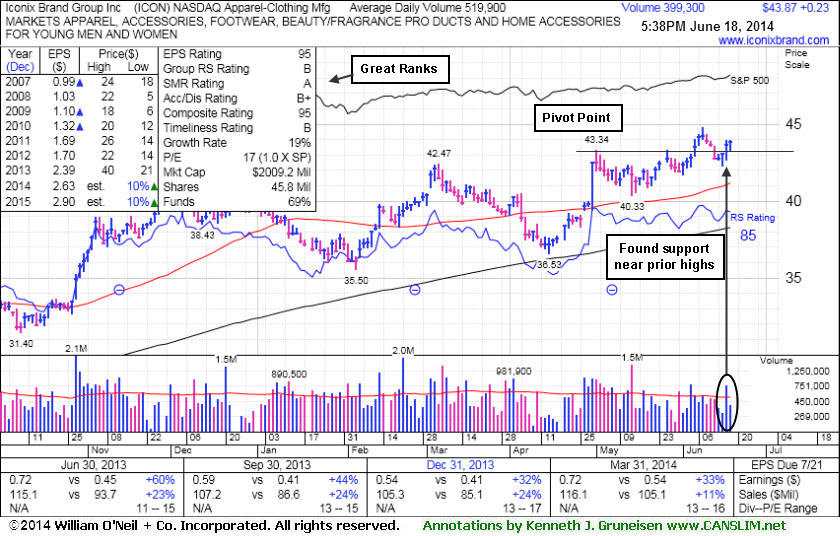
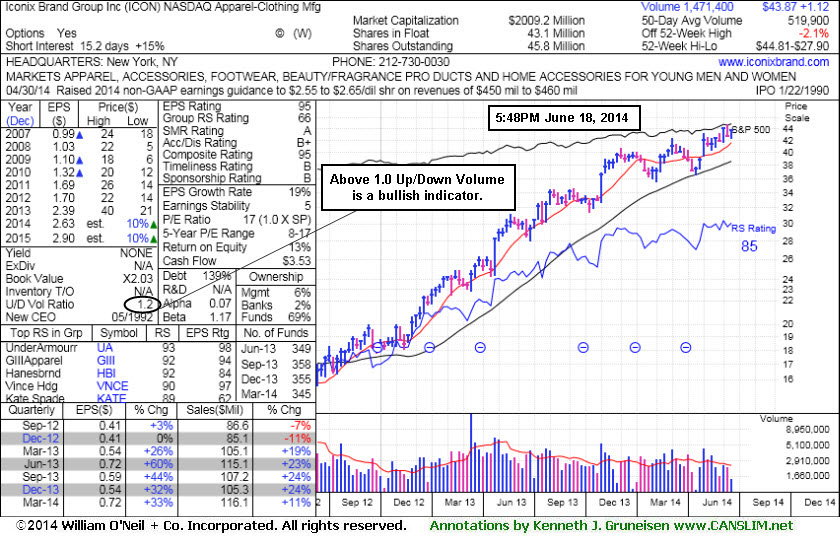
Iconix Brand Group Inc (ICON +$0.23 or +0.54% to $43.87) has made little headway following its recent technical breakout. It found support with a gain on heavy volume on 6/17/14 while consolidating above prior highs in the $43-42 area defining initial support to watch. The stock was last shown in this FSU section on 6/05/14 with annotated graphs under the headline, "Gain With Above Average Volume an Encouraging Sign "as it hit new all-time highs with gains backed by above average volume and triggered a new (or add-on) technical buy signal. It had stalled after rallying above prior high in the $42 area before, and the gain through $43 and $44 marked its first volume-backed gain above its previously cited pivot point.
Its 50-day moving average (DMA) line defines near-term support below its prior highs. A violation of that short-term average or would raise serious concerns and trigger a more worrisome technical sell signal. Disciplined investors avoid chasing stocks extended more than +5% above their pivot point, and they always sell if any stock falls more than -7% from their purchase price. Keep in mind that 3 out of 4 stocks tend to move in the same direction of the major averages (M criteria) and the broader market is strong.
It reported earnings +33% on +11% sales revenues for the Mar '14 quarter, continuing its streak of earning increases above the +25% minimum guideline (C criteria). Fundamentals remain strong for the high-ranked Apparel - Clothing Manufacturing firm. Its annual earnings (A criteria) history has been steady. It has earned a 95 Earnings Per Share Rating (EPS) which suggests that its recent earnings growth history has been stellar. Its Relative Strength rating is 85, above the 80+ minimum rank for buy candidates under the fact-based system. The number of top-rated funds owning its shares fell from 359 in Sep '13 to 345 in Mar '14, not a reassuring sign concerning the I criteria.
|
|
|
Color Codes Explained :
Y - Better candidates highlighted by our
staff of experts.
G - Previously featured
in past reports as yellow but may no longer be buyable under the
guidelines.
***Last / Change / Volume data in this table is the closing quote data***
Symbol/Exchange
Company Name
Industry Group |
PRICE |
CHANGE
(%Change) |
Day High |
Volume
(% DAV)
(% 50 day avg vol) |
52 Wk Hi
% From Hi |
Featured
Date |
Price
Featured |
Pivot Featured |
|
Max Buy |
AFSI
-
NASDAQ
Amtrust Financial Svcs
INSURANCE - Property and; Casualty Insurance
|
$42.45
|
-0.04
-0.09% |
$42.56
|
416,280
62.88% of 50 DAV
50 DAV is 662,000
|
$47.10
-9.87%
|
5/21/2014
|
$44.85
|
PP = $44.85
|
|
MB = $47.09
|
Most Recent Note - 6/13/2014 5:13:01 PM
G - Volume totals have been cooling while consolidating above its 50 DMA line which acted as support. Disciplined investors always limit losses by selling any stock that falls more than -7% from their purchase price.
>>> FEATURED STOCK ARTICLE : Halted Slide at 50-Day Moving Average After Distributional Pressure - 6/6/2014
View all notes |
Set NEW NOTE alert |
CANSLIM.net Company Profile |
SEC
News |
Chart |
Request a new note
C
A N
S L
I M


|
AL
-
NYSE
Air Lease Corp Cl A
DIVERSIFIED SERVICES - Rental and Leasing Services
|
$38.77
|
+0.58
1.52% |
$38.82
|
1,083,985
104.23% of 50 DAV
50 DAV is 1,040,000
|
$42.89
-9.61%
|
5/9/2014
|
$38.27
|
PP = $38.25
|
|
MB = $40.16
|
Most Recent Note - 6/13/2014 12:05:54 PM
G - Rebounded from early lows back into positive territory. On the prior session its 50 DMA line violation triggered a technical sell signal as it suffered a damaging loss backed by heavy volume amid widespread losses in the industry group. Only a prompt rebound above its 50 DMA line would help its outlook improve. Disciplined investors limit losses by selling any stock that falls more than -7% from their purchase price.
>>> FEATURED STOCK ARTICLE : Enduring Mild Distributional Pressure on Pullback - 6/11/2014
View all notes |
Set NEW NOTE alert |
CANSLIM.net Company Profile |
SEC
News |
Chart |
Request a new note
C
A N
S L
I M
|
EQM
-
NYSE
E Q T Midstream Partners
ENERGY - Oil and Gas Pipelines
|
$91.63
|
-1.53
-1.64% |
$94.72
|
786,798
271.31% of 50 DAV
50 DAV is 290,000
|
$97.22
-5.75%
|
12/12/2013
|
$53.17
|
PP = $56.51
|
|
MB = $59.34
|
 Most Recent Note - 6/18/2014 12:04:44 PM
G - Retreating from its 52-week high with above average volume behind its 2nd consecutive loss. Prior reports repeatedly cautioned members - "It is very extended from any sound base. Fundamental concerns remain after 2 consecutive sub par quarters below the +25% minimum earnings guideline."
>>> FEATURED STOCK ARTICLE : New Highs Again With Light Volume Behind Streak of Gains - 6/4/2014
View all notes |
Set NEW NOTE alert |
CANSLIM.net Company Profile |
SEC
News |
Chart |
Request a new note
C
A N
S L
I M
|
GRFS
-
NASDAQ
Grifols Sa Ads
Medical-Ethical Drugs
|
$45.74
|
+0.39
0.86% |
$45.92
|
420,620
61.86% of 50 DAV
50 DAV is 680,000
|
$46.66
-1.97%
|
5/15/2014
|
$41.14
|
PP = $43.55
|
|
MB = $45.73
|
Most Recent Note - 6/17/2014 5:53:44 PM
Y - Volume totals have been cooling while consolidating below its "max buy" level following technical breakout. Prior highs near $43 area define near-term support to watch on pullbacks. See the latest FSU analysis for more details and new annotated graphs.
>>> FEATURED STOCK ARTICLE : Consolidating Just Below "Max Buy" Level - 6/17/2014
View all notes |
Set NEW NOTE alert |
CANSLIM.net Company Profile |
SEC
News |
Chart |
Request a new note
C
A N
S L
I M
|
ICON
-
NASDAQ
Iconix Brand Group Inc
CONSUMER NON-DURABLES - Textile - Apparel Footwear
|
$43.87
|
+0.24
0.54% |
$43.99
|
399,392
76.95% of 50 DAV
50 DAV is 519,000
|
$44.81
-2.10%
|
6/5/2014
|
$43.54
|
PP = $43.44
|
|
MB = $45.61
|
Most Recent Note - 6/18/2014 6:30:51 PM
Y - Stalled following its recent technical breakout and it is consolidating above prior highs in the $43-42 area defining initial support to watch. See the latest FSU analysis for more details and new annotated graphs.
>>> FEATURED STOCK ARTICLE : Found Support Above Prior Highs During Consolidation - 6/18/2014
View all notes |
Set NEW NOTE alert |
CANSLIM.net Company Profile |
SEC
News |
Chart |
Request a new note
C
A N
S L
I M
|
Symbol/Exchange
Company Name
Industry Group |
PRICE |
CHANGE
(%Change) |
Day High |
Volume
(% DAV)
(% 50 day avg vol) |
52 Wk Hi
% From Hi |
Featured
Date |
Price
Featured |
Pivot Featured |
|
Max Buy |
KORS
-
NYSE
Michael Kors Hldgs Ltd
RETAIL - Apparel Stores
|
$90.82
|
-0.24
-0.26% |
$91.63
|
3,184,056
110.35% of 50 DAV
50 DAV is 2,885,500
|
$101.04
-10.11%
|
5/27/2014
|
$96.70
|
PP = $101.14
|
|
MB = $106.20
|
Most Recent Note - 6/17/2014 5:58:05 PM
G - Managed an impressive "positive reversal" today after initially slumping well below its 50 DMA line following a damaging loss on the prior session that triggered a technical sell signal. Only a prompt rebound about the 50 DMA line would help its outlook improve.
>>> FEATURED STOCK ARTICLE : Relative Strength Line's Downward Slope a Discouraging Sign - 6/10/2014
View all notes |
Set NEW NOTE alert |
CANSLIM.net Company Profile |
SEC
News |
Chart |
Request a new note
C
A N
S L
I M
|
PANW
-
NYSE
Palo Alto Networks
Computer Sftwr-Security
|
$80.50
|
-0.16
-0.20% |
$81.36
|
1,267,129
65.72% of 50 DAV
50 DAV is 1,928,000
|
$82.27
-2.15%
|
5/29/2014
|
$75.95
|
PP = $72.50
|
|
MB = $76.13
|
Most Recent Note - 6/16/2014 5:54:47 PM
G - Finished at a best-ever close with near average volume behind today's 5th consecutive gain. Prior highs near $72 define important support above its 50 DMA line.
>>> FEATURED STOCK ARTICLE : Encountered Distributional Pressure After Touching New 52-Week High - 6/12/2014
View all notes |
Set NEW NOTE alert |
CANSLIM.net Company Profile |
SEC
News |
Chart |
Request a new note
C
A N
S L
I M
|
SN
-
NYSE
Sanchez Energy Corp
ENERGY - Independent Oil and Gas
|
$37.01
|
+0.22
0.60% |
$37.23
|
892,891
63.51% of 50 DAV
50 DAV is 1,406,000
|
$37.00
0.03%
|
5/22/2014
|
$33.00
|
PP = $31.59
|
|
MB = $33.17
|
Most Recent Note - 6/13/2014 12:49:07 PM
G - Perched at its 52-week high today, extended from its prior base. Disciplined investors avoid chasing extended stocks. Prior highs near $31-32 define support to watch on pullbacks. Priced the recently announced offering of Common Stock and Senior Notes.
>>> FEATURED STOCK ARTICLE : Finished Near Session Low After Hitting new 52-Week High - 6/9/2014
View all notes |
Set NEW NOTE alert |
CANSLIM.net Company Profile |
SEC
News |
Chart |
Request a new note
C
A N
S L
I M
|
TRN
-
NYSE
Trinity Industries Inc
TRANSPORTATION - Railroads
|
$85.01
|
+1.11
1.32% |
$85.12
|
1,073,475
67.47% of 50 DAV
50 DAV is 1,591,000
|
$87.89
-3.27%
|
4/30/2014
|
$75.57
|
PP = $76.05
|
|
MB = $79.85
|
Most Recent Note - 6/16/2014 5:58:03 PM
G - Gapped up today for a solid gain and finished near the session high following 4 consecutive losses. Prior highs in the $76 area and its 50 DMA line ($77.79) define important support to watch.
>>> FEATURED STOCK ARTICLE : Recent Lows and 50-Day Moving Average Line Define Near-Term Support - 6/16/2014
View all notes |
Set NEW NOTE alert |
CANSLIM.net Company Profile |
SEC
News |
Chart |
Request a new note
C
A N
S L
I M
|
WLK
-
NYSE
Westlake Chemical Corp
CHEMICALS - Specialty Chemicals
|
$83.75
|
+0.92
1.11% |
$83.79
|
380,153
51.86% of 50 DAV
50 DAV is 733,000
|
$83.17
0.70%
|
4/29/2014
|
$72.79
|
PP = $69.31
|
|
MB = $72.78
|
Most Recent Note - 6/13/2014 5:56:43 PM
G - Quietly hovering near its 52-week high. Prior highs near $77 define important near-term support to watch on pullbacks. See the latest FSU analysis for more details and new annotated graphs.
>>> FEATURED STOCK ARTICLE : Chemical Firm Quietly Posted 7th Consecutive Weekly Gain - 6/13/2014
View all notes |
Set NEW NOTE alert |
CANSLIM.net Company Profile |
SEC
News |
Chart |
Request a new note
C
A N
S L
I M
|
Symbol/Exchange
Company Name
Industry Group |
PRICE |
CHANGE
(%Change) |
Day High |
Volume
(% DAV)
(% 50 day avg vol) |
52 Wk Hi
% From Hi |
Featured
Date |
Price
Featured |
Pivot Featured |
|
Max Buy |
|
|
|
THESE ARE NOT BUY RECOMMENDATIONS!
Comments contained in the body of this report are technical
opinions only. The material herein has been obtained
from sources believed to be reliable and accurate, however,
its accuracy and completeness cannot be guaranteed.
This site is not an investment advisor, hence it does
not endorse or recommend any securities or other investments.
Any recommendation contained in this report may not
be suitable for all investors and it is not to be deemed
an offer or solicitation on our part with respect to
the purchase or sale of any securities. All trademarks,
service marks and trade names appearing in this report
are the property of their respective owners, and are
likewise used for identification purposes only.
This report is a service available
only to active Paid Premium Members.
You may opt-out of receiving report notifications
at any time. Questions or comments may be submitted
by writing to Premium Membership Services 665 S.E. 10 Street, Suite 201 Deerfield Beach, FL 33441-5634 or by calling 1-800-965-8307
or 954-785-1121.
|
|
|

