You are not logged in.
This means you
CAN ONLY VIEW reports that were published prior to Monday, April 14, 2025.
You
MUST UPGRADE YOUR MEMBERSHIP if you want to see any current reports.
AFTER MARKET UPDATE - MONDAY, JUNE 2ND, 2014
Previous After Market Report Next After Market Report >>>
|
|
|
|
DOW |
+26.46 |
16,743.63 |
+0.16% |
|
Volume |
536,596,870 |
-41% |
|
Volume |
1,514,856,090 |
-11% |
|
NASDAQ |
-5.42 |
4,237.20 |
-0.13% |
|
Advancers |
1,443 |
45% |
|
Advancers |
1,033 |
36% |
|
S&P 500 |
+1.40 |
1,924.97 |
+0.07% |
|
Decliners |
1,593 |
50% |
|
Decliners |
1,730 |
60% |
|
Russell 2000 |
-5.60 |
1,128.90 |
-0.49% |
|
52 Wk Highs |
224 |
|
|
52 Wk Highs |
72 |
|
|
S&P 600 |
-1.96 |
651.05 |
-0.30% |
|
52 Wk Lows |
26 |
|
|
52 Wk Lows |
26 |
|
|
 |
Major Averages Had Mixed Session With Lighter Volume Totals
Kenneth J. Gruneisen - Passed the CAN SLIM® Master's Exam
The major averages were mixed and little changed on Monday's session. The volume was reported lighter than the prior session totals on the NYSE and on the Nasdaq exchange. Decliners led advancers by an 8-7 margin on the NYSE and by more than a 3-2 margin on the Nasdaq exchange. There were 64 high-ranked companies from the CANSLIM.net Leaders List that made new 52-week highs and appeared on the CANSLIM.net BreakOuts Page, up from the total of 52 stocks on the prior session. New 52-week highs easily outnumbered new 52-week lows on the NYSE and on the Nasdaq exchange. There were gains for 5 of the 10 high-ranked companies currently included on the Featured Stocks Page.
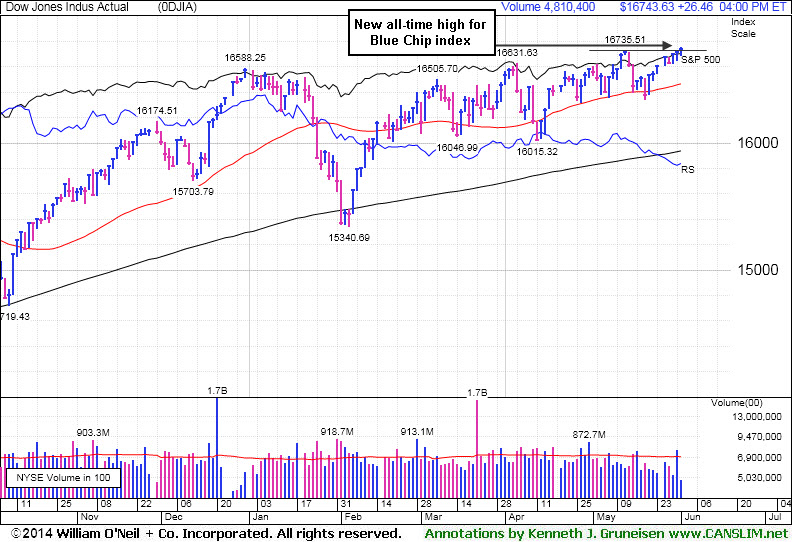
PICTURED: The Dow Jones Industrial Average finished at a new all-time high. The Blue Chip index is up +1% year-to-date. Many individual issues have managed more substantial rallies in recent weeks. The latest surge into new high territory coupled with an expansion in leadership (new 52-week highs) helped signal that the market direction (M criteria) is in a "confirmed uptrend". Any new buying efforts should be selective and focused in stocks meeting all key criteria of the fact-based investment system.
The major averages finished mostly higher on the first trading day of June as investors weighed data on the U.S. economy. This morning’s update by the Institute for Supply Management was later corrected to show U.S. manufacturing activity expanded at a faster pace in May. Another release revealed construction spending rose 0.2% in April, less than a projected 0.6% increase.
In M&A news, ARC Healthcare (HCT +9.65%) after Ventas (VTR -2.80%) said it would buy the company for $2.6 billion. Protective Life (PL +11.87%) rallied amid reports it is in talks to be acquired by Japan's second largest life insurer.
Materials and industrials were the best performing groups as Dow Chemical (DOW +0.75%) and Caterpillar (CAT +1.50%) rose. Technology was down the most on the session as Apple (AAPL -0.69%) fell after unveiling new mobile software at its annual World Developers Conference.
Treasuries were lower with the 10-year note down 14/32 to yield 2.53%.
The CANSLIM.net Featured Stocks Page shows the most action-worthy candidates and their latest notes and a Headline Link directs members to the latest detailed analysis with data-packed graphs annotated by a Certified expert along with links to additional resources. The Premium Member Homepage includes "dynamic archives" to all prior pay reports published. Watch for an announcement via email concerning the next WEBCAST.
|
 Kenneth J. Gruneisen started out as a licensed stockbroker in August 1987, a couple of months prior to the historic stock market crash that took the Dow Jones Industrial Average down -22.6% in a single day. He has published daily fact-based fundamental and technical analysis on high-ranked stocks online for two decades. Through FACTBASEDINVESTING.COM, Kenneth provides educational articles, news, market commentary, and other information regarding proven investment systems that work in good times and bad.
Comments contained in the body of this report are technical opinions only and are not necessarily those of Gruneisen Growth Corp. The material herein has been obtained from sources believed to be reliable and accurate, however, its accuracy and completeness cannot be guaranteed. Our firm, employees, and customers may effect transactions, including transactions contrary to any recommendation herein, or have positions in the securities mentioned herein or options with respect thereto. Any recommendation contained in this report may not be suitable for all investors and it is not to be deemed an offer or solicitation on our part with respect to the purchase or sale of any securities. |
|
 |
Bank and Semiconductor Indexes Led Group Gainers
Kenneth J. Gruneisen - Passed the CAN SLIM® Master's Exam
The Bank Index ($BKX +0.54%) was a positive influence on the major averages on Monday while the Broker/Dealer Index ($XBD +0.08%) finished flat. The Semiconductor Index ($SOX +0.54%) posted a modest gain while the Networking Index ($NWX -0.91%) and the Biotechnology Index ($BTK -0.28%) ended lower. Commodity-linked groups had a slightly negative bias while the Gold & Silver Index ($XAU -0.51%) and the Oil Services Index ($OSX -0.26%) tallied small losses. The Integrated Oil Index ($XOI -0.06%) and the Retail Index ($RLX -0.04%) both were essentially unchanged.
Charts courtesy www.stockcharts.com
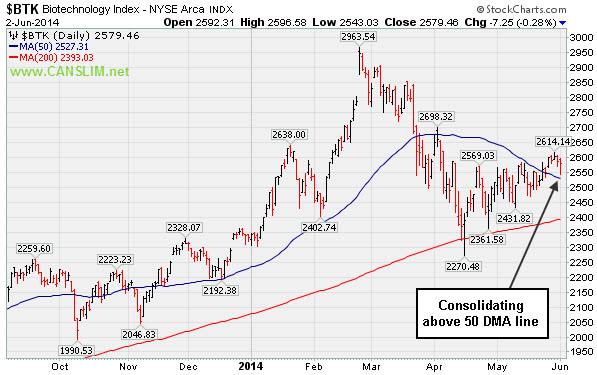
PICTURED: The Biotechnology Index ($BTK -0.28%) is consolidating above its 50-day moving average (DMA) line.
| Oil Services |
$OSX |
290.22 |
-0.76 |
-0.26% |
+3.27% |
| Integrated Oil |
$XOI |
1,626.22 |
-0.99 |
-0.06% |
+8.19% |
| Semiconductor |
$SOX |
602.84 |
+3.25 |
+0.54% |
+12.67% |
| Networking |
$NWX |
334.06 |
-3.07 |
-0.91% |
+3.12% |
| Broker/Dealer |
$XBD |
153.21 |
+0.13 |
+0.08% |
-4.58% |
| Retail |
$RLX |
877.21 |
-0.34 |
-0.04% |
-6.66% |
| Gold & Silver |
$XAU |
84.63 |
-0.43 |
-0.51% |
+0.57% |
| Bank |
$BKX |
69.28 |
+0.37 |
+0.54% |
+0.03% |
| Biotech |
$BTK |
2,579.46 |
-7.25 |
-0.28% |
+10.69% |
|
|
|
 |
Extended From Prior Base After +15% Rally in One Month
Kenneth J. Gruneisen - Passed the CAN SLIM® Master's Exam
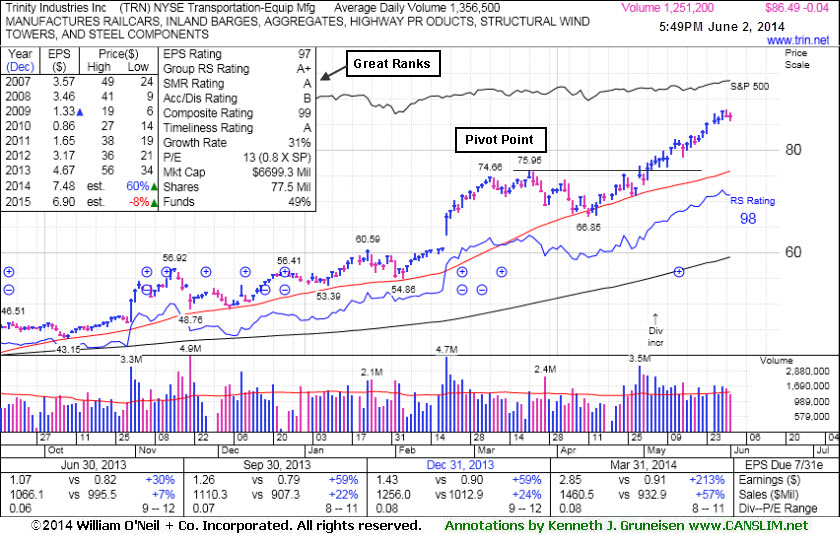
Trinity Industries Inc (TRN -$0.04 or -0.05% to $86.49) is extended from its prior base. It traded up as much as +15.57% since first highlighted in yellow in the 4/30/14 mid-day report report (read here). Disciplined investors avoid chasing stocks extended more than +5% above prior highs and they always limit losses by selling any stock that falls more than -7% from their purchase price. Prior highs in the $75-76 area define near-term support to watch on pullbacks.
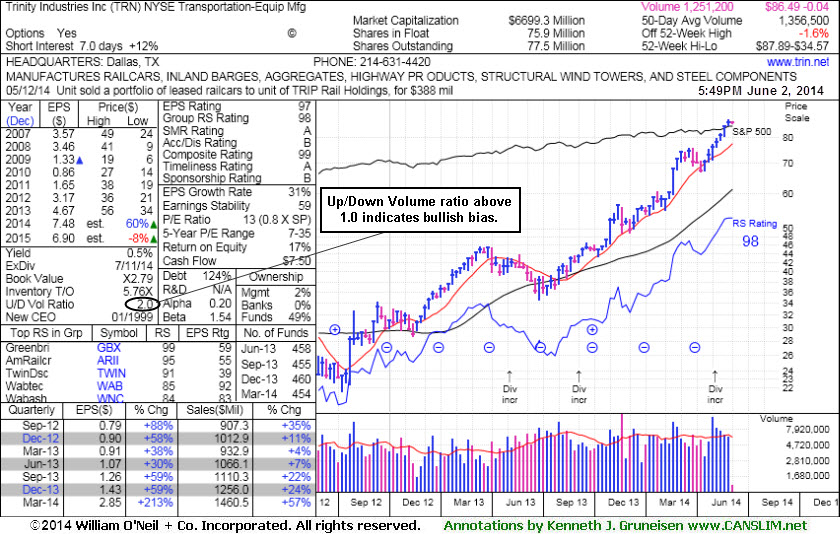
TRN was last shown in this FSU section on 5/12/14 with annotated graphs under the headline, "Rose Beyond "Max Buy" Level With 7th Consecutive Gain". The Transportation - Equipment Manufacturing firm reported earnings +213% on +57% sales revenues for the Mar '14 quarter, and prior quarterly comparisons were above the +25% minimum earnings guideline (C criteria). Annual earnings (A criteria) have improved following a downturn in FY '08-10. Its current Up/Down Volume Ratio of 2.0 is an unbiased indication that its shares have been under accumulation over the past 50 days.
|
|
|
Color Codes Explained :
Y - Better candidates highlighted by our
staff of experts.
G - Previously featured
in past reports as yellow but may no longer be buyable under the
guidelines.
***Last / Change / Volume data in this table is the closing quote data***
Symbol/Exchange
Company Name
Industry Group |
PRICE |
CHANGE
(%Change) |
Day High |
Volume
(% DAV)
(% 50 day avg vol) |
52 Wk Hi
% From Hi |
Featured
Date |
Price
Featured |
Pivot Featured |
|
Max Buy |
AFSI
-
NASDAQ
Amtrust Financial Svcs
INSURANCE - Property and; Casualty Insurance
|
$42.32
|
-0.38
-0.89% |
$42.36
|
2,993,630
480.52% of 50 DAV
50 DAV is 623,000
|
$47.10
-10.15%
|
5/21/2014
|
$44.85
|
PP = $44.85
|
|
MB = $47.09
|
 Most Recent Note - 6/2/2014 6:34:47 PM
G - Finished near the session high today after testing support at its 50 DMA line but tallied a 6th consecutive loss. Disciplined investors always limit losses by selling any stock that falls more than -7% from their purchase price.
>>> FEATURED STOCK ARTICLE : Finished Strong With Gain From Advanced Base Pattern - 5/21/2014
View all notes |
Set NEW NOTE alert |
CANSLIM.net Company Profile |
SEC
News |
Chart |
Request a new note
C
A N
S L
I M


|
AL
-
NYSE
Air Lease Corp Cl A
DIVERSIFIED SERVICES - Rental and Leasing Services
|
$41.80
|
+0.54
1.31% |
$42.05
|
1,099,853
140.29% of 50 DAV
50 DAV is 784,000
|
$41.35
1.09%
|
5/9/2014
|
$38.27
|
PP = $38.25
|
|
MB = $40.16
|
Most Recent Note - 5/29/2014 2:23:34 PM
G - Hitting another new 52-week high with today's 5th consecutive gain and its color code is changed to green while rallying beyond its "max buy" level. Prior highs near $38 acted as support during its consolidation after its latest technical breakout. See latest FSU analysis for more details and annotated graphs.
>>> FEATURED STOCK ARTICLE : Finished Near Session Low and Below "Max Buy" Level After Gain on Volume - 5/28/2014
View all notes |
Set NEW NOTE alert |
CANSLIM.net Company Profile |
SEC
News |
Chart |
Request a new note
C
A N
S L
I M
|
EQM
-
NYSE
E Q T Midstream Partners
ENERGY - Oil and Gas Pipelines
|
$83.63
|
+1.49
1.81% |
$83.79
|
154,805
64.77% of 50 DAV
50 DAV is 239,000
|
$82.90
0.88%
|
12/12/2013
|
$53.17
|
PP = $56.51
|
|
MB = $59.34
|
Most Recent Note - 5/28/2014 6:13:12 PM
G - Hit another new 52-week high today with a gain on light volume. Completed a new Public Offering of 10.75 Million common units on 5/01/14. Fundamental concerns remain after 2 consecutive sub par quarters below the +25% minimum earnings guideline. Its 50 DMA line defines near-term support where a violation may trigger a technical sell signal.
>>> FEATURED STOCK ARTICLE : Best Ever Close With Light Volume Gain - 5/16/2014
View all notes |
Set NEW NOTE alert |
CANSLIM.net Company Profile |
SEC
News |
Chart |
Request a new note
C
A N
S L
I M
|
GRFS
-
NASDAQ
Grifols Sa Ads
Medical-Ethical Drugs
|
$40.96
|
-0.66
-1.59% |
$42.25
|
805,230
133.98% of 50 DAV
50 DAV is 601,000
|
$43.50
-5.84%
|
5/15/2014
|
$41.14
|
PP = $43.55
|
|
MB = $45.73
|
Most Recent Note - 6/2/2014 12:22:09 PM
Y - Pulling back today with higher volume and it has been encountering resistance recently near prior highs. This Spanish firm from the Medical- Ethical Drugs industry needs subsequent volume-driven gains for new highs to trigger a technical buy signal.
>>> FEATURED STOCK ARTICLE : Perched Within Close Striking Distance of New Highs - 5/15/2014
View all notes |
Set NEW NOTE alert |
CANSLIM.net Company Profile |
SEC
News |
Chart |
Request a new note
C
A N
S L
I M
|
ICON
-
NASDAQ
Iconix Brand Group Inc
CONSUMER NON-DURABLES - Textile - Apparel Footwear
|
$42.40
|
+0.46
1.10% |
$42.59
|
303,237
56.05% of 50 DAV
50 DAV is 541,000
|
$43.34
-2.17%
|
4/30/2014
|
$42.50
|
PP = $42.57
|
|
MB = $44.70
|
Most Recent Note - 5/28/2014 6:15:01 PM
Y - Pulled back from its all-time high today with a small loss on lighter and well below average volume. Confirming gains above the pivot point with above average volume could trigger a new (or add-on) technical buy signal.
>>> FEATURED STOCK ARTICLE : Consolidating Above 50 DMA Line Still Perched Near 52-Week High - 5/20/2014
View all notes |
Set NEW NOTE alert |
CANSLIM.net Company Profile |
SEC
News |
Chart |
Request a new note
C
A N
S L
I M
|
Symbol/Exchange
Company Name
Industry Group |
PRICE |
CHANGE
(%Change) |
Day High |
Volume
(% DAV)
(% 50 day avg vol) |
52 Wk Hi
% From Hi |
Featured
Date |
Price
Featured |
Pivot Featured |
|
Max Buy |
KORS
-
NYSE
Michael Kors Hldgs Ltd
RETAIL - Apparel Stores
|
$94.45
|
+0.07
0.07% |
$94.75
|
2,289,425
82.74% of 50 DAV
50 DAV is 2,767,000
|
$101.04
-6.52%
|
5/27/2014
|
$96.70
|
PP = $101.14
|
|
MB = $106.20
|
Most Recent Note - 5/30/2014 12:32:48 PM
Y - Relative Strength rating has slumped to 78, below the 80+ minimum guideline for buy candidates, raising concerns. Finding support at its 50 DMA line, but deterioration below that important short-term average would raise more concerns and trigger a technical sell signal. A breakout above the pivot point with at least +40% above average volume is needed to trigger a new technical buy signal. Reported earnings +56% on +54% sales revenues for the Mar '14 quarter, and prior quarters were also well above the +25% minimum earnings guideline (C criteria). See the latest FSU analysis for more details and annotated graphs.
>>> FEATURED STOCK ARTICLE : Earnings News May Prompt Volume and Volatility - 5/27/2014
View all notes |
Set NEW NOTE alert |
CANSLIM.net Company Profile |
SEC
News |
Chart |
Request a new note
C
A N
S L
I M
|
PANW
-
NYSE
Palo Alto Networks
Computer Sftwr-Security
|
$73.69
|
-1.22
-1.63% |
$75.19
|
2,035,400
102.44% of 50 DAV
50 DAV is 1,987,000
|
$80.84
-8.84%
|
5/29/2014
|
$75.95
|
PP = $72.50
|
|
MB = $76.13
|
Most Recent Note - 5/30/2014 6:15:23 PM
Y - Today it tallied a 2nd consecutive volume-driven gain above its pivot point. Faces some remaining overhead supply through the $80 level. Highlighted in yellow in the 5/29/14 mid-day report (read here) as its gap up gain with 5 times average volume completed a bullish "double bottom" base. Prior highs near $72 define important support above its downward sloping 50 DMA line.
>>> FEATURED STOCK ARTICLE : Finish Near Session Low Following Gap Up From Double Bottom Base - 5/29/2014
View all notes |
Set NEW NOTE alert |
CANSLIM.net Company Profile |
SEC
News |
Chart |
Request a new note
C
A N
S L
I M
|
SN
-
NYSE
Sanchez Energy Corp
ENERGY - Independent Oil and Gas
|
$33.05
|
-1.38
-4.01% |
$35.50
|
2,278,352
199.86% of 50 DAV
50 DAV is 1,140,000
|
$35.28
-6.32%
|
5/22/2014
|
$33.00
|
PP = $31.59
|
|
MB = $33.17
|
Most Recent Note - 6/2/2014 12:42:59 PM
G - Reversed into the red after touching a new 52-week high today. Prior highs near $31-32 define initial support to watch on pullbacks.
>>> FEATURED STOCK ARTICLE : Finish Near Low a Sign of Distributional Pressure Following Gap Up and New High - 5/22/2014
View all notes |
Set NEW NOTE alert |
CANSLIM.net Company Profile |
SEC
News |
Chart |
Request a new note
C
A N
S L
I M
|
TRN
-
NYSE
Trinity Industries Inc
TRANSPORTATION - Railroads
|
$86.49
|
-0.04
-0.05% |
$87.23
|
1,251,258
92.28% of 50 DAV
50 DAV is 1,356,000
|
$87.89
-1.59%
|
4/30/2014
|
$75.57
|
PP = $76.05
|
|
MB = $79.85
|
Most Recent Note - 6/2/2014 6:35:41 PM
G - Extended from its prior base, it traded up as much as +15.57% since first highlighted in yellow in the 4/30/14 mid-day report. Prior highs in the $75-76 area define near-term support to watch on pullbacks. See the latest FSU analysis for more details and new annotated graphs.
>>> FEATURED STOCK ARTICLE : Extended From Prior Base After +15% Rally in One Month - 6/2/2014
View all notes |
Set NEW NOTE alert |
CANSLIM.net Company Profile |
SEC
News |
Chart |
Request a new note
C
A N
S L
I M
|
WLK
-
NYSE
Westlake Chemical Corp
CHEMICALS - Specialty Chemicals
|
$81.10
|
+0.25
0.31% |
$81.41
|
535,312
71.09% of 50 DAV
50 DAV is 753,000
|
$81.51
-0.50%
|
4/29/2014
|
$72.79
|
PP = $69.31
|
|
MB = $72.78
|
Most Recent Note - 5/30/2014 6:09:01 PM
G - Perched at its 52-week high after 5 consecutive weekly gains. Recent lows near $73 define important near-term support to watch on pullbacks. See the latest FSU analysis for more details and new annotated graphs.
>>> FEATURED STOCK ARTICLE : Extended From Prior Base After 5 Weekly Gains - 5/30/2014
View all notes |
Set NEW NOTE alert |
CANSLIM.net Company Profile |
SEC
News |
Chart |
Request a new note
C
A N
S L
I M
|
Symbol/Exchange
Company Name
Industry Group |
PRICE |
CHANGE
(%Change) |
Day High |
Volume
(% DAV)
(% 50 day avg vol) |
52 Wk Hi
% From Hi |
Featured
Date |
Price
Featured |
Pivot Featured |
|
Max Buy |
|
|
|
THESE ARE NOT BUY RECOMMENDATIONS!
Comments contained in the body of this report are technical
opinions only. The material herein has been obtained
from sources believed to be reliable and accurate, however,
its accuracy and completeness cannot be guaranteed.
This site is not an investment advisor, hence it does
not endorse or recommend any securities or other investments.
Any recommendation contained in this report may not
be suitable for all investors and it is not to be deemed
an offer or solicitation on our part with respect to
the purchase or sale of any securities. All trademarks,
service marks and trade names appearing in this report
are the property of their respective owners, and are
likewise used for identification purposes only.
This report is a service available
only to active Paid Premium Members.
You may opt-out of receiving report notifications
at any time. Questions or comments may be submitted
by writing to Premium Membership Services 665 S.E. 10 Street, Suite 201 Deerfield Beach, FL 33441-5634 or by calling 1-800-965-8307
or 954-785-1121.
|
|
|

