You are not logged in.
This means you
CAN ONLY VIEW reports that were published prior to Friday, April 11, 2025.
You
MUST UPGRADE YOUR MEMBERSHIP if you want to see any current reports.
AFTER MARKET UPDATE - FRIDAY, MAY 30TH, 2014
Previous After Market Report Next After Market Report >>>
|
|
|
|
DOW |
+18.43 |
16,717.17 |
+0.11% |
|
Volume |
902,395,480 |
+70% |
|
Volume |
1,700,122,420 |
+8% |
|
NASDAQ |
-5.33 |
4,242.62 |
-0.13% |
|
Advancers |
1,541 |
49% |
|
Advancers |
1,049 |
38% |
|
S&P 500 |
+3.54 |
1,923.57 |
+0.18% |
|
Decliners |
1,495 |
47% |
|
Decliners |
1,638 |
59% |
|
Russell 2000 |
-5.57 |
1,134.50 |
-0.49% |
|
52 Wk Highs |
183 |
|
|
52 Wk Highs |
67 |
|
|
S&P 600 |
-2.40 |
653.01 |
-0.37% |
|
52 Wk Lows |
28 |
|
|
52 Wk Lows |
27 |
|
|
 |
S&P 500 Index Finished at New All-Time High; Benchmark Up 4% YTD
Kenneth J. Gruneisen - Passed the CAN SLIM® Master's Exam
The Dow Jones Industrial Average posted an advance of +0.8% in May and the S&P 500 Index increased +2.1%, their fourth-straight month of gains. The Nasdaq Composite Index snapped a two-month losing streak with a monthly increase of +3.1%. The major averages on Friday were mixed and little changed. The volume was reported higher than the prior session totals on the NYSE and on the Nasdaq exchange. Advancers narrowly led decliners on the NYSE while decliners led advancers by a 3-2 margin on the Nasdaq exchange. There were 52 high-ranked companies from the CANSLIM.net Leaders List that made new 52-week highs and appeared on the CANSLIM.net BreakOuts Page, down from the total of 57 stocks on the prior session. New 52-week highs easily outnumbered new 52-week lows on the NYSE and on the Nasdaq exchange. There were gains for 5 of the 10 high-ranked companies currently included on the Featured Stocks Page.
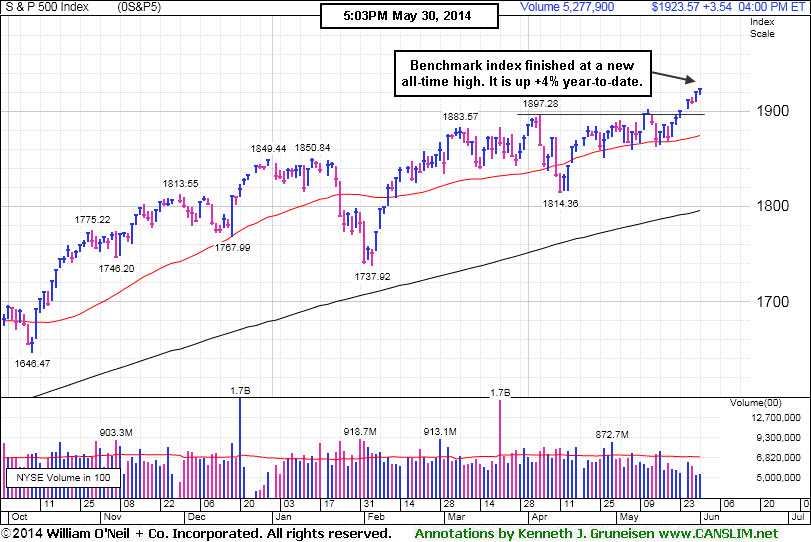
PICTURED: The S&P 500 Index finished at a new all-time high and the benchmark index is up +4% year-to-date. Many individual issues have managed more substantial rallies in recent weeks. The latest surge into new high territory coupled with an expansion in leadership (new 52-week highs) helped signal that the market direction (M criteria) is in a "confirmed uptrend". Any new buying efforts should be selective and focused in stocks meeting all key criteria of the fact-based investment system.
Overall, the major averages finished higher on the week and month yet they were little changed as investors digested a batch of mixed economic data. Consumer spending surprisingly fell in April for the first time in a year while other data showed a slowing in wages. In addition, the University of Michigan's consumer confidence survey came in below expectations. A separate report showed an unexpected jump in Chicago area business activity to a seven-month high in May.
Eight of the 10 S&P 500 sectors advanced. The defensive groups of utilities and telecommunications gained the most ground boosting Exelon (EXC +2%) and Verizon (VZ +0.5%). Materials and energy were the worst performing groups as Nucor (NUE -2.1%) and Exxon Mobil (XOM -0.7%) fell.
Treasuries took a breather from this week’s rally as the 10-year note fell 2/32 to yield 2.47%.
The CANSLIM.net Featured Stocks Page shows the most action-worthy candidates and their latest notes and a Headline Link directs members to the latest detailed analysis with data-packed graphs annotated by a Certified expert along with links to additional resources. The Premium Member Homepage includes "dynamic archives" to all prior pay reports published. Watch for an announcement via email concerning the next WEBCAST.
|
 Kenneth J. Gruneisen started out as a licensed stockbroker in August 1987, a couple of months prior to the historic stock market crash that took the Dow Jones Industrial Average down -22.6% in a single day. He has published daily fact-based fundamental and technical analysis on high-ranked stocks online for two decades. Through FACTBASEDINVESTING.COM, Kenneth provides educational articles, news, market commentary, and other information regarding proven investment systems that work in good times and bad.
Comments contained in the body of this report are technical opinions only and are not necessarily those of Gruneisen Growth Corp. The material herein has been obtained from sources believed to be reliable and accurate, however, its accuracy and completeness cannot be guaranteed. Our firm, employees, and customers may effect transactions, including transactions contrary to any recommendation herein, or have positions in the securities mentioned herein or options with respect thereto. Any recommendation contained in this report may not be suitable for all investors and it is not to be deemed an offer or solicitation on our part with respect to the purchase or sale of any securities. |
|
 |
Tech Sector Slumped Amid Mixed Group Action
Kenneth J. Gruneisen - Passed the CAN SLIM® Master's Exam
Financial shares were mixed on Friday as the Bank Index ($BKX +0.36%) posted a modest gain while the Broker/Dealer Index ($XBD -0.59%) edged lower. The Retail Index ($RLX +0.18%) eked out a small gain. The Networking Index ($NWX -1.11%) led the tech sector lower while the Biotechnology Index ($BTK -0.57%) suffered a smaller loss and the Semiconductor Index ($SOX +0.11%) inched higher. Energy-linked groups including the Integrated Oil Index ($XOI -0.11%) and the Oil Services Index ($OSX -0.02%) finished flat. The Gold & Silver Index ($XAU +0.75%) posted a small gain.
Charts courtesy www.stockcharts.com
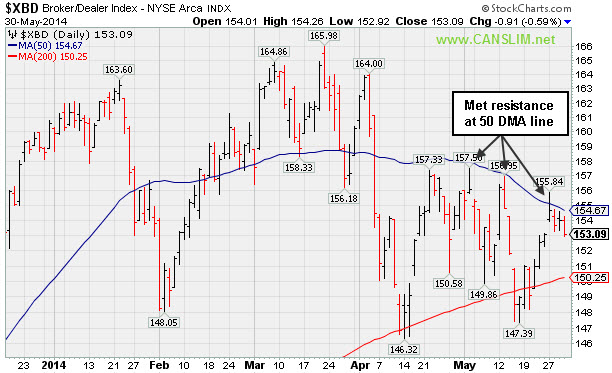
PICTURED 1: The Broker/Dealer Index ($XBD -0.59%) fell on Friday. It met resistance at its 50-day moving average (DMA) line when rebounding from support at its longer-term 200 DMA line. .
Charts courtesy www.stockcharts.com
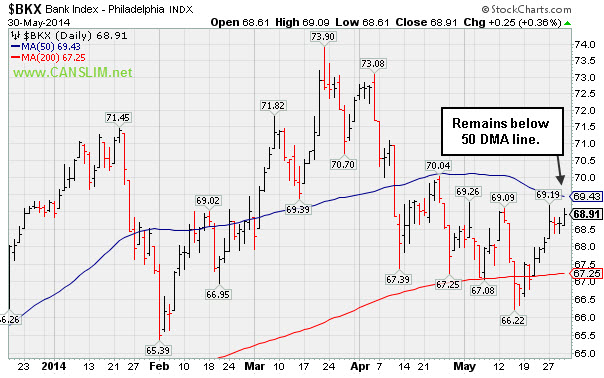
PICTURED 2: The Bank Index ($BKX +0.36%) posted a modest gain. It also remains below its 50 DMA line. Subsequent gains above that important short-term average for both of the financial indexes would be an encouraging sign for the broader market.
| Oil Services |
$OSX |
290.98 |
-0.05 |
-0.02% |
+3.54% |
| Integrated Oil |
$XOI |
1,627.21 |
-1.81 |
-0.11% |
+8.25% |
| Semiconductor |
$SOX |
599.59 |
+0.63 |
+0.11% |
+12.07% |
| Networking |
$NWX |
337.14 |
-3.80 |
-1.11% |
+4.07% |
| Broker/Dealer |
$XBD |
153.09 |
-0.91 |
-0.59% |
-4.65% |
| Retail |
$RLX |
877.55 |
+1.56 |
+0.18% |
-6.62% |
| Gold & Silver |
$XAU |
85.06 |
+0.63 |
+0.75% |
+1.08% |
| Bank |
$BKX |
68.91 |
+0.25 |
+0.36% |
-0.51% |
| Biotech |
$BTK |
2,586.71 |
-14.85 |
-0.57% |
+11.00% |
|
|
|
 |
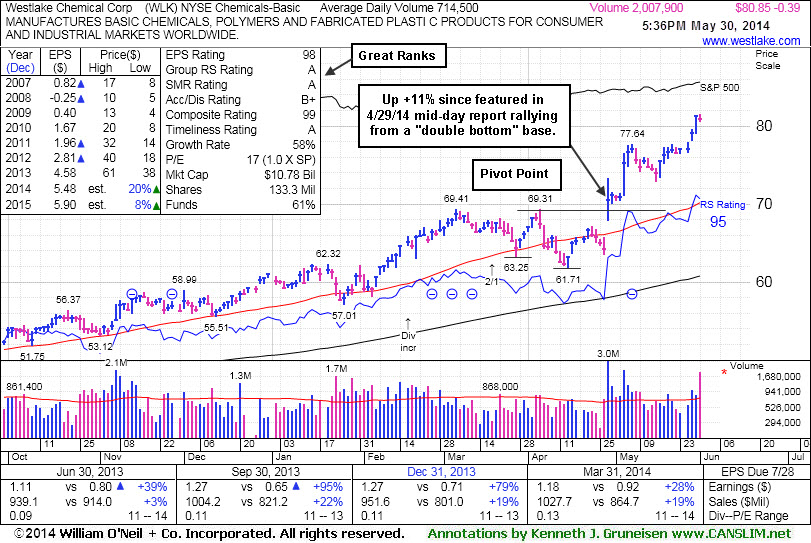
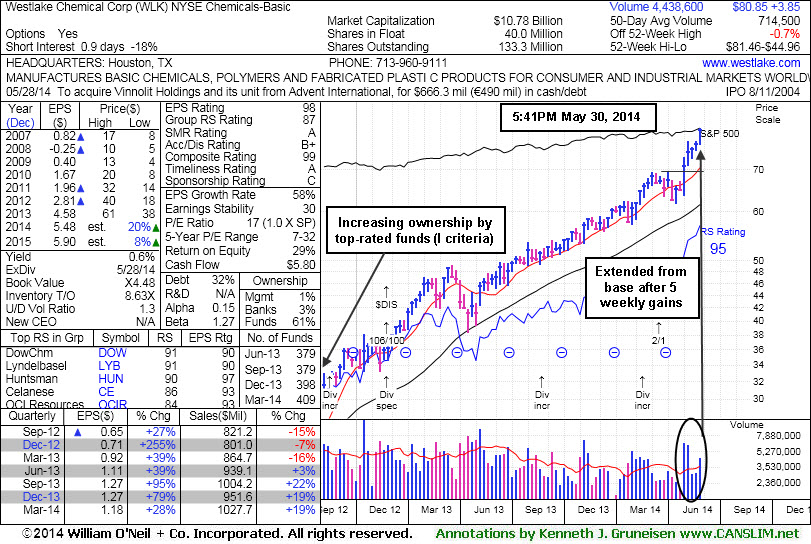
Extended From Prior Base After 5 Weekly Gains
Kenneth J. Gruneisen - Passed the CAN SLIM® Master's Exam
Westlake Chemical Corp (WLK -$0.39 or -0.48% to $80.85) is perched near a new 52-week high after 5 consecutive weekly gains. It finished Friday's session up +11% from when it was first featured in yellow at $72.79 rallying from a "double bottom" base in the 4/29/14 mid-day report (read here). The recent low ($72.84 on 5/15/14) defines important near-term support to watch on pullbacks. It was last shown in this FSU section on 5/08/14 with annotated graphs under the headline, "Extended From Base Following Volume Driven Gains", rallying above its "max buy" level +5% above its pivot point.
It reported +28% earnings on +19% sales for the Mar '14 quarter, and it has earned great ranks as its quarterly earnings increases have been above the +25% minimum (C criteria). Its annual earnings growth rate (A criteria) has also been strong after a downturn in FY '08 and '09. The number of top-rated funds owning its shares rose from 381 in Sep '13 to 409 in Mar '14, a reassuring trend concerning the I criteria. The small supply of only 40 million shares (S criteria) in the public float is ideal, while it can contribute to greater price volatility in the event of new institutional buying or selling.
The Chemicals - Basic industry group has seen its Group Relative Strength rating rise from 65 to 87 since shown in this FSU section on 4/29/14 with annotated graphs under the headline, "Technical Breakout From Double Bottom Base Pattern". Strong action and leadership from others in the group is a reassuring sign concerning the L criteria.
|
|
|
Color Codes Explained :
Y - Better candidates highlighted by our
staff of experts.
G - Previously featured
in past reports as yellow but may no longer be buyable under the
guidelines.
***Last / Change / Volume data in this table is the closing quote data***
Symbol/Exchange
Company Name
Industry Group |
PRICE |
CHANGE
(%Change) |
Day High |
Volume
(% DAV)
(% 50 day avg vol) |
52 Wk Hi
% From Hi |
Featured
Date |
Price
Featured |
Pivot Featured |
|
Max Buy |
AFSI
-
NASDAQ
Amtrust Financial Svcs
INSURANCE - Property and; Casualty Insurance
|
$42.70
|
-1.60
-3.61% |
$44.25
|
1,782,805
299.13% of 50 DAV
50 DAV is 596,000
|
$47.10
-9.34%
|
5/21/2014
|
$44.85
|
PP = $44.85
|
|
MB = $47.09
|
 Most Recent Note - 5/30/2014 3:44:51 PM
G - Color code was changed to green while pulling back with above average volume for a 5th consecutive session. Slumping back into the previously noted advanced "3-weeks tight" base and below recent lows near $42-43 raising concerns. Disciplined investors always limit losses by selling any stock that falls more than -7% from their purchase price.
>>> FEATURED STOCK ARTICLE : Finished Strong With Gain From Advanced Base Pattern - 5/21/2014
View all notes |
Set NEW NOTE alert |
CANSLIM.net Company Profile |
SEC
News |
Chart |
Request a new note
C
A N
S L
I M


|
AL
-
NYSE
Air Lease Corp Cl A
DIVERSIFIED SERVICES - Rental and Leasing Services
|
$41.26
|
+0.07
0.17% |
$41.35
|
806,177
103.36% of 50 DAV
50 DAV is 780,000
|
$41.25
0.02%
|
5/9/2014
|
$38.27
|
PP = $38.25
|
|
MB = $40.16
|
Most Recent Note - 5/29/2014 2:23:34 PM
G - Hitting another new 52-week high with today's 5th consecutive gain and its color code is changed to green while rallying beyond its "max buy" level. Prior highs near $38 acted as support during its consolidation after its latest technical breakout. See latest FSU analysis for more details and annotated graphs.
>>> FEATURED STOCK ARTICLE : Finished Near Session Low and Below "Max Buy" Level After Gain on Volume - 5/28/2014
View all notes |
Set NEW NOTE alert |
CANSLIM.net Company Profile |
SEC
News |
Chart |
Request a new note
C
A N
S L
I M
|
EQM
-
NYSE
E Q T Midstream Partners
ENERGY - Oil and Gas Pipelines
|
$82.14
|
+0.42
0.51% |
$82.44
|
127,084
53.40% of 50 DAV
50 DAV is 238,000
|
$82.90
-0.92%
|
12/12/2013
|
$53.17
|
PP = $56.51
|
|
MB = $59.34
|
Most Recent Note - 5/28/2014 6:13:12 PM
G - Hit another new 52-week high today with a gain on light volume. Completed a new Public Offering of 10.75 Million common units on 5/01/14. Fundamental concerns remain after 2 consecutive sub par quarters below the +25% minimum earnings guideline. Its 50 DMA line defines near-term support where a violation may trigger a technical sell signal.
>>> FEATURED STOCK ARTICLE : Best Ever Close With Light Volume Gain - 5/16/2014
View all notes |
Set NEW NOTE alert |
CANSLIM.net Company Profile |
SEC
News |
Chart |
Request a new note
C
A N
S L
I M
|
GRFS
-
NASDAQ
Grifols Sa Ads
Medical-Ethical Drugs
|
$41.62
|
+0.24
0.58% |
$41.80
|
285,850
47.48% of 50 DAV
50 DAV is 602,000
|
$43.50
-4.32%
|
5/15/2014
|
$41.14
|
PP = $43.55
|
|
MB = $45.73
|
Most Recent Note - 5/28/2014 6:14:10 PM
Y - Pulled back today with slightly higher volume and it has been encountering resistance at prior highs. This Spanish firm from the Medical- Ethical Drugs industry needs subsequent volume-driven gains for new highs to trigger a technical buy signal.
>>> FEATURED STOCK ARTICLE : Perched Within Close Striking Distance of New Highs - 5/15/2014
View all notes |
Set NEW NOTE alert |
CANSLIM.net Company Profile |
SEC
News |
Chart |
Request a new note
C
A N
S L
I M
|
ICON
-
NASDAQ
Iconix Brand Group Inc
CONSUMER NON-DURABLES - Textile - Apparel Footwear
|
$41.94
|
-0.23
-0.55% |
$42.47
|
635,376
118.54% of 50 DAV
50 DAV is 536,000
|
$43.34
-3.23%
|
4/30/2014
|
$42.50
|
PP = $42.57
|
|
MB = $44.70
|
Most Recent Note - 5/28/2014 6:15:01 PM
Y - Pulled back from its all-time high today with a small loss on lighter and well below average volume. Confirming gains above the pivot point with above average volume could trigger a new (or add-on) technical buy signal.
>>> FEATURED STOCK ARTICLE : Consolidating Above 50 DMA Line Still Perched Near 52-Week High - 5/20/2014
View all notes |
Set NEW NOTE alert |
CANSLIM.net Company Profile |
SEC
News |
Chart |
Request a new note
C
A N
S L
I M
|
Symbol/Exchange
Company Name
Industry Group |
PRICE |
CHANGE
(%Change) |
Day High |
Volume
(% DAV)
(% 50 day avg vol) |
52 Wk Hi
% From Hi |
Featured
Date |
Price
Featured |
Pivot Featured |
|
Max Buy |
KORS
-
NYSE
Michael Kors Hldgs Ltd
RETAIL - Apparel Stores
|
$94.38
|
+2.10
2.28% |
$95.19
|
5,580,512
205.44% of 50 DAV
50 DAV is 2,716,400
|
$101.04
-6.59%
|
5/27/2014
|
$96.70
|
PP = $101.14
|
|
MB = $106.20
|
Most Recent Note - 5/30/2014 12:32:48 PM
Y - Relative Strength rating has slumped to 78, below the 80+ minimum guideline for buy candidates, raising concerns. Finding support at its 50 DMA line, but deterioration below that important short-term average would raise more concerns and trigger a technical sell signal. A breakout above the pivot point with at least +40% above average volume is needed to trigger a new technical buy signal. Reported earnings +56% on +54% sales revenues for the Mar '14 quarter, and prior quarters were also well above the +25% minimum earnings guideline (C criteria). See the latest FSU analysis for more details and annotated graphs.
>>> FEATURED STOCK ARTICLE : Earnings News May Prompt Volume and Volatility - 5/27/2014
View all notes |
Set NEW NOTE alert |
CANSLIM.net Company Profile |
SEC
News |
Chart |
Request a new note
C
A N
S L
I M
|
PANW
-
NYSE
Palo Alto Networks
Computer Sftwr-Security
|
$74.91
|
+1.74
2.38% |
$76.85
|
3,461,310
178.69% of 50 DAV
50 DAV is 1,937,000
|
$80.84
-7.34%
|
5/29/2014
|
$75.95
|
PP = $72.50
|
|
MB = $76.13
|
Most Recent Note - 5/30/2014 6:15:23 PM
Y - Today it tallied a 2nd consecutive volume-driven gain above its pivot point. Faces some remaining overhead supply through the $80 level. Highlighted in yellow in the 5/29/14 mid-day report (read here) as its gap up gain with 5 times average volume completed a bullish "double bottom" base. Prior highs near $72 define important support above its downward sloping 50 DMA line.
>>> FEATURED STOCK ARTICLE : Finish Near Session Low Following Gap Up From Double Bottom Base - 5/29/2014
View all notes |
Set NEW NOTE alert |
CANSLIM.net Company Profile |
SEC
News |
Chart |
Request a new note
C
A N
S L
I M
|
SN
-
NYSE
Sanchez Energy Corp
ENERGY - Independent Oil and Gas
|
$34.43
|
-0.62
-1.77% |
$35.07
|
1,666,203
149.17% of 50 DAV
50 DAV is 1,117,000
|
$35.28
-2.41%
|
5/22/2014
|
$33.00
|
PP = $31.59
|
|
MB = $33.17
|
Most Recent Note - 5/29/2014 12:51:10 PM
G - Hitting another new 52-week high with today's 3rd consecutive gain, getting extended from its prior base. Disciplined investors avoid chasing extended stocks. Prior highs near $31-32 define initial support to watch on pullbacks.
>>> FEATURED STOCK ARTICLE : Finish Near Low a Sign of Distributional Pressure Following Gap Up and New High - 5/22/2014
View all notes |
Set NEW NOTE alert |
CANSLIM.net Company Profile |
SEC
News |
Chart |
Request a new note
C
A N
S L
I M
|
TRN
-
NYSE
Trinity Industries Inc
TRANSPORTATION - Railroads
|
$86.53
|
-0.95
-1.09% |
$87.89
|
1,573,341
117.24% of 50 DAV
50 DAV is 1,342,000
|
$87.65
-1.28%
|
4/30/2014
|
$75.57
|
PP = $76.05
|
|
MB = $79.85
|
Most Recent Note - 5/30/2014 6:05:55 PM
G - Pulled back today following a streak of 6 consecutive gains. Extended from its prior base, it traded up as much as +15.57% since first highlighted in yellow in the 4/30/14 mid-day report. Prior highs in the $75-76 area define near-term support to watch on pullbacks.
>>> FEATURED STOCK ARTICLE : Rose Beyond "Max Buy" Level With 7th Consecutive Gain - 5/12/2014
View all notes |
Set NEW NOTE alert |
CANSLIM.net Company Profile |
SEC
News |
Chart |
Request a new note
C
A N
S L
I M
|
WLK
-
NYSE
Westlake Chemical Corp
CHEMICALS - Specialty Chemicals
|
$80.85
|
-0.39
-0.48% |
$81.51
|
2,249,335
315.03% of 50 DAV
50 DAV is 714,000
|
$81.46
-0.75%
|
4/29/2014
|
$72.79
|
PP = $69.31
|
|
MB = $72.78
|
Most Recent Note - 5/30/2014 6:09:01 PM
G - Perched at its 52-week high after 5 consecutive weekly gains. Recent lows near $73 define important near-term support to watch on pullbacks. See the latest FSU analysis for more details and new annotated graphs.
>>> FEATURED STOCK ARTICLE : Extended From Prior Base Follow 5 Weekly Gains - 5/30/2014
View all notes |
Set NEW NOTE alert |
CANSLIM.net Company Profile |
SEC
News |
Chart |
Request a new note
C
A N
S L
I M
|
Symbol/Exchange
Company Name
Industry Group |
PRICE |
CHANGE
(%Change) |
Day High |
Volume
(% DAV)
(% 50 day avg vol) |
52 Wk Hi
% From Hi |
Featured
Date |
Price
Featured |
Pivot Featured |
|
Max Buy |
|
|
|
THESE ARE NOT BUY RECOMMENDATIONS!
Comments contained in the body of this report are technical
opinions only. The material herein has been obtained
from sources believed to be reliable and accurate, however,
its accuracy and completeness cannot be guaranteed.
This site is not an investment advisor, hence it does
not endorse or recommend any securities or other investments.
Any recommendation contained in this report may not
be suitable for all investors and it is not to be deemed
an offer or solicitation on our part with respect to
the purchase or sale of any securities. All trademarks,
service marks and trade names appearing in this report
are the property of their respective owners, and are
likewise used for identification purposes only.
This report is a service available
only to active Paid Premium Members.
You may opt-out of receiving report notifications
at any time. Questions or comments may be submitted
by writing to Premium Membership Services 665 S.E. 10 Street, Suite 201 Deerfield Beach, FL 33441-5634 or by calling 1-800-965-8307
or 954-785-1121.
|
|
|

