You are not logged in.
This means you
CAN ONLY VIEW reports that were published prior to Monday, April 14, 2025.
You
MUST UPGRADE YOUR MEMBERSHIP if you want to see any current reports.
AFTER MARKET UPDATE - TUESDAY, JUNE 1ST, 2010
Previous After Market Report Next After Market Report >>>
|
|
|
|
DOW |
-112.61 |
10,024.02 |
-1.11% |
|
Volume |
1,432,264,480 |
-2% |
|
Volume |
2,070,213,010 |
-0% |
|
NASDAQ |
-34.71 |
2,222.33 |
-1.54% |
|
Advancers |
647 |
21% |
|
Advancers |
483 |
17% |
|
S&P 500 |
-18.70 |
1,070.71 |
-1.72% |
|
Decliners |
2,422 |
77% |
|
Decliners |
2,237 |
80% |
|
Russell 2000 |
-20.65 |
640.96 |
-3.12% |
|
52 Wk Highs |
29 |
|
|
52 Wk Highs |
31 |
|
|
S&P 600 |
-10.21 |
343.10 |
-2.89% |
|
52 Wk Lows |
37 |
|
|
52 Wk Lows |
63 |
|
|
 |
Decliners Trounce Advancers After Holiday
Adam Sarhan, Contributing Writer,
The major averages traded between positive and negative territory and finished lower as investors digested the latest round stronger than expected economic data. On Tuesday, the volume totals in the US markets were reported very near Friday's pre-holiday session totals on the NYSE and on the Nasdaq exchange. Decliners led advancers by almost a 4-to-1 ratio on the NYSE and over a 4-to-1 ratio on the Nasdaq exchange. There were 5 high-ranked companies from the CANSLIM.net Leaders List that made a new 52-week high and appeared on the CANSLIM.net BreakOuts Page, lower than the 12 issues that appeared on the prior session. New 52-week lows outnumbered new 52-week highs on the NYSE and on the Nasdaq exchange.
The major averages opened lower, turned positive, then closed in the red as the bears overpowered the bulls on the first trading day of this holiday-shortened trading week. A slew of financial and energy stocks tumbled after BP Amoco PLC (BP -14.85%) said that they were not able to stop the leak in the Gulf of Mexico. BP gapped down on monstrous volume and hit a fresh one-year low after news spread that the earliest they will be able to plug the leak will be August. In other news, the ISM manufacturing index topped estimates and the euro plunged to a fresh 2010 low which reiterated fears that the ongoing contagion woes will worsen.
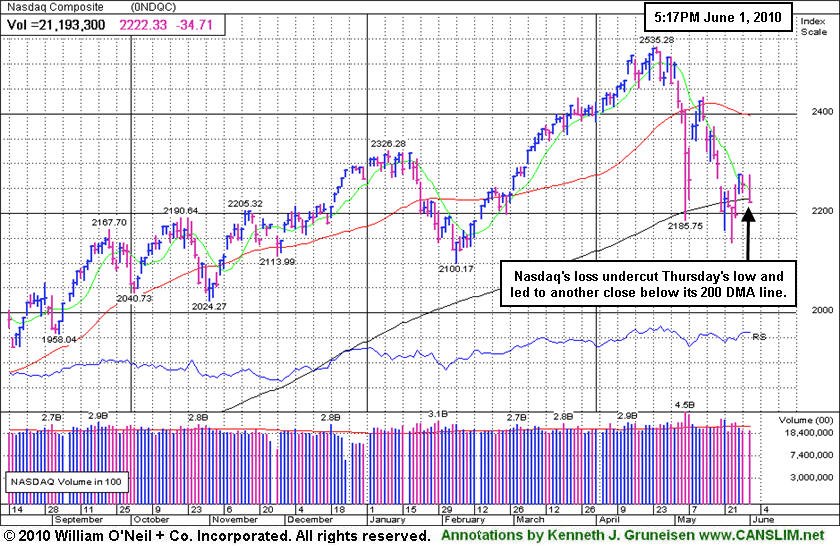
Monday's weakness pressured the Nasdaq Composite Index below last Thursday's lows, which resets the day count for that index. Meanwhile, the Dow Jones Industrial Average just ended Day 3 of a new rally attempt which opens the window for a proper follow-through day to emerge. Elsewhere, as long last Tuesday's low (1,040) is not breached in the S&P 500 Index the window remains open for a proper FTD to occur. However, if at anytime last Tuesday's lows are breached in the S&P 500 Index, then the day count will be reset. What does all of this mean for investors? Simple, the market remains in a correction which reiterates the importance of adopting a strong defense stance until a new rally is confirmed. Trade accordingly.
Professional Money Management Services - Free Portfolio Review:
If your portfolio is greater than $100,000 and you would like a free portfolio review, click here to get connected with one of our portfolio managers. ** Serious inquires only, please.
PICTURED: The Nasdaq Composite Index's loss undercut last Thursday's lows, which resets the day count for that index. It also slumped below its 200-day moving average (DMA) line again.
|
|
|
 |
Energy-Related Shares Led Widespread Group Losses
Kenneth J. Gruneisen - Passed the CAN SLIM® Master's Exam
Energy-related shares were smacked with large losses as the Oil Services Index ($OSX -7.51%) and Integrated Oil Index ($XOI -5.13%) were standout decliners on Tuesday. The technology sector faced pressure as the Networking Index ($NWX -3.73%), Semiconductor Index ($SOX -2.26%), Internet Index ($IIX -2.10%), and Biotechnology Index ($BTK -1.40%) ended unanimously lower. Weakness in the influential financial groups also weighed on the major averages as the Bank Index ($BKX -2.58%) and Broker/Dealer Index ($XBD -2.26%) slumped. The widespread weakness pushed the Retail Index ($RLX -1.39%) lower, meanwhile the Healthcare Index ($HMO -1.10%) and Gold & Silver Index ($XAU -0.52%) offered "safe haven" investors no great rewards.
Charts courtesy www.stockcharts.com
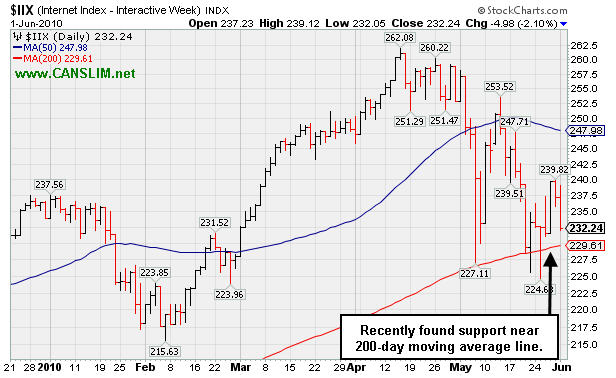
PICTURED: The Internet Index ($IIX -2.10%) recently found encouraging support near its 200-day moving average line. Leadership from innovative new companies in the tech sector has been a key factor in past bull markets, so any additional technical damage to the Internet Index's chart would be considered a bad sign for growth oriented investors.
| Oil Services |
$OSX |
159.12 |
-12.92 |
-7.51% |
-18.37% |
| Healthcare |
$HMO |
1,462.73 |
-16.27 |
-1.10% |
-0.69% |
| Integrated Oil |
$XOI |
914.09 |
-49.40 |
-5.13% |
-14.43% |
| Semiconductor |
$SOX |
347.61 |
-8.05 |
-2.26% |
-3.42% |
| Networking |
$NWX |
232.61 |
-9.01 |
-3.73% |
+0.67% |
| Internet |
$IIX |
232.24 |
-4.98 |
-2.10% |
-0.69% |
| Broker/Dealer |
$XBD |
106.17 |
-2.46 |
-2.26% |
-7.72% |
| Retail |
$RLX |
437.28 |
-6.17 |
-1.39% |
+6.36% |
| Gold & Silver |
$XAU |
173.02 |
-0.91 |
-0.52% |
+2.84% |
| Bank |
$BKX |
48.65 |
-1.29 |
-2.58% |
+13.91% |
| Biotech |
$BTK |
1,037.24 |
-14.77 |
-1.40% |
+10.09% |
|
|
|
 |
Consolidation After Considerable Rally For Internet Content Firm
Kenneth J. Gruneisen - Passed the CAN SLIM® Master's Exam
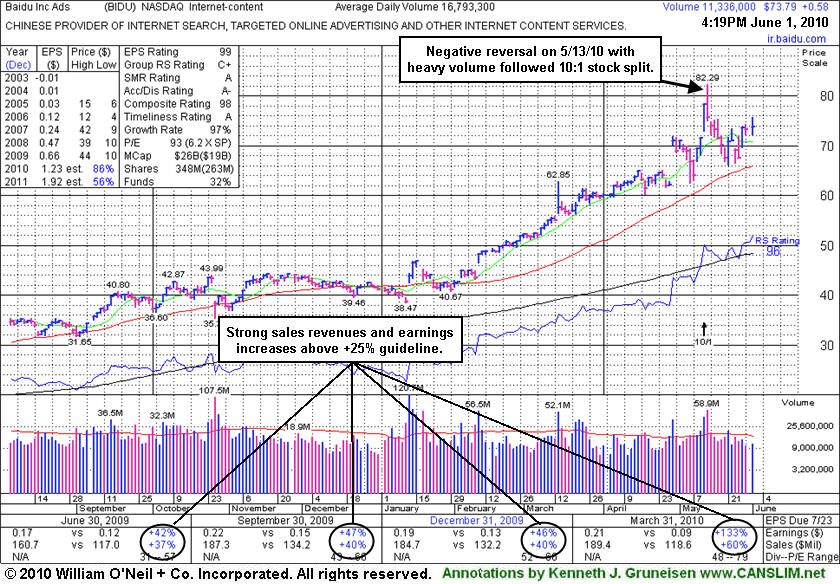
Baidu.com, Inc. (BIDU +$0.35 or +0.48% to $73.56) posted a small gain on light volume today, and volume was also below average behind its 5/27/10 gap up gain. It is extended from any sound base, consolidating above its 50-day moving average (DMA) line and recent chart lows in the $66 area that define near-term support to watch. More time is needed to see if a proper new base may form and offer investors another ideal entry point.
A worrisome negative reversal from its all-time high on 5/13/10 followed a 10:1 stock split. The recent split reduced the share price and greatly increased the supply of shares outstanding. The high-ranked Internet- Content firm saw a slight decline in the number of top-rated funds owning shares from 204 in Dec '09 to 196 in Mar '10. It still has a stellar sales and earnings history that satisfies the C & A criteria, in fact, the quarter ended March 31, 2010 showed sales revenues and earnings growth accelerating impressively. The current market (M criteria) conditions have been calling for investors to lock in gains and raise cash. Until a follow-through-day from one of the major indices confirms a new rally great caution is advised, as the current market correction could last longer and cause more technical damage.
BIDU has traded up more than 8-fold, but it has not been a smooth ride since it first featured on Monday, October 30, 2006 in the CANSLIM.net Mid Day Breakouts Report (read here). After making great progress it went through a multi-month consolidation under its 50 and 20 DMA lines, then later returned as a noteworthy leader featured in CANSLIM.net reports. An annotated graph showed a vivid picture at the beginning of the stock's period of greatest weakness back on January 11, 2008 under the headline, "Weakness Hurting Chances For Featured Favorite" (read here). Take a look back at that now! Remember that a dropped stock can be featured again in a future CANSLIM.net report if it repairs its technical damage and forms a new pivot point.
|
|
|
Color Codes Explained :
Y - Better candidates highlighted by our
staff of experts.
G - Previously featured
in past reports as yellow but may no longer be buyable under the
guidelines.
***Last / Change / Volume data in this table is the closing quote data***
Symbol/Exchange
Company Name
Industry Group |
PRICE |
CHANGE
(%Change) |
Day High |
Volume
(% DAV)
(% 50 day avg vol) |
52 Wk Hi
% From Hi |
Featured
Date |
Price
Featured |
Pivot Featured |
|
Max Buy |
BIDU
-
NASDAQ
Baidu Inc Ads
INTERNET - Internet Information Providers
|
$73.56
|
+0.35
0.48% |
$75.60
|
11,872,923
70.70% of 50 DAV
50 DAV is 16,793,300
|
$82.29
-10.61%
|
1/13/2010
|
$43.13
|
PP = $42.68
|
|
MB = $44.81
|
 Most Recent Note - 6/1/2010 3:55:03 PM
G - Gain on light volume today, and volume was below average behind its 5/27/10 gap up gain. It is extended from any sound base, consolidating above its 50 DMA line. A worrisome negative reversal from its all-time high on 5/13/10 followed a 10:1 stock split.
>>> The latest Featured Stock Update with an annotated graph appeared on 6/1/2010. Click here.
View all notes |
Alert me of new notes |
CANSLIM.net Company Profile |
SEC |
Zacks Reports |
StockTalk |
News |
Chart |
Request a new note
C
A N
S L
I M


|
BRLI
-
NASDAQ
Bio Reference Labs Inc
HEALTH SERVICES - Medical Laboratories and Researc
|
$22.50
|
-0.37
-1.62% |
$23.25
|
213,418
112.09% of 50 DAV
50 DAV is 190,400
|
$24.67
-8.81%
|
2/12/2010
|
$39.02
|
PP = $20.49
|
|
MB = $21.51
|
Most Recent Note - 6/1/2010 3:57:19 PM
G - Slumping just under its 50 DMA line, quietly consolidating within -8% of its all-time high.
>>> The latest Featured Stock Update with an annotated graph appeared on 5/26/2010. Click here.
View all notes |
Alert me of new notes |
CANSLIM.net Company Profile |
SEC |
Zacks Reports |
StockTalk |
News |
Chart |
Request a new note
C
A N
S L
I M
|
CRM
-
NYSE
Salesforce.Com Inc
INTERNET - Internet Software and Services
|
$84.89
|
-1.64
-1.90% |
$86.97
|
2,100,516
98.91% of 50 DAV
50 DAV is 2,123,600
|
$89.84
-5.51%
|
3/5/2010
|
$72.28
|
PP = $75.53
|
|
MB = $79.31
|
Most Recent Note - 6/1/2010 3:59:37 PM
G - Holding its ground quietly, just -4% from its all-time high. Recent gains including its positive reversal on 5/21/10 are signs of institutional support recently showing up near its 50 DMA line. For the quarter ended April 30, 2010 it showed only a +7% earnings per share increase, marking its first increase below the +25% minimum guideline in years.
>>> The latest Featured Stock Update with an annotated graph appeared on 5/17/2010. Click here.
View all notes |
Alert me of new notes |
CANSLIM.net Company Profile |
SEC |
Zacks Reports |
StockTalk |
News |
Chart |
Request a new note
C
A N
S L
I M
|
LL
-
NYSE
Lumber Liquidators Hldgs
RETAIL - Home Improvement Stores
|
$28.66
|
-0.85
-2.88% |
$29.44
|
213,279
57.99% of 50 DAV
50 DAV is 367,800
|
$33.41
-14.22%
|
4/22/2010
|
$29.87
|
PP = $29.03
|
|
MB = $30.48
|
Most Recent Note - 6/1/2010 4:02:28 PM
G - Consolidating near its 50 DMA line and December '09 highs, -13% off its 52-week high, it faces some near-term resistance. It has been quietly consolidating since its "negative reversal" after hitting an all-time high on 4/26/10 was noted.
>>> The latest Featured Stock Update with an annotated graph appeared on 5/19/2010. Click here.
View all notes |
Alert me of new notes |
CANSLIM.net Company Profile |
SEC |
Zacks Reports |
StockTalk |
News |
Chart |
Request a new note
C
A N
S L
I M
|
LOPE
-
NASDAQ
Grand Canyon Education
DIVERSIFIED SERVICES - Education and; Training Services
|
$24.72
|
+0.16
0.65% |
$25.22
|
300,532
69.63% of 50 DAV
50 DAV is 431,600
|
$28.46
-13.14%
|
4/13/2010
|
$27.71
|
PP = $27.33
|
|
MB = $28.70
|
Most Recent Note - 6/1/2010 4:04:01 PM
G - Small gain on light volume today after heavy distributional pressure last week led to a close below its 50 DMA line which is now acting as a resistance level. Now -13% off its 52-week high, it has been consolidating for a 7-week period since peaking on 4/13/10. Technically, its 4/29/10 low of $23.66 is the next important chart support.
>>> The latest Featured Stock Update with an annotated graph appeared on 5/27/2010. Click here.
View all notes |
Alert me of new notes |
CANSLIM.net Company Profile |
SEC |
Zacks Reports |
StockTalk |
News |
Chart |
Request a new note
C
A N
S L
I M
|
Symbol/Exchange
Company Name
Industry Group |
PRICE |
CHANGE
(%Change) |
Day High |
Volume
(% DAV)
(% 50 day avg vol) |
52 Wk Hi
% From Hi |
Featured
Date |
Price
Featured |
Pivot Featured |
|
Max Buy |
MELI
-
NASDAQ
Mercadolibre Inc
INTERNET - Internet Software and; Services
|
$50.99
|
-0.88
-1.70% |
$52.39
|
767,958
120.39% of 50 DAV
50 DAV is 637,900
|
$55.75
-8.54%
|
5/13/2010
|
$54.21
|
PP = $55.85
|
|
MB = $58.64
|
Most Recent Note - 6/1/2010 4:08:19 PM
G - Consolidating above its 50 DMA line and perched only -8% off its 52-week high. Its 200 DMA and recent lows define important near-term chart support.
>>> The latest Featured Stock Update with an annotated graph appeared on 5/28/2010. Click here.
View all notes |
Alert me of new notes |
CANSLIM.net Company Profile |
SEC |
Zacks Reports |
StockTalk |
News |
Chart |
Request a new note
C
A N
S L
I M
|
ROVI
-
NASDAQ
Rovi Corp
COMPUTER SOFTWARE andamp; SERVICES - Security Software andamp; Services
|
$37.11
|
-0.23
-0.62% |
$37.61
|
1,432,875
111.91% of 50 DAV
50 DAV is 1,280,400
|
$40.06
-7.36%
|
4/20/2010
|
$37.62
|
PP = $38.60
|
|
MB = $40.53
|
Most Recent Note - 6/1/2010 4:10:15 PM
G - Hovering just under its 50 DMA line which has acted as resistance. Consolidating just -7% from its 52-week high after 3 down weeks with above average volume in the past 4 weeks. Its recent chart low (5/25/10 low $35.09) defines near-term chart support above its 200 DMA line.
>>> The latest Featured Stock Update with an annotated graph appeared on 5/24/2010. Click here.
View all notes |
Alert me of new notes |
CANSLIM.net Company Profile |
SEC |
Zacks Reports |
StockTalk |
News |
Chart |
Request a new note
C
A N
S L
I M
|
SUMR
-
NASDAQ
Summer Infant Inc
CONSUMER NON-DURABLES - Personal Products
|
$8.10
|
-0.15
-1.82% |
$8.38
|
233,936
379.15% of 50 DAV
50 DAV is 61,700
|
$8.42
-3.80%
|
5/4/2010
|
$6.85
|
PP = $7.09
|
|
MB = $7.44
|
Most Recent Note - 6/1/2010 4:12:36 PM
G - Down today with above average volume, pulling back after a considerable gain with heavy volume on 5/28/10 for a new all-time high. Now extended from a sound base.
>>> The latest Featured Stock Update with an annotated graph appeared on 5/21/2010. Click here.
View all notes |
Alert me of new notes |
CANSLIM.net Company Profile |
SEC |
Zacks Reports |
StockTalk |
News |
Chart |
Request a new note
C
A N
S L
I M
|
ULTA
-
NASDAQ
Ulta Salon Cosm & Frag
SPECIALTY RETAIL - Specialty Retail, Other
|
$24.75
|
-0.83
-3.24% |
$25.98
|
486,845
125.73% of 50 DAV
50 DAV is 387,200
|
$26.00
-4.81%
|
5/28/2010
|
$25.58
|
PP = $25.86
|
|
MB = $27.15
|
Most Recent Note - 6/1/2010 4:14:32 PM
Y - Down today with slightly above average volume, closing below its pivot point. Color code was changed to yellow with new pivot point cited based on its 4/26/10 high plus ten cents.
>>> The latest Featured Stock Update with an annotated graph appeared on 5/20/2010. Click here.
View all notes |
Alert me of new notes |
CANSLIM.net Company Profile |
SEC |
Zacks Reports |
StockTalk |
News |
Chart |
Request a new note
C
A N
S L
I M
|
|
|
|
THESE ARE NOT BUY RECOMMENDATIONS!
Comments contained in the body of this report are technical
opinions only. The material herein has been obtained
from sources believed to be reliable and accurate, however,
its accuracy and completeness cannot be guaranteed.
This site is not an investment advisor, hence it does
not endorse or recommend any securities or other investments.
Any recommendation contained in this report may not
be suitable for all investors and it is not to be deemed
an offer or solicitation on our part with respect to
the purchase or sale of any securities. All trademarks,
service marks and trade names appearing in this report
are the property of their respective owners, and are
likewise used for identification purposes only.
This report is a service available
only to active Paid Premium Members.
You may opt-out of receiving report notifications
at any time. Questions or comments may be submitted
by writing to Premium Membership Services 665 S.E. 10 Street, Suite 201 Deerfield Beach, FL 33441-5634 or by calling 1-800-965-8307
or 954-785-1121.
|
|
|


