You are not logged in.
This means you
CAN ONLY VIEW reports that were published prior to Tuesday, April 15, 2025.
You
MUST UPGRADE YOUR MEMBERSHIP if you want to see any current reports.
AFTER MARKET UPDATE - WEDNESDAY, JUNE 2ND, 2010
Previous After Market Report Next After Market Report >>>
|
|
|
|
DOW |
+225.52 |
10,249.54 |
+2.25% |
|
Volume |
1,350,824,190 |
-6% |
|
Volume |
2,094,567,010 |
+1% |
|
NASDAQ |
+58.74 |
2,281.07 |
+2.64% |
|
Advancers |
2,594 |
82% |
|
Advancers |
2,180 |
78% |
|
S&P 500 |
+27.67 |
1,098.38 |
+2.58% |
|
Decliners |
473 |
15% |
|
Decliners |
541 |
19% |
|
Russell 2000 |
+19.56 |
660.52 |
+3.05% |
|
52 Wk Highs |
34 |
|
|
52 Wk Highs |
25 |
|
|
S&P 600 |
+9.53 |
352.63 |
+2.78% |
|
52 Wk Lows |
20 |
|
|
52 Wk Lows |
67 |
|
|
 |
Encouraging Gains Lacked Volume Needed To Confirm New Rally
Adam Sarhan, Contributing Writer,
The major averages rallied smartly on Wednesday after a stronger than expected report from the ailing housing sector. Volume totals in the US markets were reported mixed compared to Tuesday's totals; higher on the Nasdaq and lower on the NYSE. Advancers trumped decliners by over a 5-to-1 ratio on the NYSE and a 4-to-1 ratio on the Nasdaq exchange. There were 10 high-ranked companies from the CANSLIM.net Leaders List that made a new 52-week high and appeared on the CANSLIM.net BreakOuts Page, higher than the 5 issues that appeared on the prior session. New 52-week highs outnumbered new 52-week lows on the NYSE but trailed new highs on the Nasdaq exchange.
Overnight, the Japanese Prime Minister Yukio Hatoyama resigned from office ahead of the forthcoming election. His surprise resignation sent the yen plunging against 15 major currencies. In the US, pending home sales jumped to their highest level since October as buyers took advantage of the now expired tax credit. Elsewhere, Bank of America's (BAC +2.98%) Chief Executive Officer, Brian Moynihan, reassured investors when he said that he sees "more than hopeful signs" on loan demand. Billionaire investor, Warren Buffett, spent part of his day testifying before the Financial Crisis Inquiry Committee (FCIC) and defended the credit agencies.
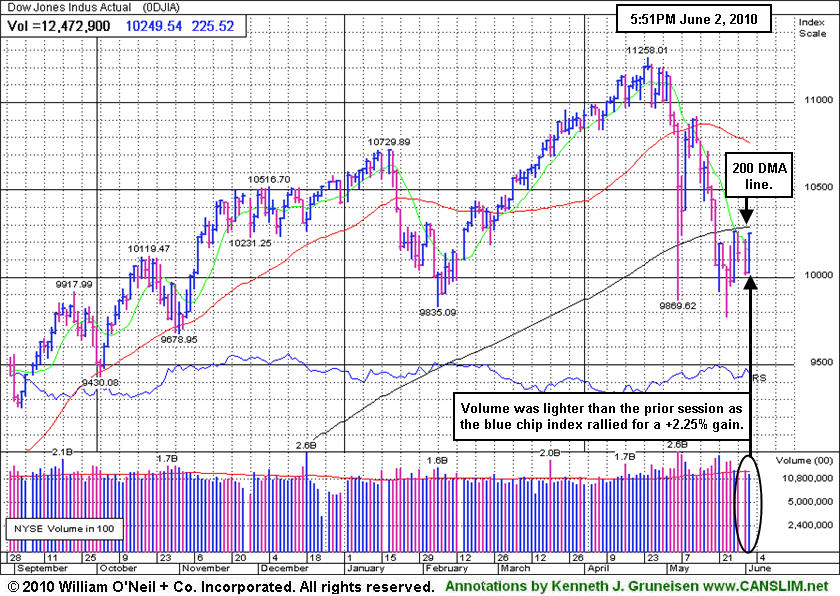
Wednesday marked Day 1 of a new rally attempt for the tech-heavy Nasdaq composite. It is important to note that the window is now open for a proper follow-through-day (FTD) to emerge for the benchmark S&P 500 and the Dow Jones Industrial Average. Even though, both indexes enjoyed strong gains today, volume, a critical indicator of institutional sponsorship, was lighter on the NYSE than the prior day's total which prevented a proper FTD from emerging.
Remember, in order for a proper FTD to emerge, we need to see three events occur anytime after Day 4 of a new rally attempt: a gain of at least +1.7% in one of the major averages, volume must be heavier than the prior session, and a new batch of high-ranked leaders must hit new highs and trigger fresh technical buy signals. What does all of this mean for investors? Simple, the market remains in a correction which reiterates the importance of adopting a strong defense stance until a new rally is confirmed. Trade accordingly.
Professional Money Management Services - Free Portfolio Review:
If your portfolio is greater than $100,000 and you would like a free portfolio review, click here to get connected with one of our portfolio managers. ** Serious inquires only, please.
PICTURED: The Dow Jones Industrial Average posted a +2.25% gain on lighter volume, and it remains trading below its longer-term 200-day moving average line.
|
|
|
 |
Energy, Tech, and Financial Shares Post Solid Gains
Kenneth J. Gruneisen - Passed the CAN SLIM® Master's Exam
Energy-related shares rebounded and the Oil Services Index ($OSX +5.51%) and Integrated Oil Index ($XOI +3.22%) posted big gains on Wednesday. The tech sector saw unanimous gains from the Biotechnology Index ($BTK +3.54%), Semiconductor Index ($SOX +3.62%), Networking Index ($NWX +2.61%), and Internet Index ($IIX +2.63%). Defensive groups also charged higher as the Gold & Silver Index ($XAU +2.32%) and Healthcare Index ($HMO +2.97%) posted solid gains.
The influential Retail Index ($RLX +1.52%) and financial shares also rose, repairing the prior session's losses, as the Bank Index ($BKX +3.25%) and Broker/Dealer Index ($XBD +2.96%) each made an important stand and bounced. Both financial indexes were studied in closer detail under my column's headline "Financial Indexes Deserve Respect And Close Monitoring" in the just published June 2010 issue of CANSLIM.net News (read here).
Charts courtesy www.stockcharts.com
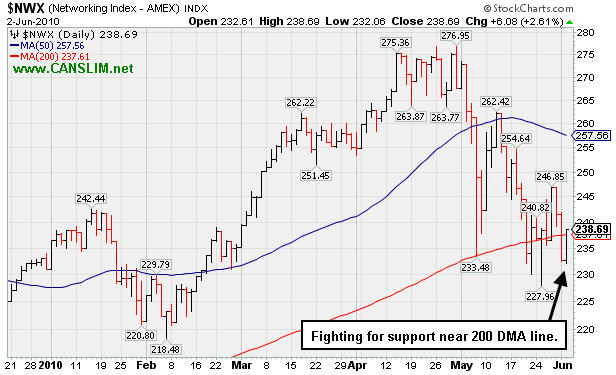
PICTURED: The Networking Index ($NWX +2.61%) has recently been fighting near its 200-day moving average (DMA) line for support.
| Oil Services |
$OSX |
167.89 |
+8.77 |
+5.51% |
-13.87% |
| Healthcare |
$HMO |
1,506.20 |
+43.48 |
+2.97% |
+2.26% |
| Integrated Oil |
$XOI |
943.53 |
+29.45 |
+3.22% |
-11.67% |
| Semiconductor |
$SOX |
360.20 |
+12.59 |
+3.62% |
+0.08% |
| Networking |
$NWX |
238.69 |
+6.08 |
+2.61% |
+3.30% |
| Internet |
$IIX |
238.36 |
+6.11 |
+2.63% |
+1.92% |
| Broker/Dealer |
$XBD |
109.31 |
+3.14 |
+2.96% |
-4.99% |
| Retail |
$RLX |
443.93 |
+6.65 |
+1.52% |
+7.98% |
| Gold & Silver |
$XAU |
177.03 |
+4.01 |
+2.32% |
+5.22% |
| Bank |
$BKX |
50.23 |
+1.58 |
+3.25% |
+17.61% |
| Biotech |
$BTK |
1,073.93 |
+36.69 |
+3.54% |
+13.99% |
|
|
|
 |
Strength Continues Following Difficult Quarterly Comparison
Kenneth J. Gruneisen - Passed the CAN SLIM® Master's Exam
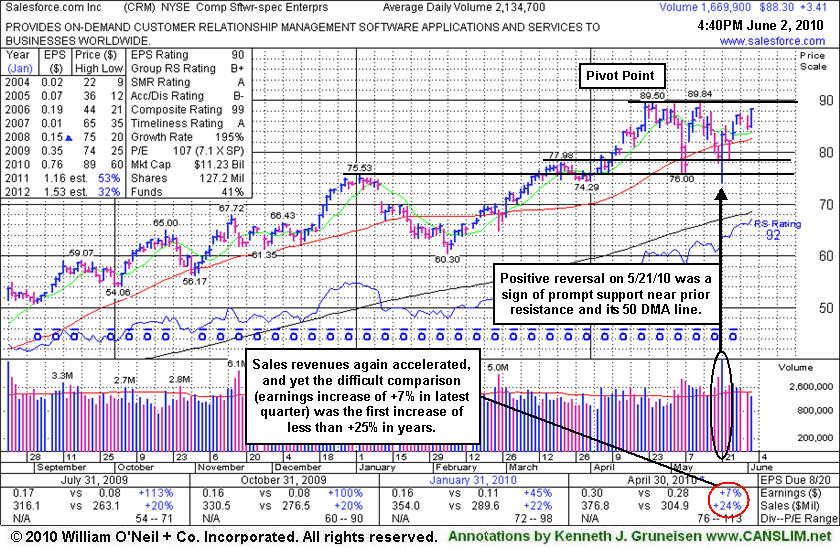
Salesforce.com, Inc. (CRM +$3.55 or +4.18% to $88.44) posted a gain today as it quietly closed just -1.6% from its all-time high. Its color code was changed to yellow with new pivot point cited based on its 4/26/10 high plus ten cents. Recent gains including its positive reversal on 5/21/10 are signs of institutional support recently showing up near its 50-day moving average (DMA) line and prior highs. For the quarter ended April 30, 2010 it showed only a +7% earnings per share increase, a difficult comparison marking its first increase below the +25% minimum guideline in years, raising some concern even while sales revenues again showed mild acceleration.
It has been consolidating since a negative reversal after briefly reaching a new all-time high on 5/13/10. The increase in institutional (I criteria) ownership has been encouraging in the past, however the number of top-rated funds owning its shares fell from 325 in Dec '09 to 310 in Mar '10. Market conditions (M criteria) remain questionable after today's follow-through-day (FTD) of meaningful gains from the major averages unfortunately lacked the necessary expansion in volume while there were also very few new leaders hitting new 52-week highs helping to confirm a healthier market environment for stock investors. Some more encouraging signs that institutional buying demand is picking up would be a welcome reassurance to see in the days ahead.
New (or add-on) buying efforts might be considered appropriate if the market gets a solid FTD and this high-ranked Computer Software - Enterprise firm eventually triggers a new technical buy signal with a gain and close above its latest pivot backed by heavy volume more than +50% above average. CRM traded up +87.69% since featured in a Stock Bulletin on 8/16/09 under the headline "Forces Have Been Favorable For Software Services Firm."
|
|
|
Color Codes Explained :
Y - Better candidates highlighted by our
staff of experts.
G - Previously featured
in past reports as yellow but may no longer be buyable under the
guidelines.
***Last / Change / Volume data in this table is the closing quote data***
Symbol/Exchange
Company Name
Industry Group |
PRICE |
CHANGE
(%Change) |
Day High |
Volume
(% DAV)
(% 50 day avg vol) |
52 Wk Hi
% From Hi |
Featured
Date |
Price
Featured |
Pivot Featured |
|
Max Buy |
BIDU
-
NASDAQ
Baidu Inc Ads
INTERNET - Internet Information Providers
|
$75.98
|
+2.42
3.29% |
$76.00
|
9,396,116
56.43% of 50 DAV
50 DAV is 16,651,500
|
$82.29
-7.67%
|
1/13/2010
|
$43.13
|
PP = $42.68
|
|
MB = $44.81
|
 Most Recent Note - 6/2/2010 4:11:34 PM
G - Gain on light volume today for its 3rd highest close ever, and volume was below average behind recent gains including its 5/27/10 gap up gain. It is extended from any sound base, consolidating above its 50 DMA line. A worrisome negative reversal from its all-time high on 5/13/10 followed a 10:1 stock split.
>>> The latest Featured Stock Update with an annotated graph appeared on 6/1/2010. Click here.
View all notes |
Alert me of new notes |
CANSLIM.net Company Profile |
SEC |
Zacks Reports |
StockTalk |
News |
Chart |
Request a new note
C
A N
S L
I M


|
BRLI
-
NASDAQ
Bio Reference Labs Inc
HEALTH SERVICES - Medical Laboratories and Researc
|
$23.09
|
+0.59
2.62% |
$23.23
|
319,529
167.12% of 50 DAV
50 DAV is 191,200
|
$24.67
-6.42%
|
2/12/2010
|
$39.02
|
PP = $20.49
|
|
MB = $21.51
|
Most Recent Note - 6/2/2010 4:16:55 PM
G - Gain today with higher volume helped it rally above its 50 DMA line, closing within -6.4% of its all-time high. It reported sales revenues and earnings increases near the +25% minimum guideline for the latest quarter ended April 30, 2010 versus the year ago period. Consolidating for about 6 weeks since a 2:1 stock split effective on 4/22/10.
>>> The latest Featured Stock Update with an annotated graph appeared on 5/26/2010. Click here.
View all notes |
Alert me of new notes |
CANSLIM.net Company Profile |
SEC |
Zacks Reports |
StockTalk |
News |
Chart |
Request a new note
C
A N
S L
I M
|
CRM
-
NYSE
Salesforce.Com Inc
INTERNET - Internet Software and Services
|
$88.44
|
+3.55
4.18% |
$88.44
|
1,865,317
87.38% of 50 DAV
50 DAV is 2,134,700
|
$89.84
-1.56%
|
6/2/2010
|
$88.44
|
PP = $89.60
|
|
MB = $94.08
|
Most Recent Note - 6/2/2010 4:35:57 PM
Y - Holding its ground quietly, just -1.6% from its all-time high. Color code is changed to yellow with new pivot point cited. Recent gains including its positive reversal on 5/21/10 are signs of institutional support recently showing up near its 50 DMA line and prior highs. For the quarter ended April 30, 2010 it showed only a +7% earnings per share increase, a difficult comparison marking its first increase below the +25% minimum guideline in years.
>>> The latest Featured Stock Update with an annotated graph appeared on 6/2/2010. Click here.
View all notes |
Alert me of new notes |
CANSLIM.net Company Profile |
SEC |
Zacks Reports |
StockTalk |
News |
Chart |
Request a new note
C
A N
S L
I M
|
LL
-
NYSE
Lumber Liquidators Hldgs
RETAIL - Home Improvement Stores
|
$29.25
|
+0.59
2.06% |
$29.27
|
243,194
67.29% of 50 DAV
50 DAV is 361,400
|
$33.41
-12.45%
|
4/22/2010
|
$29.87
|
PP = $29.03
|
|
MB = $30.48
|
Most Recent Note - 6/2/2010 4:38:23 PM
G - Overcame early weakness below its 50 DMA line and December '09 highs today, closing near the session high with a gain. Still -12.5% off its 52-week high, it faces some near-term resistance. It has been quietly consolidating since its "negative reversal" after hitting an all-time high on 4/26/10 was noted.
>>> The latest Featured Stock Update with an annotated graph appeared on 5/19/2010. Click here.
View all notes |
Alert me of new notes |
CANSLIM.net Company Profile |
SEC |
Zacks Reports |
StockTalk |
News |
Chart |
Request a new note
C
A N
S L
I M
|
LOPE
-
NASDAQ
Grand Canyon Education
DIVERSIFIED SERVICES - Education and; Training Services
|
$25.04
|
+0.32
1.29% |
$25.58
|
281,678
65.22% of 50 DAV
50 DAV is 431,900
|
$28.46
-12.02%
|
4/13/2010
|
$27.71
|
PP = $27.33
|
|
MB = $28.70
|
Most Recent Note - 6/2/2010 4:39:27 PM
G - Small gain on light volume today after heavy distributional pressure last week led to another close below its 50 DMA line which is now acting as a resistance level. Now -12% off its 52-week high, it has been consolidating for a 7-week period since peaking on 4/13/10. Technically, its 4/29/10 low of $23.66 is the next important chart support.
>>> The latest Featured Stock Update with an annotated graph appeared on 5/27/2010. Click here.
View all notes |
Alert me of new notes |
CANSLIM.net Company Profile |
SEC |
Zacks Reports |
StockTalk |
News |
Chart |
Request a new note
C
A N
S L
I M
|
Symbol/Exchange
Company Name
Industry Group |
PRICE |
CHANGE
(%Change) |
Day High |
Volume
(% DAV)
(% 50 day avg vol) |
52 Wk Hi
% From Hi |
Featured
Date |
Price
Featured |
Pivot Featured |
|
Max Buy |
MELI
-
NASDAQ
Mercadolibre Inc
INTERNET - Internet Software and; Services
|
$53.30
|
+2.31
4.53% |
$53.30
|
407,633
63.19% of 50 DAV
50 DAV is 645,100
|
$55.75
-4.39%
|
5/13/2010
|
$54.21
|
PP = $55.85
|
|
MB = $58.64
|
Most Recent Note - 6/2/2010 4:41:13 PM
G - Gain on light volume today while consolidating above its 50 DMA line, closing at the session high only -4.4% off its 52-week high. Its 200 DMA and recent lows define important near-term chart support.
>>> The latest Featured Stock Update with an annotated graph appeared on 5/28/2010. Click here.
View all notes |
Alert me of new notes |
CANSLIM.net Company Profile |
SEC |
Zacks Reports |
StockTalk |
News |
Chart |
Request a new note
C
A N
S L
I M
|
ROVI
-
NASDAQ
Rovi Corp
COMPUTER SOFTWARE andamp; SERVICES - Security Software andamp; Services
|
$37.46
|
+0.35
0.94% |
$37.46
|
928,756
72.54% of 50 DAV
50 DAV is 1,280,400
|
$40.06
-6.49%
|
4/20/2010
|
$37.62
|
PP = $38.60
|
|
MB = $40.53
|
Most Recent Note - 6/2/2010 4:43:50 PM
G - Still hovering quietly just under its 50 DMA line which has acted as resistance. Consolidating just -6.5% from its 52-week high after 3 down weeks with above average volume in the prior 4 weeks. Its recent chart low (5/25/10 low $35.09) defines near-term chart support above its 200 DMA line.
>>> The latest Featured Stock Update with an annotated graph appeared on 5/24/2010. Click here.
View all notes |
Alert me of new notes |
CANSLIM.net Company Profile |
SEC |
Zacks Reports |
StockTalk |
News |
Chart |
Request a new note
C
A N
S L
I M
|
SUMR
-
NASDAQ
Summer Infant Inc
CONSUMER NON-DURABLES - Personal Products
|
$8.06
|
-0.04
-0.49% |
$8.20
|
121,719
187.55% of 50 DAV
50 DAV is 64,900
|
$8.42
-4.28%
|
5/4/2010
|
$6.85
|
PP = $7.09
|
|
MB = $7.44
|
Most Recent Note - 6/2/2010 4:44:32 PM
G - Holding its ground while consolidating since its considerable gain with heavy volume on 5/28/10 for a new all-time high. Now extended from a sound base, prior highs and its 50 DMA coincide near $7.00 as an important chart support level.
>>> The latest Featured Stock Update with an annotated graph appeared on 5/21/2010. Click here.
View all notes |
Alert me of new notes |
CANSLIM.net Company Profile |
SEC |
Zacks Reports |
StockTalk |
News |
Chart |
Request a new note
C
A N
S L
I M
|
ULTA
-
NASDAQ
Ulta Salon Cosm & Frag
SPECIALTY RETAIL - Specialty Retail, Other
|
$23.59
|
-1.16
-4.69% |
$25.09
|
1,154,526
297.56% of 50 DAV
50 DAV is 388,000
|
$26.00
-9.27%
|
5/28/2010
|
$25.58
|
PP = $25.86
|
|
MB = $27.15
|
Most Recent Note - 6/2/2010 4:46:04 PM
G - Down considerably today with a loss on high volume ahead of pending earnings news due after Thursday's close. Color code was changed to green based its slump which led to trading under and near its 50 DMA line.
>>> The latest Featured Stock Update with an annotated graph appeared on 5/20/2010. Click here.
View all notes |
Alert me of new notes |
CANSLIM.net Company Profile |
SEC |
Zacks Reports |
StockTalk |
News |
Chart |
Request a new note
C
A N
S L
I M
|
|
|
|
THESE ARE NOT BUY RECOMMENDATIONS!
Comments contained in the body of this report are technical
opinions only. The material herein has been obtained
from sources believed to be reliable and accurate, however,
its accuracy and completeness cannot be guaranteed.
This site is not an investment advisor, hence it does
not endorse or recommend any securities or other investments.
Any recommendation contained in this report may not
be suitable for all investors and it is not to be deemed
an offer or solicitation on our part with respect to
the purchase or sale of any securities. All trademarks,
service marks and trade names appearing in this report
are the property of their respective owners, and are
likewise used for identification purposes only.
This report is a service available
only to active Paid Premium Members.
You may opt-out of receiving report notifications
at any time. Questions or comments may be submitted
by writing to Premium Membership Services 665 S.E. 10 Street, Suite 201 Deerfield Beach, FL 33441-5634 or by calling 1-800-965-8307
or 954-785-1121.
|
|
|


