You are not logged in.
This means you
CAN ONLY VIEW reports that were published prior to Sunday, February 25, 2024.
You
MUST UPGRADE YOUR MEMBERSHIP if you want to see any current reports.
AFTER MARKET UPDATE - THURSDAY, MAY 26TH, 2022
Previous After Market Report Next After Market Report >>>
|
|
|
|
DOW |
+516.91 |
32,637.19 |
+1.61% |
|
Volume |
1,009,675,176 |
-2% |
|
Volume |
4,655,435,300 |
+5% |
|
NASDAQ |
+305.91 |
11,740.65 |
+2.68% |
|
Advancers |
2,609 |
83% |
|
Advancers |
3,243 |
72% |
|
S&P 500 |
+79.11 |
4,057.84 |
+1.99% |
|
Decliners |
550 |
17% |
|
Decliners |
1,259 |
28% |
|
Russell 2000 |
+39.07 |
1,838.24 |
+2.17% |
|
52 Wk Highs |
87 |
|
|
52 Wk Highs |
32 |
|
|
S&P 600 |
+25.28 |
1,220.70 |
+2.11% |
|
52 Wk Lows |
40 |
|
|
52 Wk Lows |
165 |
|
|
The gains may seem encouraging, however, the market remains in a correction (M criteria). New buying efforts should be avoided until a solid follow-through day shows more decisive strength returning. Lower volume on the NYSE than on the prior session suggests that Thursday's solid gains shown by the Dow Jones Industrial Average and the S&P 500 Index were not the result of increasing institutional buying demand. Meanwhile, the Nasdaq Composite's big gain with higher volume marked only Day 2 for its new rally attempt since the low close that occurred on 5/22/22. Arguably, the rally still needs confirmation and an opportunity for a valid follow-through day remains open unless the recent lows or May 20th lows are violated.
|
 |
Major Indices Posted Gains Not Signaling a Solid Confirmation
Kenneth J. Gruneisen - Passed the CAN SLIM® Master's Exam
The Dow added 516 points, climbing for a fifth consecutive day for the first time since mid-March. The S&P 500 rallied 2%, while the Nasdaq Composite jumped 2.7%, with both benchmarks heading for their first weekly gain in eight weeks. Volume totals reported were mixed, lighter than the prior session on the NYSE and higher on the Nasdaq exchange. Breadth was positive as advancers led decliners by almost a 5-1 margin on the NYSE and by an 8-3 margin on the Nasdaq exchange. There were 46 high-ranked companies from the Leaders List that hit new 52-week highs and were listed on the BreakOuts Page, doubling the 23 on the prior session. New 52-week lows totals still outnumbered new 52-week highs totals on both the NYSE and the Nasdaq exchange. The major indices are in a repeatedly noted market correction (M criteria). Followers of the fact-based investment system know to watch for a follow-through day on Day 4-7 of a new rally attempt which could signal a new confirmed uptrend.
Chart courtesy of www.stockcharts.com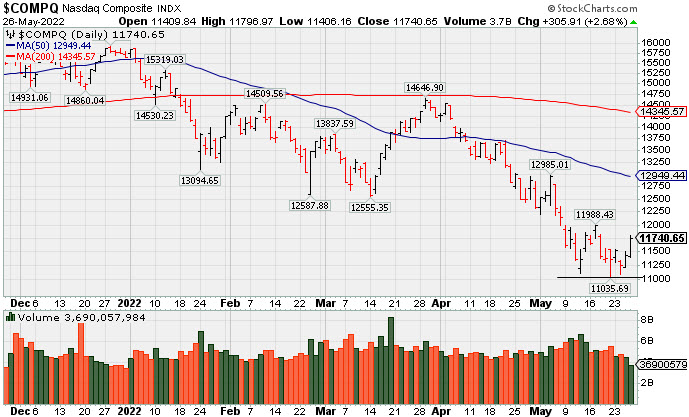 PICTURED: The Nasdaq Composite Index has seen volume totals cooling while sputtering near its 2022 low.
Lower volume on the NYSE than on the prior session suggests that Thursday's solid gains shown by the Dow Jones Industrial Average and the S&P 500 Index were not the result of increasing institutional buying demand. Meanwhile, the Nasdaq Composite's big gain with higher volume marked only Day 2 for its new rally attempt since the low close that occurred on 5/22/22. Arguably, the rally still needs confirmation and an opportunity for a valid follow-through day remains open unless the recent lows or May 20th lows are violated.
U.S. stocks staged a broad rally on Thursday as strong retail earnings buoyed sentiment. While contrarian buy signals and depressed sentiment and positioning continued to be cited as supporting risk appetite, month-end rebalancing may also have contributed to the bounce. Treasuries were little changed, with the yield on the 10-year note down one basis point (0.01%) to 2.75%.
Ten of 11 S&P 500 sectors finished in positive territory, with Consumer Discretionary outperforming amid strength in retailers. Macy’s Inc. (M +19.31%) rose following a boost to its full-year outlook, while Williams-Sonoma Inc. (WSM +13.06%) rose after reiterating its guidance despite worries surrounding waning demand for big-ticket items. Meanwhile, Dollar General Corp. (DG +13.71%) and Dollar Tree Inc. (DLTR +21.87%) both surged on upbeat results, with the latter highlighting positive customer response to their higher $1.25 price point. In Consumer Staples, Kraft Heinz Co. (KHC -7.05%) fell after being the subject of an analyst downgrade.
On the data front, a second reading of first-quarter U.S. GDP (Gross Domestic Product) was downwardly revised to indicate the economy contracted at a 1.5% annualized pace. Separately, weekly initial jobless claims came in at 210,000. Another release revealed pending home sales fell for a sixth straight month, the worst streak since 2018. Elsewhere, 30-year fixed mortgage rates dropped by the biggest margin in more than two years, declining to 5.10% in the latest week from 5.25%.
|
 Kenneth J. Gruneisen started out as a licensed stockbroker in August 1987, a couple of months prior to the historic stock market crash that took the Dow Jones Industrial Average down -22.6% in a single day. He has published daily fact-based fundamental and technical analysis on high-ranked stocks online for two decades. Through FACTBASEDINVESTING.COM, Kenneth provides educational articles, news, market commentary, and other information regarding proven investment systems that work in good times and bad.
Comments contained in the body of this report are technical opinions only and are not necessarily those of Gruneisen Growth Corp. The material herein has been obtained from sources believed to be reliable and accurate, however, its accuracy and completeness cannot be guaranteed. Our firm, employees, and customers may effect transactions, including transactions contrary to any recommendation herein, or have positions in the securities mentioned herein or options with respect thereto. Any recommendation contained in this report may not be suitable for all investors and it is not to be deemed an offer or solicitation on our part with respect to the purchase or sale of any securities. |
|
 |
Retail, Financial, Tech, and Energy-Linked Groups Rose
Kenneth J. Gruneisen - Passed the CAN SLIM® Master's Exam
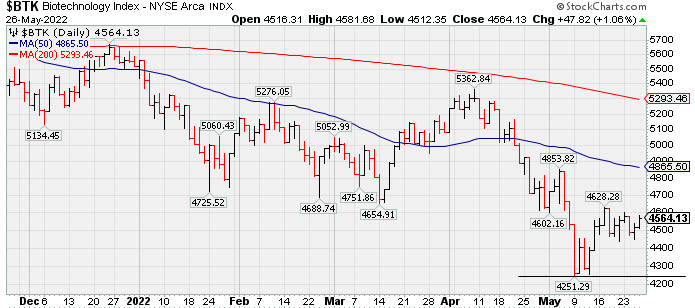
The Retail Index ($RLX +4.46%) posted an influential gain while the Broker/Dealer Index ($XBD +2.66%) and Bank Index ($BKX +2.42%) rebounded and also helped to boost the major averages. The tech sector had a positive bias as the Semiconductor Index ($SOX +3.87%) outpaced the Networking Index ($NWX +1.40%) and the Biotech Index ($BTK +1.06%). The Oil Services Index ($OSX +2.44%) and Integrated Oil Index ($XOI +1.13%) both posted gains while the Gold & Silver Index ($XAU -0.27%) edged lower.
PICTURED: The Biotech Index ($BTK +1.06%) is consolidating, still well below its 50 and 200 DMA lines, after rebounding from the May 9th low.
| Oil Services |
$OSX |
81.52 |
+1.94 |
+2.44% |
+54.63% |
| Integrated Oil |
$XOI |
1,771.32 |
+19.76 |
+1.13% |
+50.34% |
| Semiconductor |
$SOX |
2,994.61 |
+111.68 |
+3.87% |
-24.11% |
| Networking |
$NWX |
735.13 |
+10.15 |
+1.40% |
-24.30% |
| Broker/Dealer |
$XBD |
412.80 |
+10.68 |
+2.66% |
-15.21% |
| Retail |
$RLX |
3,031.29 |
+129.34 |
+4.46% |
-28.28% |
| Gold & Silver |
$XAU |
131.28 |
-0.35 |
-0.27% |
-0.88% |
| Bank |
$BKX |
114.82 |
+2.71 |
+2.42% |
-13.16% |
| Biotech |
$BTK |
4,564.13 |
+47.82 |
+1.06% |
-17.29% |
|
|
|
 |
Featured Stocks
Kenneth J. Gruneisen - Passed the CAN SLIM® Master's Exam
|
|
|
Color Codes Explained :
Y - Better candidates highlighted by our
staff of experts.
G - Previously featured
in past reports as yellow but may no longer be buyable under the
guidelines.
***Last / Change / Volume data in this table is the closing quote data***
Symbol/Exchange
Company Name
Industry Group |
PRICE |
CHANGE
(%Change) |
Day High |
Volume
(% DAV)
(% 50 day avg vol) |
52 Wk Hi
% From Hi |
Featured
Date |
Price
Featured |
Pivot Featured |
|
Max Buy |
 CI
-
NYSE
CI
-
NYSE
Cigna Corp
Medical-Managed Care
|
$268.88
|
+3.13
1.18% |
$271.00
|
1,695,832
114.04% of 50 DAV
50 DAV is 1,487,000
|
$271.71
-1.04%
|
5/6/2022
|
$263.52
|
PP = $269.97
|
|
MB = $283.47
|
 Most Recent Note - 5/26/2022 6:12:02 PM
Y - Posted a 5th consecutive small gain today with near average volume, consolidating above its 50 DMA line ($254) and challenging its all-time high. Subsequent gains above the pivot point backed by at least +40% above average volume may trigger a technical buy signal. Fundamentals remain strong. See the latest FSU analysis for more details and an annotated graph.
>>> FEATURED STOCK ARTICLE : Consolidating Above 50-Day Moving Average Near All-Time High - 5/25/2022 |
View all notes |
Set NEW NOTE alert |
Company Profile |
SEC
News |
Chart |
Request a new note
C
A
S
I |
PAG
-
NYSE
Penske Automotive Grp
Retail/Whlsle-Automobile
|
$115.20
|
+2.89
2.57% |
$117.43
|
271,370
79.35% of 50 DAV
50 DAV is 342,000
|
$119.47
-3.57%
|
5/13/2022
|
$114.88
|
PP = $114.57
|
|
MB = $120.30
|
Most Recent Note - 5/26/2022 6:15:23 PM
Y - Posted a 4th consecutive gain with below average volume, rising back above the previously cited pivot point. Its 50 DMA line ($103.53) defines near term support to watch.
>>> FEATURED STOCK ARTICLE : Breakout With Volume-Driven Gain to New High - 5/13/2022 |
View all notes |
Set NEW NOTE alert |
Company Profile |
SEC
News |
Chart |
Request a new note
C
A
S
I |
LLY
-
NYSE
Eli Lilly & Co
Medical-Diversified
|
$313.46
|
+6.45
2.10% |
$313.91
|
3,283,411
111.42% of 50 DAV
50 DAV is 2,947,000
|
$314.00
-0.17%
|
5/16/2022
|
$302.46
|
PP = $314.10
|
|
MB = $329.81
|
Most Recent Note - 5/26/2022 6:14:08 PM
Y - Managed a new high close and challenged its 52-week high with today's 5th consecutive gain with near average volume. Its 50 DMA line ($294) recently acted as support. Pivot point cited was based on its 4/07/22 high plus 10 cents. Three of the past 4 quarterly comparisons were above the +25% minimum earnings guideline (C criteria).
>>> FEATURED STOCK ARTICLE : Eli Lilly & Co Challenges All-Time High - 5/16/2022 |
View all notes |
Set NEW NOTE alert |
Company Profile |
SEC
News |
Chart |
Request a new note
C
A
S
I |
|
|
|
THESE ARE NOT BUY RECOMMENDATIONS!
Comments contained in the body of this report are technical
opinions only. The material herein has been obtained
from sources believed to be reliable and accurate, however,
its accuracy and completeness cannot be guaranteed.
This site is not an investment advisor, hence it does
not endorse or recommend any securities or other investments.
Any recommendation contained in this report may not
be suitable for all investors and it is not to be deemed
an offer or solicitation on our part with respect to
the purchase or sale of any securities. All trademarks,
service marks and trade names appearing in this report
are the property of their respective owners, and are
likewise used for identification purposes only.
This report is a service available
only to active Paid Premium Members.
You may opt-out of receiving report notifications
at any time. Questions or comments may be submitted
by writing to Premium Membership Services 665 S.E. 10 Street, Suite 201 Deerfield Beach, FL 33441-5634 or by calling 1-800-965-8307
or 954-785-1121.
|
|
|