You are not logged in.
This means you
CAN ONLY VIEW reports that were published prior to Monday, April 14, 2025.
You
MUST UPGRADE YOUR MEMBERSHIP if you want to see any current reports.
AFTER MARKET UPDATE - WEDNESDAY, MAY 26TH, 2010
Previous After Market Report Next After Market Report >>>
|
|
|
|
DOW |
-69.30 |
9,974.45 |
-0.69% |
|
Volume |
1,943,354,030 |
+3% |
|
Volume |
2,956,192,800 |
+5% |
|
NASDAQ |
-15.07 |
2,195.88 |
-0.68% |
|
Advancers |
1,868 |
59% |
|
Advancers |
1,499 |
54% |
|
S&P 500 |
-6.08 |
1,067.95 |
-0.57% |
|
Decliners |
1,245 |
39% |
|
Decliners |
1,192 |
43% |
|
Russell 2000 |
+2.60 |
642.62 |
+0.41% |
|
52 Wk Highs |
21 |
|
|
52 Wk Highs |
20 |
|
|
S&P 600 |
+0.93 |
344.33 |
+0.27% |
|
52 Wk Lows |
23 |
|
|
52 Wk Lows |
63 |
|
|
 |
Volatility Continues As Wednesday's Negative Reversal Erased Early Gains
Adam Sarhan, Contributing Writer,
The major averages and the euro negatively reversed (opened higher but closed lower) after Italy announced that it will restructure $30 billion in debt and Germany's bond auction was less than stellar. Volume totals were reported higher compared to Tuesday's totals on both major exchanges while the indices ended unanimously lower. Meanwhile advancers led decliners by a 5-to-4 ratio on the Nasdaq exchange and a 3-to-2 ratio on the NYSE. There were 8 high-ranked companies from the CANSLIM.net Leaders List that made a new 52-week high and appeared on the CANSLIM.net BreakOuts Page, higher than the 0 issues that appeared on Tuesday. New 52-week lows outnumbered new 52-week lows on the NYSE and on the Nasdaq exchange. It is difficult for the market to mount a sustained rally without a healthy crop of strong leaders.
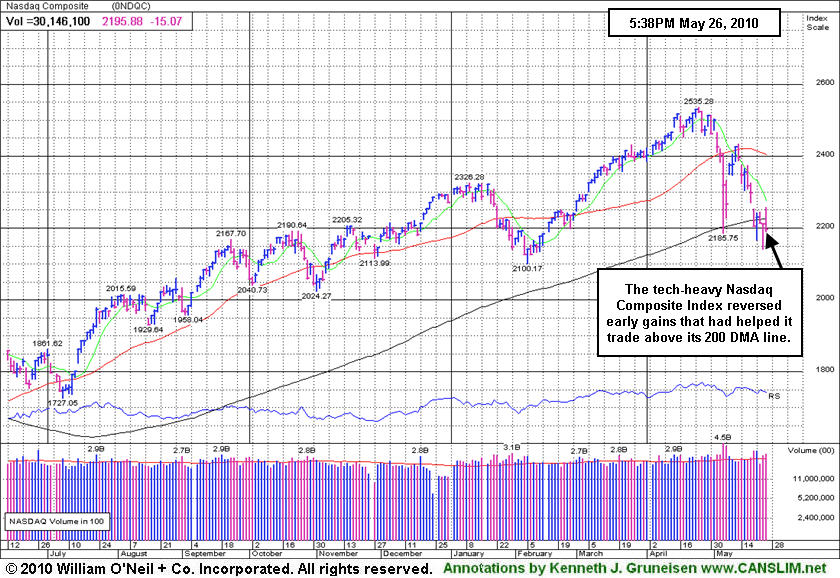
The major averages opened higher after a healthy rebound from a fresh 2010 low on Tuesday. However, the bears quickly showed up and sent the market lower which reiterates the importance of waiting for a proper follow-through day (FTD) to emerge before buying stocks. Italy's Prime Minister, Silvio Berlusconi, said the country planned 24.9 billion euros ($30.4 billion) of budget cuts over the next two years. Berlusconi said the budget cuts are "absolutely necessary" and are strictly aimed at defending the euro. The measures are part of a broad push by several European nations aimed at taming budget deficits and to protect the euro. So far, the euro has plunged -15% this year and is currently testing its 2008 and 2009 low.
The economic news released on Wednesday was healthy as new home sales and durable goods both jumped to multi year highs. New home sales rose +15% to an annual pace of +504,000 last month. This was the highest reading in two years which bodes well for the ailing housing market. The report showed that the median price of a new home fell to $198,400 which was the lowest level since December 2003. It was interesting to see that the vast majority of new sales occurred in houses costing less than $300,000 which reflects demand from first-time buyers due to the now expired tax credit. Elsewhere, the Commerce Department said durable goods orders jumped +2.9% which was the highest reading in at least three years. Wednesday marked Day 2 of a new rally attempt for the benchmark S&P 500 Index but the other major averages have yet to mark Day 1 of a new rally attempt. That said, as long Tuesday's lows are not breached in the S&P 500, the earliest a proper follow-through day (FTD) could occur would be Friday. However, if at anytime Tuesday's S&P 500 Index lows are breached, then the day count will be reset. What does all of this mean for investors? Simple, the market remains in a correction which reiterates the importance of adopting a strong defense stance until a new rally is confirmed. Trade accordingly.
Professional Money Management Services - Free Portfolio Review:
If your portfolio is greater than $100,000 and you would like a free portfolio review, click here to get connected with one of our portfolio managers. ** Serious inquires only, please.
PICTURED: The tech-heavy Nasdaq Composite Index reversed early gains that had helped it trade above its 200-day moving average (DMA) line.
|
|
|
 |
Semiconductor Index Halted Slide Near 200-Day Average
Kenneth J. Gruneisen - Passed the CAN SLIM® Master's Exam
The Healthcare Index ($HMO +1.38%) and Oil Services Index ($OSX +1.43%) posted gains while most other groups ended in the red on Wednesday. Financial shares showed mixed action as the Bank Index ($BKX -0.20%) edged lower and the Broker/Dealer Index ($XBD +0.18%) managed to close with a small gain. Weakness in the Retail Index ($RLX -1.22%) and tech shares weighed on the major averages as the Networking Index ($NWX -0.87%), Internet Index ($IIX -0.41%), Biotechnology Index ($BTK -0.37%), and Semiconductor Index ($SOX -0.21%) finished unanimously with small losses. The Integrated Oil Index ($XOI -0.98%) and Gold & Silver Index ($XAU -0.27%) also closed lower.
Charts courtesy www.stockcharts.com
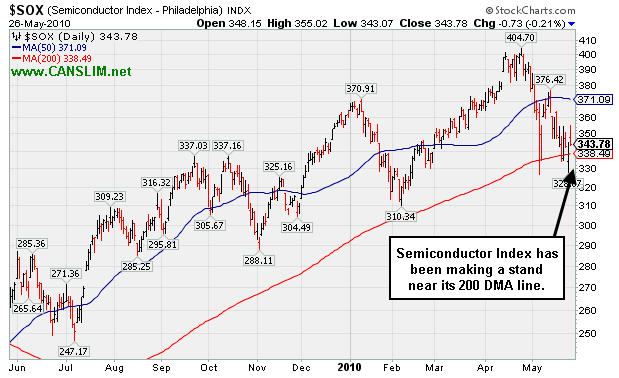
PICTURED: The Semiconductor Index has been making a stand near its 200-day moving average (DMA) line.
| Oil Services |
$OSX |
177.03 |
+2.50 |
+1.43% |
-9.18% |
| Healthcare |
$HMO |
1,438.13 |
+19.60 |
+1.38% |
-2.36% |
| Integrated Oil |
$XOI |
931.58 |
-9.25 |
-0.98% |
-12.79% |
| Semiconductor |
$SOX |
343.78 |
-0.73 |
-0.21% |
-4.48% |
| Networking |
$NWX |
236.42 |
-2.08 |
-0.87% |
+2.32% |
| Internet |
$IIX |
231.47 |
-0.95 |
-0.41% |
-1.02% |
| Broker/Dealer |
$XBD |
106.37 |
+0.19 |
+0.18% |
-7.55% |
| Retail |
$RLX |
435.24 |
-5.36 |
-1.22% |
+5.87% |
| Gold & Silver |
$XAU |
170.74 |
-0.46 |
-0.27% |
+1.48% |
| Bank |
$BKX |
49.13 |
-0.10 |
-0.20% |
+15.03% |
| Biotech |
$BTK |
1,034.91 |
-3.88 |
-0.37% |
+9.85% |
|
|
|
 |
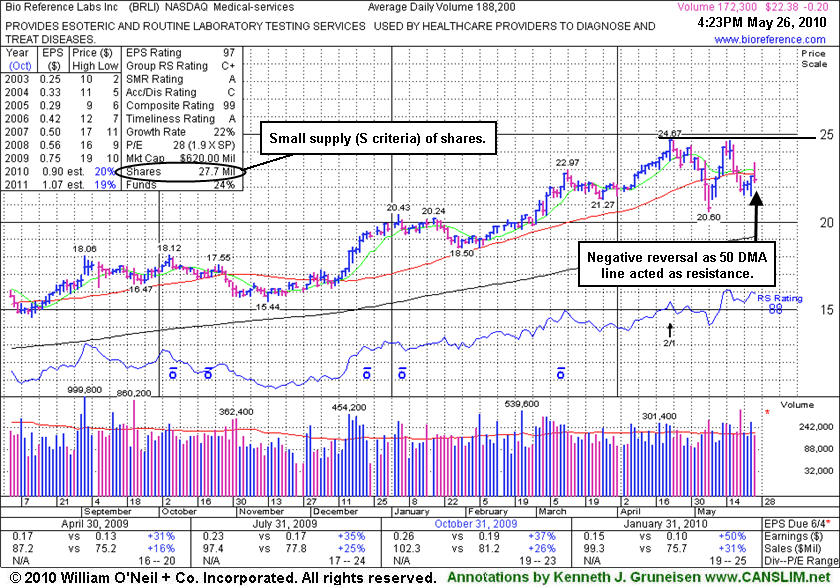
Fact-Based Analysis Puts Disciplined Investors To Test
Kenneth J. Gruneisen - Passed the CAN SLIM® Master's Exam
Bio-Reference Laboratories, Inc. (BRLI -$0.28 or -1.24% to $22.30) reversed its early gains today as its 50-day moving average (DMA) line acted as resistance. For its outlook to improve it would need to repair the violation of its short-term average line and work up through a bit of resistance due to overhead supply. Meanwhile it is now -9.6% off its 52-week high.
BRLI gapped up on 5/10/10 and promptly rallied back above its 3/26/10 low. It was noted that during the wild 5/06/10 trading session it reportedly traded down considerably intra-day, undercutting its 200 DMA line and revisiting its November 2009 lows, yet it rebounded to close near its 50 DMA line and in the upper part of its range. In the May 11, 2010 FSU section under the headline "50-Day Moving Average Violation Triggered Recent Sell Signal" we observed - "Apparently some low trades must have been taken off the tape, as the chart now reads differently for that date. More time is needed to see if a proper new base may form, and to also see if the major averages (M criteria) will confirm their new rally attempt with a powerful follow-through-day." Soon afterward, one of our valued members wrote in, and the ongoing exchange since has been summarized in the "Ken's Mailbag" section tonight. While we continue to do our utmost in fact-based reporting, the fact that other charting services continue reporting the questioned data differently should not be overlooked. The following links to charts on Nasdaq.com and Stockcharts.com and BigCharts.com each show lows on May 6th far below that which is shown on the graph below.
A gain on 3/04/10 with 2 times average volume lifted it solidly above its previously cited pivot point, confirming a technical buy signal. Now that old resistance level it cleared is a key chart support level. Its weekly chart is marked by many up weeks with above average volume and few down weeks on volume - very bullish characteristics. Earnings growth and sales revenues growth has accelerated, with increases better than the +25% minimum guideline in recent quarters. Fundamentals are favorable with respect to the C and A criteria of the investment system. Since splitting its shares 2:1 on 4/22/10 BRLI now has 27.7 million shares outstanding (S criteria). The number of top-rated funds owning its shares rose from 77 in Mar '09 to 87 in Mar '10 which is somewhat reassuring in regard to the I criteria of the investment system.
 |
|
|
Color Codes Explained :
Y - Better candidates highlighted by our
staff of experts.
G - Previously featured
in past reports as yellow but may no longer be buyable under the
guidelines.
***Last / Change / Volume data in this table is the closing quote data***
Symbol/Exchange
Company Name
Industry Group |
PRICE |
CHANGE
(%Change) |
Day High |
Volume
(% DAV)
(% 50 day avg vol) |
52 Wk Hi
% From Hi |
Featured
Date |
Price
Featured |
Pivot Featured |
|
Max Buy |
BIDU
-
NASDAQ
Baidu Inc Ads
INTERNET - Internet Information Providers
|
$67.59
|
-1.49
-2.16% |
$72.08
|
12,453,919
70.12% of 50 DAV
50 DAV is 17,760,800
|
$82.29
-17.86%
|
1/13/2010
|
$43.13
|
PP = $42.68
|
|
MB = $44.81
|
Most Recent Note - 5/25/2010 12:49:58 PM
G - Gapped down today, falling toward its 50 DMA line. A worrisome negative reversal from its all-time high on 5/13/10 followed a 10:1 stock split. It is extended from any sound base.
>>> The latest Featured Stock Update with an annotated graph appeared on 5/14/2010. Click here.
View all notes |
Alert me of new notes |
CANSLIM.net Company Profile |
SEC |
Zacks Reports |
StockTalk |
News |
Chart |
Request a new note
C
A N
S L
I M


|
BPI
-
NYSE
Bridgepoint Education
DIVERSIFIED SERVICES - Education and; Training Services
|
$21.78
|
-0.34
-1.54% |
$23.21
|
909,144
176.36% of 50 DAV
50 DAV is 515,500
|
$27.50
-20.80%
|
4/13/2010
|
$25.59
|
PP = $25.76
|
|
MB = $27.05
|
Most Recent Note - 5/25/2010 12:56:38 PM
G - Gapped down today, diving below recent lows and old chart highs near $22 previously mentioned as "a very important support level to watch." It would need to rally back above its 50 DMA line for its outlook to improve. Based on weakness it will be dropped from the Featured Stocks list tonight.
>>> The latest Featured Stock Update with an annotated graph appeared on 5/25/2010. Click here.
View all notes |
Alert me of new notes |
CANSLIM.net Company Profile |
SEC |
Zacks Reports |
StockTalk |
News |
Chart |
Request a new note
C
A N
S L
I M
|
BRLI
-
NASDAQ
Bio Reference Labs Inc
HEALTH SERVICES - Medical Laboratories and Researc
|
$22.30
|
-0.28
-1.24% |
$23.26
|
245,568
132.52% of 50 DAV
50 DAV is 185,300
|
$24.67
-9.62%
|
2/12/2010
|
$39.02
|
PP = $20.49
|
|
MB = $21.51
|
Most Recent Note - 5/25/2010 5:58:53 PM
G - Gain on higher volume today was somewhat encouraging, but it remains below its 50 DMA line. For its outlook to improve it would need to repair the violation of its short-term average line.
>>> The latest Featured Stock Update with an annotated graph appeared on 5/26/2010. Click here.
View all notes |
Alert me of new notes |
CANSLIM.net Company Profile |
SEC |
Zacks Reports |
StockTalk |
News |
Chart |
Request a new note
C
A N
S L
I M
|
CRM
-
NYSE
Salesforce.Com Inc
INTERNET - Internet Software and Services
|
$83.75
|
+1.62
1.97% |
$85.79
|
3,170,769
156.30% of 50 DAV
50 DAV is 2,028,700
|
$89.84
-6.78%
|
3/5/2010
|
$72.28
|
PP = $75.53
|
|
MB = $79.31
|
 Most Recent Note - 5/26/2010 4:01:50 PM
G - Gain today and its positive reversal on 5/21/10 are signs of institutional support recently showing up near its 50 DMA line.
>>> The latest Featured Stock Update with an annotated graph appeared on 5/17/2010. Click here.
View all notes |
Alert me of new notes |
CANSLIM.net Company Profile |
SEC |
Zacks Reports |
StockTalk |
News |
Chart |
Request a new note
C
A N
S L
I M
|
LL
-
NYSE
Lumber Liquidators Hldgs
RETAIL - Home Improvement Stores
|
$28.69
|
+0.77
2.76% |
$29.39
|
271,979
73.13% of 50 DAV
50 DAV is 371,900
|
$33.41
-14.13%
|
4/22/2010
|
$29.87
|
PP = $29.03
|
|
MB = $30.48
|
Most Recent Note - 5/26/2010 3:22:54 PM
G - Today's gain with light volume helped it rise above its 50 DMA line, helping its outlook improve somewhat. Technically its slump under its December 2009 highs completely negated the latest breakout. It has been quietly consolidating for about 5 weeks since its "negative reversal" after hitting an all-time high on 4/26/10 was noted.
>>> The latest Featured Stock Update with an annotated graph appeared on 5/19/2010. Click here.
View all notes |
Alert me of new notes |
CANSLIM.net Company Profile |
SEC |
Zacks Reports |
StockTalk |
News |
Chart |
Request a new note
C
A N
S L
I M
|
Symbol/Exchange
Company Name
Industry Group |
PRICE |
CHANGE
(%Change) |
Day High |
Volume
(% DAV)
(% 50 day avg vol) |
52 Wk Hi
% From Hi |
Featured
Date |
Price
Featured |
Pivot Featured |
|
Max Buy |
LOPE
-
NASDAQ
Grand Canyon Education
DIVERSIFIED SERVICES - Education and; Training Services
|
$26.24
|
+0.63
2.46% |
$26.49
|
650,063
159.29% of 50 DAV
50 DAV is 408,100
|
$28.46
-7.80%
|
4/13/2010
|
$27.71
|
PP = $27.33
|
|
MB = $28.70
|
Most Recent Note - 5/26/2010 3:32:22 PM
G - Gain today helped it rise above its 50 DMA line. It is -7% off its 52-week high and has been consolidating for a 7-week period since peaking on 4/13/10. Technically, its 4/29/10 low of $23.66 is the next important chart support.
>>> The latest Featured Stock Update with an annotated graph appeared on 5/10/2010. Click here.
View all notes |
Alert me of new notes |
CANSLIM.net Company Profile |
SEC |
Zacks Reports |
StockTalk |
News |
Chart |
Request a new note
C
A N
S L
I M
|
MELI
-
NASDAQ
Mercadolibre Inc
INTERNET - Internet Software and; Services
|
$49.36
|
+1.90
4.00% |
$50.32
|
852,323
137.43% of 50 DAV
50 DAV is 620,200
|
$55.75
-11.46%
|
5/13/2010
|
$54.21
|
PP = $55.85
|
|
MB = $58.64
|
Most Recent Note - 5/26/2010 11:48:39 AM
G - Today's rally back above its 50 DMA line technically helps its outlook improve. Market conditions (M criteria) remain doubtful until a follow-through day from at least one of the major averages confirms that sufficient institutional buying conviction has returned. Its 200 DMA and recent lows define important near-term chart support.
>>> The latest Featured Stock Update with an annotated graph appeared on 5/13/2010. Click here.
View all notes |
Alert me of new notes |
CANSLIM.net Company Profile |
SEC |
Zacks Reports |
StockTalk |
News |
Chart |
Request a new note
C
A N
S L
I M
|
ROVI
-
NASDAQ
Rovi Corp
COMPUTER SOFTWARE andamp; SERVICES - Security Software andamp; Services
|
$37.08
|
+0.42
1.15% |
$37.99
|
3,929,239
324.57% of 50 DAV
50 DAV is 1,210,600
|
$40.06
-7.44%
|
4/20/2010
|
$37.62
|
PP = $38.60
|
|
MB = $40.53
|
Most Recent Note - 5/26/2010 4:05:40 PM
G - Consolidating just -7% from its 52-week high, it posted a gain today on average volume, but its 50 DMA line has been recently acting as resistance. Its recent chart low ($33.17) defines near-term chart support above its 200 DMA line.
>>> The latest Featured Stock Update with an annotated graph appeared on 5/24/2010. Click here.
View all notes |
Alert me of new notes |
CANSLIM.net Company Profile |
SEC |
Zacks Reports |
StockTalk |
News |
Chart |
Request a new note
C
A N
S L
I M
|
SUMR
-
NASDAQ
Summer Infant Inc
CONSUMER NON-DURABLES - Personal Products
|
$7.39
|
+0.03
0.41% |
$7.46
|
54,805
99.46% of 50 DAV
50 DAV is 55,100
|
$8.21
-9.99%
|
5/4/2010
|
$6.85
|
PP = $7.09
|
|
MB = $7.44
|
Most Recent Note - 5/26/2010 4:11:04 PM
Y - Holding its ground above prior chart highs and its 50 DMA line. Color code is changed to yellow as its consolidation continues just under its "max buy" price. Gapped down on 5/25/10, yet its latest breakout remains intact after enduring distributional pressure.
>>> The latest Featured Stock Update with an annotated graph appeared on 5/21/2010. Click here.
View all notes |
Alert me of new notes |
CANSLIM.net Company Profile |
SEC |
Zacks Reports |
StockTalk |
News |
Chart |
Request a new note
C
A N
S L
I M
|
ULTA
-
NASDAQ
Ulta Salon Cosm & Frag
SPECIALTY RETAIL - Specialty Retail, Other
|
$23.62
|
+0.76
3.32% |
$24.08
|
759,630
195.78% of 50 DAV
50 DAV is 388,000
|
$25.76
-8.31%
|
3/12/2010
|
$22.81
|
PP = $21.72
|
|
MB = $22.81
|
Most Recent Note - 5/26/2010 4:16:18 PM
G - Gain today with higher volume helped promptly repair its latest brief 50 DMA line breach, a more encouraging sign of support. Recent chart lows define important support to watch.
>>> The latest Featured Stock Update with an annotated graph appeared on 5/20/2010. Click here.
View all notes |
Alert me of new notes |
CANSLIM.net Company Profile |
SEC |
Zacks Reports |
StockTalk |
News |
Chart |
Request a new note
C
A N
S L
I M
|
Symbol/Exchange
Company Name
Industry Group |
PRICE |
CHANGE
(%Change) |
Day High |
Volume
(% DAV)
(% 50 day avg vol) |
52 Wk Hi
% From Hi |
Featured
Date |
Price
Featured |
Pivot Featured |
|
Max Buy |
|
 |
|
| Subscriber Questions: |
May 11, 2010 |
Ken,
You noted in today's comments that for BRLI, that they may have taken some of the trades off the tape. I was actually stopped out at 2:50PM the day of the plunge and they took 2,000 shares away from me in the low $17s. I contacted the firm where my account is held immediately and took 2 hours to get hold of them that day. They indicated there was nothing that could be done. I did check the busted trade list and BRLI was not on it. The shares were taken at about a 35% discount from where it was trading 1 minute earlier. Please let me know if you have any suggestions. Thanks.
Alan |
| Ken's Response: |
May 11, 2010 |
Dear Alan,
I am very sorry to hear about your experience. You might take it up with the firm that holds your account again, and maybe make a more formal complaint to them in writing with a certified letter if they do not provide what you find to be an adequate response by phone. It may not be your brokerage firm's fault at all that it happened, yet you might also threaten to escalate your complaint to the SEC and/or FINRA, and, beyond that, consider going to arbitration if you feel it is worth the effort for a chance at recouping something. Since the data on the charts I have viewed on various sites differs and has clearly been revised on DailyGraphs, it behooves Fidelity to look into the matter for you again and provide sufficient explanation. It is not illegal for stocks to be volatile, but when the exchanges became disconnected and market participation mid-session was suddenly as thin as the "after hours" trading session, it sure made it tough on those of us with a desire to limit our downside. If you need an expert witness let me know, and please keep me posted on whatever may come of your contested BRLI trade.
Please let me know if you have any other feedback by filling out the inquiry form.

Kenneth J. Gruneisen
Founder & Contributing Writer for CANSLIM.net
www.canslim.net |
| Subscriber Questions: |
May 25, 2010 |
Ken,
Again, if you have any insight, your help would be appreciated. I was holding significant positions in RRZ, the Rydex 2x Russell ultrashort fund. Without notification to me by either Fidelity or Rydex, the fund was liquidated last Friday. (Maybe this explains the mysterious run up Friday at the close). I found this when I went to sell today and found there was no longer a valid ticker symbol. I thought I was hedged for this downturn only to find I did not have a position. I was hosed again. Not only that, but I can't get my money until they do whatever to finish closeout of the account. Also, proceeds will be less any closeout costs.
Rydex indicates they notified Fidelity and Fidelity indicates they were not notified and aren't responsible. They indicate they cannot contact every customer for every split, blah blah blah, etc, basically both pointing the finger at the other. Any insight would be wonderful. Thanks.
Alan |
| Ken's Response: |
May 26, 2010 |
Dear Alan,
I have heard of mutual funds closing before or merging in with other funds, and I suppose the same thing is likely to happen to some ETFs. I don't know what to say except that this seems to be part of the high price of low-cost investing, as the investing public still salivates for no-load and low commission products that do not have a proven long-term track record. I am not sure, but would guess that Rydex has a right to have a fund "go out of business" as it sounds like they have. So now, you just have to trust that they tried their best and won't be grossly unfair to you.
If you watched the Q1 CANSLIM.net Webcast (click here), I briefly discussed the recent performance of one of the many popular 2X index ETFs. I also pointed out at an investor meeting in San Diego not long ago that the ProShares prospectus' describes the underlying investments as mostly being "swap agreements", which made me very concerned. I imagined what the response might be if I called up investors and said, "I have a great investment for you. Let's put your money into swap agreements."
Please let me know if you have any other feedback by filling out the inquiry form.
Kenneth J. Gruneisen
Founder & Contributing Writer for CANSLIM.net
www.canslim.net |
|
|
|
THESE ARE NOT BUY RECOMMENDATIONS!
Comments contained in the body of this report are technical
opinions only. The material herein has been obtained
from sources believed to be reliable and accurate, however,
its accuracy and completeness cannot be guaranteed.
This site is not an investment advisor, hence it does
not endorse or recommend any securities or other investments.
Any recommendation contained in this report may not
be suitable for all investors and it is not to be deemed
an offer or solicitation on our part with respect to
the purchase or sale of any securities. All trademarks,
service marks and trade names appearing in this report
are the property of their respective owners, and are
likewise used for identification purposes only.
This report is a service available
only to active Paid Premium Members.
You may opt-out of receiving report notifications
at any time. Questions or comments may be submitted
by writing to Premium Membership Services 665 S.E. 10 Street, Suite 201 Deerfield Beach, FL 33441-5634 or by calling 1-800-965-8307
or 954-785-1121.
|
|
|


