You are not logged in.
This means you
CAN ONLY VIEW reports that were published prior to Friday, April 11, 2025.
You
MUST UPGRADE YOUR MEMBERSHIP if you want to see any current reports.
AFTER MARKET UPDATE - THURSDAY, MAY 27TH, 2010
Previous After Market Report Next After Market Report >>>
|
|
|
|
DOW |
+284.54 |
10,258.99 |
+2.85% |
|
Volume |
1,421,847,510 |
-27% |
|
Volume |
2,313,632,350 |
-22% |
|
NASDAQ |
+81.80 |
2,277.68 |
+3.73% |
|
Advancers |
2,865 |
91% |
|
Advancers |
2,397 |
86% |
|
S&P 500 |
+35.11 |
1,103.06 |
+3.29% |
|
Decliners |
251 |
8% |
|
Decliners |
353 |
13% |
|
Russell 2000 |
+27.89 |
670.51 |
+4.34% |
|
52 Wk Highs |
27 |
|
|
52 Wk Highs |
29 |
|
|
S&P 600 |
+13.77 |
358.10 |
+4.00% |
|
52 Wk Lows |
11 |
|
|
52 Wk Lows |
22 |
|
|
 |
Major Averages' Gains Lacked Underlying Volume Conviction
Adam Sarhan, Contributing Writer,
Stocks surged around the world after China said it remains a long-term investor in Europe, which helped the euro snap a losing streak and allowed China's stock market to score a follow-through day (FTD). Volume totals in the US markets were reported lower compared to Wednesday's totals on both major exchanges while the indices ended unanimously higher. Advancers trumped decliners by an 11-to-1 ratio on the NYSE and they led by over a 6-to-1 ratio on the Nasdaq exchange. There were 9 high-ranked companies from the CANSLIM.net Leaders List that made a new 52-week high and appeared on the CANSLIM.net BreakOuts Page, higher than the 8 issues that appeared on Tuesday. New 52-week highs outnumbered new 52-week lows on the NYSE and on the Nasdaq exchange.
Overnight, China's foreign exchange regulator quelled rumors that China was going to review its euro holdings. He said the rumors were "groundless" which sparked a world-wide rally and helped allay ongoing contagion woes. In Spain, Jose Luis Rodriguez Zapatero, won parliamentary approval for austerity measures which was another healthy step for the euro. One of the three stock exchanges in China, the Shenzhen stock exchange, scored a follow-through day which bodes well for global capital markets. Over the past few years, China's stock market has moved "ahead" of other stock markets. For example, China's Shanghai composite hit a low in October 2008, five months before the March 2009 bottom. More recently, the Shanghai Composite placed a near-term top on April 15, two weeks before the S&P 500 printed its 2010 high of 1,219. Despite, China's strong move it is still -20% below its 2010 high which technically defines it as being in a "bear market". In addition, the Shanghai composite is still below both its 50-day and 200-day moving average (DMA) lines which suggest a lot of technical damage must be repaired before this market is off to new highs.
In the US, two important economic reports were released: gross domestic product (GDP) and weekly jobless claims. The government said the US economy grew at a slower pace than previously expected in the first quarter and jobless claims fell less than economists expected. First quarter GDP rose +3% compared to last month's reading of a +3.2% increase. Meanwhile, the Labor Department said, initial jobless claims fell by -14,000 to 460,000 in the week ended May 22 which was lower than the Street's forecast of 455,000.
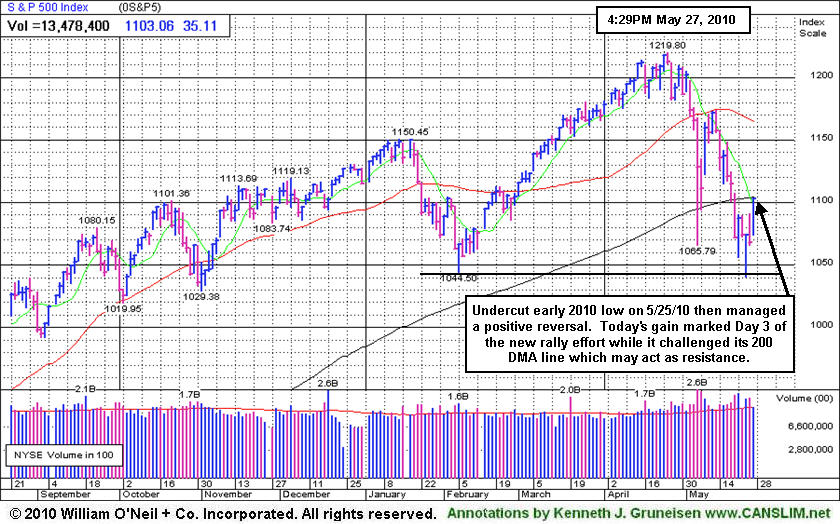
Thursday marked Day 3 of a new rally attempt for the benchmark S&P 500 Index and Day 1 for the other major averages. That said, as long Tuesday's lows are not breached in the S&P 500, the earliest a proper follow-through day (FTD) could occur would be Friday. However, if at anytime Tuesday's S&P 500 Index lows are breached, then the day count will be reset. What does all of this mean for investors? Simple, the market remains in a correction which reiterates the importance of adopting a strong defense stance until a new rally is confirmed. Trade accordingly.
Professional Money Management Services - Free Portfolio Review:
If your portfolio is greater than $100,000 and you would like a free portfolio review, click hereto get connected with one of our portfolio managers. ** Serious inquires only, please.
PICTURED: The S&P 500 Index under cut its early 2010 low on May 25th then managed a positive reversal. Thursday's gain marked Day 3 of the new rally effort as it challenged its 200 DMA line which may act as resistance.
|
|
|
 |
Bank Index Made A Stand Near 200 Day Average Line
Kenneth J. Gruneisen - Passed the CAN SLIM® Master's Exam
Financial shares actively participated in Thursday's broad-based rally as the Broker/Dealer Index ($XBD +3.89%) and Bank Index ($BKX +3.99%) tallied large gains. The Semiconductor Index ($SOX +5.17%) led big tech sector gains as the Networking Index ($NWX +4.40%), Internet Index ($IIX +3.57%), and Biotechnology Index ($BTK +2.19%) posted unanimous gains and the Retail Index ($RLX +3.07%) also helped to positively influence the major averages. Energy shares also spurted higher as the Integrated Oil Index ($XOI +5.38%) and Oil Services Index ($OSX +2.54%) rose along with defensive groups including the Healthcare Index ($HMO +2.77%) and Gold & Silver Index ($XAU +2.85%).
Charts courtesy www.stockcharts.com
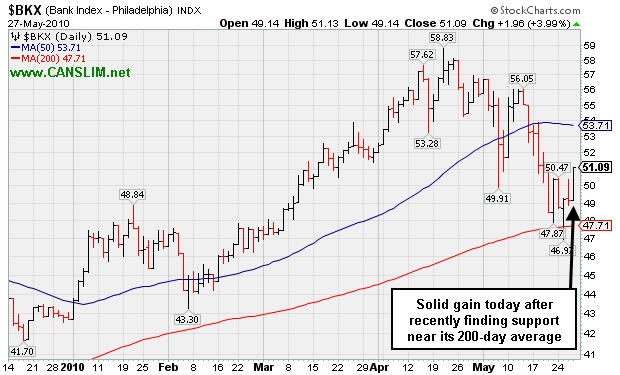
PICTURED: The Bank Index ($BKX +3.99%) posted a solid gain today after recently finding support near its 200-day moving average (DMA) line.
| Oil Services |
$OSX |
181.52 |
+4.49 |
+2.54% |
-6.87% |
| Healthcare |
$HMO |
1,477.92 |
+39.79 |
+2.77% |
+0.34% |
| Integrated Oil |
$XOI |
981.68 |
+50.10 |
+5.38% |
-8.10% |
| Semiconductor |
$SOX |
361.55 |
+17.77 |
+5.17% |
+0.46% |
| Networking |
$NWX |
246.82 |
+10.40 |
+4.40% |
+6.82% |
| Internet |
$IIX |
239.73 |
+8.26 |
+3.57% |
+2.51% |
| Broker/Dealer |
$XBD |
110.50 |
+4.13 |
+3.89% |
-3.96% |
| Retail |
$RLX |
448.59 |
+13.35 |
+3.07% |
+9.11% |
| Gold & Silver |
$XAU |
175.60 |
+4.86 |
+2.85% |
+4.37% |
| Bank |
$BKX |
51.09 |
+1.96 |
+3.99% |
+19.62% |
| Biotech |
$BTK |
1,057.61 |
+22.70 |
+2.19% |
+12.26% |
|
|
|
 |
Education Firm Enduring Distributional Pressure
Kenneth J. Gruneisen - Passed the CAN SLIM® Master's Exam
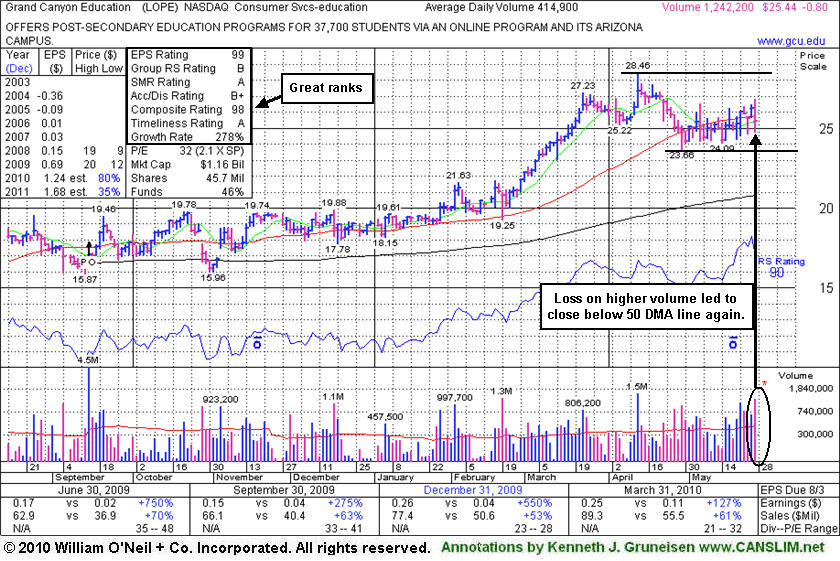
Grand Canyon Education (LOPE -$0.80 or -3.0% to $25.44) fell on heavy volume today, and the lack of price progress indicates distributional pressure as it pulled back and closed under its 50-day moving average (DMA) line. Now -10.6% off its 52-week high, it has been consolidating for a 7-week period since peaking on 4/13/10, building what may be considered a sound new base. Technically, its 4/29/10 low of $23.66 is the next important chart support, where further deterioration would raise greater concerns. The number of top-rated funds owning shares rose from 42 in Jun '09 to 62 Mar '10, providing some reassurance concerning the I criteria of the fact-based investment system. Distributional pressure negated its most recent breakout since it was featured in the 4/13/10 mid-day report (read here) when triggering a technical buy after a "3-weeks tight" type pattern. Leadership in the Commercial Services - Schools group was a nice reassurance for the L criteria, but subsequently, many for-profit schools have encountered distributional pressure in the wake of recently proposed regulatory changes. Broader market weakness (the M criteria) did nothing to help its chances. Until a follow-through-day helps confirm a solid looking new rally the odds do not look favorable for most stocks being able to rally.
 |
|
|
Color Codes Explained :
Y - Better candidates highlighted by our
staff of experts.
G - Previously featured
in past reports as yellow but may no longer be buyable under the
guidelines.
***Last / Change / Volume data in this table is the closing quote data***
Symbol/Exchange
Company Name
Industry Group |
PRICE |
CHANGE
(%Change) |
Day High |
Volume
(% DAV)
(% 50 day avg vol) |
52 Wk Hi
% From Hi |
Featured
Date |
Price
Featured |
Pivot Featured |
|
Max Buy |
BIDU
-
NASDAQ
Baidu Inc Ads
INTERNET - Internet Information Providers
|
$73.50
|
+5.91
8.74% |
$73.50
|
14,015,147
82.27% of 50 DAV
50 DAV is 17,036,100
|
$82.29
-10.68%
|
1/13/2010
|
$43.13
|
PP = $42.68
|
|
MB = $44.81
|
 Most Recent Note - 5/27/2010 2:21:52 PM
G - Gapped up today. It is extended from any sound base, consolidating above its 50 DMA line. A worrisome negative reversal from its all-time high on 5/13/10 followed a 10:1 stock split.
>>> The latest Featured Stock Update with an annotated graph appeared on 5/14/2010. Click here.
View all notes |
Alert me of new notes |
CANSLIM.net Company Profile |
SEC |
Zacks Reports |
StockTalk |
News |
Chart |
Request a new note
C
A N
S L
I M


|
BRLI
-
NASDAQ
Bio Reference Labs Inc
HEALTH SERVICES - Medical Laboratories and Researc
|
$22.96
|
+0.66
2.96% |
$23.23
|
160,887
85.49% of 50 DAV
50 DAV is 188,200
|
$24.67
-6.94%
|
2/12/2010
|
$39.02
|
PP = $20.49
|
|
MB = $21.51
|
Most Recent Note - 5/27/2010 2:25:29 PM
G - Gapped up today and spent most of the session above its 50 DMA line, now consolidating quietly about -7% from its all-time high.
>>> The latest Featured Stock Update with an annotated graph appeared on 5/26/2010. Click here.
View all notes |
Alert me of new notes |
CANSLIM.net Company Profile |
SEC |
Zacks Reports |
StockTalk |
News |
Chart |
Request a new note
C
A N
S L
I M
|
CRM
-
NYSE
Salesforce.Com Inc
INTERNET - Internet Software and Services
|
$87.00
|
+3.25
3.88% |
$87.00
|
2,509,425
121.97% of 50 DAV
50 DAV is 2,057,400
|
$89.84
-3.16%
|
3/5/2010
|
$72.28
|
PP = $75.53
|
|
MB = $79.31
|
Most Recent Note - 5/27/2010 2:32:15 PM
G - Gapped up today, trading within -4% of its all time high. Recent gains including its positive reversal on 5/21/10 are signs of institutional support recently showing up near its 50 DMA line. For the quarter ended April 30, 2010 it showed only a +7% earnings per share increase, marking its first increase below the +25% minimum guideline in years.
>>> The latest Featured Stock Update with an annotated graph appeared on 5/17/2010. Click here.
View all notes |
Alert me of new notes |
CANSLIM.net Company Profile |
SEC |
Zacks Reports |
StockTalk |
News |
Chart |
Request a new note
C
A N
S L
I M
|
LL
-
NYSE
Lumber Liquidators Hldgs
RETAIL - Home Improvement Stores
|
$29.80
|
+1.11
3.87% |
$29.84
|
164,341
44.14% of 50 DAV
50 DAV is 372,300
|
$33.41
-10.81%
|
4/22/2010
|
$29.87
|
PP = $29.03
|
|
MB = $30.48
|
Most Recent Note - 5/27/2010 2:35:52 PM
G - Another gain with light volume today is helping it rise further above its 50 DMA line and back above its December '09 highs, yet it remains about -12% off its 52-week high and faces some resistance. It has been quietly consolidating for about 5 weeks since its "negative reversal" after hitting an all-time high on 4/26/10 was noted.
>>> The latest Featured Stock Update with an annotated graph appeared on 5/19/2010. Click here.
View all notes |
Alert me of new notes |
CANSLIM.net Company Profile |
SEC |
Zacks Reports |
StockTalk |
News |
Chart |
Request a new note
C
A N
S L
I M
|
LOPE
-
NASDAQ
Grand Canyon Education
DIVERSIFIED SERVICES - Education and; Training Services
|
$25.44
|
-0.80
-3.05% |
$26.81
|
1,244,179
303.98% of 50 DAV
50 DAV is 409,300
|
$28.46
-10.61%
|
4/13/2010
|
$27.71
|
PP = $27.33
|
|
MB = $28.70
|
Most Recent Note - 5/27/2010 3:14:45 PM
G - Heavy volume and lack of price progress indicates distributional pressure as it pulls back near its 50 DMA line today, now -10% off its 52-week high. Consolidating for a 7-week period since peaking on 4/13/10. Technically, its 4/29/10 low of $23.66 is the next important chart support.
>>> The latest Featured Stock Update with an annotated graph appeared on 5/27/2010. Click here.
View all notes |
Alert me of new notes |
CANSLIM.net Company Profile |
SEC |
Zacks Reports |
StockTalk |
News |
Chart |
Request a new note
C
A N
S L
I M
|
Symbol/Exchange
Company Name
Industry Group |
PRICE |
CHANGE
(%Change) |
Day High |
Volume
(% DAV)
(% 50 day avg vol) |
52 Wk Hi
% From Hi |
Featured
Date |
Price
Featured |
Pivot Featured |
|
Max Buy |
MELI
-
NASDAQ
Mercadolibre Inc
INTERNET - Internet Software and; Services
|
$51.46
|
+2.10
4.25% |
$52.25
|
603,373
97.63% of 50 DAV
50 DAV is 618,000
|
$55.75
-7.70%
|
5/13/2010
|
$54.21
|
PP = $55.85
|
|
MB = $58.64
|
Most Recent Note - 5/27/2010 2:37:56 PM
G - Gapped up today, rallying further above its 50 DMA line. Market conditions (M criteria) remain doubtful until a follow-through day from at least one of the major averages confirms that sufficient institutional buying conviction has returned. Its 200 DMA and recent lows define important near-term chart support.
>>> The latest Featured Stock Update with an annotated graph appeared on 5/13/2010. Click here.
View all notes |
Alert me of new notes |
CANSLIM.net Company Profile |
SEC |
Zacks Reports |
StockTalk |
News |
Chart |
Request a new note
C
A N
S L
I M
|
ROVI
-
NASDAQ
Rovi Corp
COMPUTER SOFTWARE andamp; SERVICES - Security Software andamp; Services
|
$37.74
|
+0.66
1.78% |
$38.21
|
1,395,588
115.01% of 50 DAV
50 DAV is 1,213,500
|
$40.06
-5.79%
|
4/20/2010
|
$37.62
|
PP = $38.60
|
|
MB = $40.53
|
Most Recent Note - 5/27/2010 4:07:51 PM
G - Consolidating just -6% from its 52-week high, it posted a gain today on average volume to close just above its 50 DMA line. Its recent chart low ($33.17) defines near-term chart support above its 200 DMA line.
>>> The latest Featured Stock Update with an annotated graph appeared on 5/24/2010. Click here.
View all notes |
Alert me of new notes |
CANSLIM.net Company Profile |
SEC |
Zacks Reports |
StockTalk |
News |
Chart |
Request a new note
C
A N
S L
I M
|
SUMR
-
NASDAQ
Summer Infant Inc
CONSUMER NON-DURABLES - Personal Products
|
$7.50
|
+0.11
1.49% |
$7.64
|
84,111
151.82% of 50 DAV
50 DAV is 55,400
|
$8.21
-8.65%
|
5/4/2010
|
$6.85
|
PP = $7.09
|
|
MB = $7.44
|
Most Recent Note - 5/27/2010 2:42:22 PM
Y - While consolidating above prior chart highs and its 50 DMA line its color code was changed to yellow. Its latest breakout remains intact after enduring distributional pressure.
>>> The latest Featured Stock Update with an annotated graph appeared on 5/21/2010. Click here.
View all notes |
Alert me of new notes |
CANSLIM.net Company Profile |
SEC |
Zacks Reports |
StockTalk |
News |
Chart |
Request a new note
C
A N
S L
I M
|
ULTA
-
NASDAQ
Ulta Salon Cosm & Frag
SPECIALTY RETAIL - Specialty Retail, Other
|
$24.59
|
+0.97
4.11% |
$24.78
|
316,207
84.43% of 50 DAV
50 DAV is 374,500
|
$25.76
-4.54%
|
3/12/2010
|
$22.81
|
PP = $21.72
|
|
MB = $22.81
|
Most Recent Note - 5/27/2010 2:45:02 PM
G - Considerable gain today has it trading within -4% of its 52-week high. Prompt repair of 50 DMA line breach has been an encouraging sign. Recent chart lows define important support to watch.
>>> The latest Featured Stock Update with an annotated graph appeared on 5/20/2010. Click here.
View all notes |
Alert me of new notes |
CANSLIM.net Company Profile |
SEC |
Zacks Reports |
StockTalk |
News |
Chart |
Request a new note
C
A N
S L
I M
|
|
|
|
THESE ARE NOT BUY RECOMMENDATIONS!
Comments contained in the body of this report are technical
opinions only. The material herein has been obtained
from sources believed to be reliable and accurate, however,
its accuracy and completeness cannot be guaranteed.
This site is not an investment advisor, hence it does
not endorse or recommend any securities or other investments.
Any recommendation contained in this report may not
be suitable for all investors and it is not to be deemed
an offer or solicitation on our part with respect to
the purchase or sale of any securities. All trademarks,
service marks and trade names appearing in this report
are the property of their respective owners, and are
likewise used for identification purposes only.
This report is a service available
only to active Paid Premium Members.
You may opt-out of receiving report notifications
at any time. Questions or comments may be submitted
by writing to Premium Membership Services 665 S.E. 10 Street, Suite 201 Deerfield Beach, FL 33441-5634 or by calling 1-800-965-8307
or 954-785-1121.
|
|
|


