You are not logged in.
This means you
CAN ONLY VIEW reports that were published prior to Monday, April 14, 2025.
You
MUST UPGRADE YOUR MEMBERSHIP if you want to see any current reports.
AFTER MARKET UPDATE - THURSDAY, MAY 24TH, 2012
Previous After Market Report Next After Market Report >>>
|
|
|
|
DOW |
+33.60 |
12,529.75 |
+0.27% |
|
Volume |
796,659,040 |
-8% |
|
Volume |
1,688,539,490 |
-10% |
|
NASDAQ |
-10.74 |
2,839.38 |
-0.38% |
|
Advancers |
1,773 |
56% |
|
Advancers |
1,299 |
49% |
|
S&P 500 |
+1.82 |
1,320.68 |
+0.14% |
|
Decliners |
1,274 |
40% |
|
Decliners |
1,228 |
47% |
|
Russell 2000 |
+1.40 |
766.57 |
+0.18% |
|
52 Wk Highs |
35 |
|
|
52 Wk Highs |
20 |
|
|
S&P 600 |
+0.22 |
430.55 |
+0.05% |
|
52 Wk Lows |
45 |
|
|
52 Wk Lows |
66 |
|
|
 |
New Rally Effort Awaits Confirmation Day of Gains With More Volume
Kenneth J. Gruneisen - Passed the CAN SLIM® Master's Exam
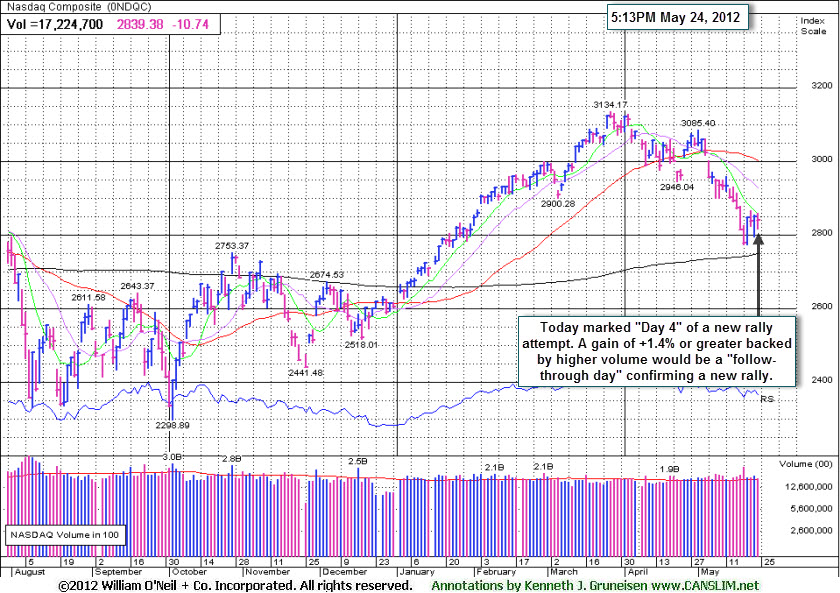
The market's latest rally attempt remains intact after "Day 4" on Thursday failed to deliver the robust confirming gains disciplined fact-based investors anxiously await. Volume totals were reported lighter on the Nasdaq exchange and on the NYSE versus the prior session's totals. Breadth was positive as advancers led decliners by nearly 3-2 on the NYSE, but advancers and decliners were evenly mixed on the Nasdaq exchange. New 52-week highs were still outnumbered by new 52-week lows on the NYSE and on the Nasdaq exchange. There were 14 high-ranked companies from the CANSLIM.net Leaders List that made new 52-week highs and appeared on the CANSLIM.net BreakOuts Page, up from the prior session total of 8 stocks. Investors watching for a follow-through day in the days and weeks ahead should be aware that an expansion in the number of stocks hitting new 52-week highs is an important component to any new confirmed rally. There were gains for 10 of the 20 high-ranked companies currently included on the Featured Stocks Page, a list that recently has been shrinking.
The major averages moved lower after spending the morning essentially unchanged as new economic data failed to distract investor attention on Europe's debt crisis. Durable goods orders rose +0.2% in April, but declined -0.6% excluding transportation. The weekly initial jobless claims fell 2,000 to 370,000, in-line with consensus expectations.
Consumer stocks were helped by a gain in Ford Motor Co (F +1.73%) after the automaker's credit rating was raised to investment grade by Moody's. Positive earnings gave Hewlett-Packard Co (HPQ +3.27%) got a boost after the PC maker reported better-than-expected results and announced job cuts. Tiffany & Co (TIF -6.81%) was down after the retailer reduced its full-year forecast. The Coca-Cola Co (KO +1.35%) rose following a positive article in Barron's. NetApp Inc (NTAP -12.29%) fell after lowering its outlook. VMware Inc (VMW -6.0%) fell warning growth could slow due to increased competition.
The major averages pared losses to finish mostly higher after Italian Prime Minister Mario Monti said a majority of leaders at a summit in Brussels backed a joint European bonds and that Greece is likely to keep the euro. European markets closed higher with the FTSE up +1.6% and the DAX up +0.5% despite continued concerns over Greece exiting the euro. The 10-year Treasury note was down 5/16 to yield 1.77%.
The S&P 500 Index held its ground after dipping at Wednesday's intra-day low to within 1 point of its 5/21/12 low (1,295.73). Historical studies suggest that the most constructive market rallies produced a solid follow-through day (FTD) between Days 4-7 of a new rally effort. The window is open for a new confirmed rally to present itself, and such technical proof may give fact-based investors the clearance to begin with new buying efforts only in sound candidates. Meanwhile, investors should keep up a watchlist of worthy buy candidates while remaining protective of capital.
PICTURED: Thursday marked "Day 4" of a new rally effort, and the rally attempt will remain intact for the Nasdaq Composite Index provided that its Day 1 low (2,774.76) is not undercut. The major averages (M criteria) are technically still considered to be in a "correction" and stocks remain vulnerable to much greater downside. Ideally, a follow-through day (FTD) between Day 4-7 of additional confirming gains of +1.4% or greater by either the Nasdaq Composite Index or the S&P 500 Index, backed by higher volume, and coupled with an expansion in the number of stocks hitting new highs, would "confirm" a new rally.
|
 Kenneth J. Gruneisen started out as a licensed stockbroker in August 1987, a couple of months prior to the historic stock market crash that took the Dow Jones Industrial Average down -22.6% in a single day. He has published daily fact-based fundamental and technical analysis on high-ranked stocks online for two decades. Through FACTBASEDINVESTING.COM, Kenneth provides educational articles, news, market commentary, and other information regarding proven investment systems that work in good times and bad.
Comments contained in the body of this report are technical opinions only and are not necessarily those of Gruneisen Growth Corp. The material herein has been obtained from sources believed to be reliable and accurate, however, its accuracy and completeness cannot be guaranteed. Our firm, employees, and customers may effect transactions, including transactions contrary to any recommendation herein, or have positions in the securities mentioned herein or options with respect thereto. Any recommendation contained in this report may not be suitable for all investors and it is not to be deemed an offer or solicitation on our part with respect to the purchase or sale of any securities. |
|
 |
Retail and Medical-Related Groups Posted Gains
Kenneth J. Gruneisen - Passed the CAN SLIM® Master's Exam
The Retail Index ($RLX +0.62%) posted a gain, and medical related stocks had a positive bias as the Biotechnology Index ($BTK +0.54%) and Healthcare Index ($HMO +1.49%) tallied gains. The tech sector lagged as the Networking Index ($NWX -1.65%), Internet Index ($IIX -1.46%), and Semiconductor Index ($SOX -1.41%) lost ground. The Broker/Dealer Index ($XBD -0.29%) fell again while the Bank Index ($BKX +0.07%) barely ended above unchanged. The Gold & Silver Index ($XAU +0.11%) and Integrated Oil Index ($XOI +0.23%) edged higher, but the Oil Services Index ($OSX -0.84%) lost ground.
Charts courtesy www.stockcharts.com
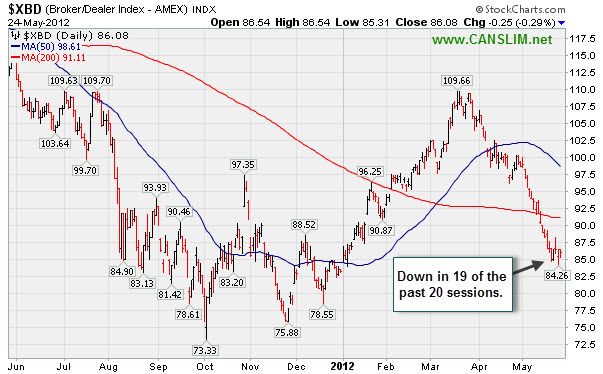
PICTURED: The Broker/Dealer Index ($XBD -0.29%) traded down in 19 of the past 20 sessions.
| Oil Services |
$OSX |
207.83 |
-1.77 |
-0.84% |
-3.91% |
| Healthcare |
$HMO |
2,295.13 |
+33.78 |
+1.49% |
+0.59% |
| Integrated Oil |
$XOI |
1,122.40 |
+2.59 |
+0.23% |
-8.68% |
| Semiconductor |
$SOX |
367.07 |
-5.26 |
-1.41% |
+0.72% |
| Networking |
$NWX |
204.48 |
-3.44 |
-1.65% |
-4.96% |
| Internet |
$IIX |
296.88 |
-4.39 |
-1.46% |
+5.37% |
| Broker/Dealer |
$XBD |
86.08 |
-0.25 |
-0.29% |
+3.38% |
| Retail |
$RLX |
608.28 |
+3.76 |
+0.62% |
+16.26% |
| Gold & Silver |
$XAU |
157.06 |
+0.18 |
+0.11% |
-13.05% |
| Bank |
$BKX |
44.19 |
+0.03 |
+0.07% |
+12.21% |
| Biotech |
$BTK |
1,455.80 |
+7.85 |
+0.54% |
+33.38% |
|
|
|
 |
Distributional Pressure a Problem After Limited Progress
Kenneth J. Gruneisen - Passed the CAN SLIM® Master's Exam
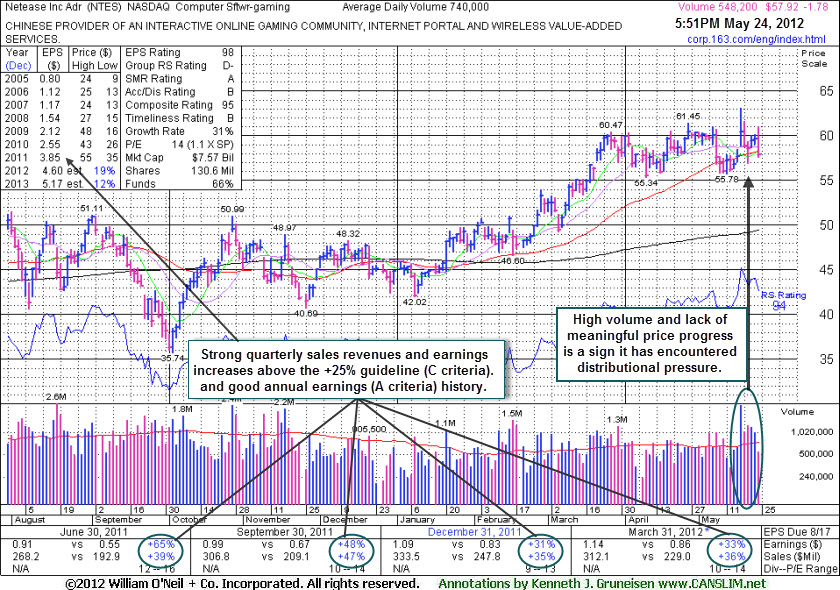
Netease.com Inc (NTES -$1.78 or -2.98% to $57.92) suffered a small loss on light volume as it closed below its 50-day moving average (DMA) line again today. There were 2 losing sessions with above average volume after its big volume-driven gain on 5/17/12 for a new 52-week high. Prior analysis stated that the stock had not formed a sound base pattern. No overhead supply remains to act as resistance, however it has made only limited price progress above its 2011 highs in the $55 area in recent months, including a time when market action was more favorable. Recent lows near the $55 area define important near-term chart support to watch, where any violation could trigger a worrisome technical sell signal.
The heavy volume without meaningful price progress in recent weeks is a sign that it has been encountering distributional pressure. Another concern is the waning number of top-rated funds owning its shares, which fell from 263 in Jun '11 to 257 in Mar '12, not a reassuring trend concerning the I criteria. Fundamentals remain healthy as it reported earnings +33% on +36% sales revenues for the quarter ended March 31, 2012 versus the year ago period. Its good earnings history satisfies the C and A criteria.
Its last appearance in this FSU section was on 3/27/12 with an annotated graph under the headline, "Winning Streak Leaves Leader Extended Above "Max Buy" Level", after a streak of 4 consecutive volume-driven gains into new high territory above the $60 level. It was featured in yellow at $56.18 in the 3/19/12 mid-day report (read here) with a pivot point based on its 4/19/11 high plus 10 cents.
|
|
|
Color Codes Explained :
Y - Better candidates highlighted by our
staff of experts.
G - Previously featured
in past reports as yellow but may no longer be buyable under the
guidelines.
***Last / Change / Volume data in this table is the closing quote data***
Symbol/Exchange
Company Name
Industry Group |
PRICE |
CHANGE
(%Change) |
Day High |
Volume
(% DAV)
(% 50 day avg vol) |
52 Wk Hi
% From Hi |
Featured
Date |
Price
Featured |
Pivot Featured |
|
Max Buy |
ACN
-
NYSE
Accenture Plc
DIVERSIFIED SERVICES - Business/Management Services
|
$57.99
|
-0.92
-1.56% |
$59.37
|
5,800,718
157.97% of 50 DAV
50 DAV is 3,672,100
|
$65.89
-11.99%
|
3/23/2012
|
$64.13
|
PP = $63.76
|
|
MB = $66.95
|
Most Recent Note - 5/22/2012 5:48:52 PM
G - Bounced from support at its longer-term 200 DMA line. Triggered technical sell signals with its recent losses undercutting prior highs in the $62-63 area and violating its 50 DMA line. See the latest FSU analysis for more details and a new annotated weekly graph.
>>> The latest Featured Stock Update with an annotated graph appeared on 5/22/2012. Click here.
View all notes |
Alert me of new notes |
CANSLIM.net Company Profile |
SEC |
Zacks Reports |
StockTalk |
News |
Chart |
Request a new note
C
A N
S L
I M


|
ALXN
-
NASDAQ
Alexion Pharmaceuticals
DRUGS - Drug Manufacturers - Other
|
$93.10
|
+2.53
2.79% |
$93.37
|
26,399,193
1,896.77% of 50 DAV
50 DAV is 1,391,800
|
$95.01
-2.01%
|
5/1/2012
|
$91.73
|
PP = $95.11
|
|
MB = $99.87
|
 Most Recent Note - 5/24/2012 11:57:56 AM
Y - Consolidating above its 50 DMA line today, and its color code is changed to yellow while no new pivot point is cited. Faces resistance in the $94-95 area, yet its technical stance and outlook improved with a gap up on news that Alexion will replace Motorola Mobility Holdings Inc in the S&P 500 Index at Thursday's close. Recent lows define near-term chart support well above its 200 DMA line. The M criteria remains an overriding concern until a follow-through day from at least one of the major averages confirms a new rally.
>>> The latest Featured Stock Update with an annotated graph appeared on 4/16/2012. Click here.
View all notes |
Alert me of new notes |
CANSLIM.net Company Profile |
SEC |
Zacks Reports |
StockTalk |
News |
Chart |
Request a new note
C
A N
S L
I M
|
ARBA
-
NASDAQ
Ariba Inc
INTERNET - Internet Software and Services
|
$45.08
|
+0.08
0.18% |
$45.10
|
4,428,541
258.65% of 50 DAV
50 DAV is 1,712,200
|
$45.48
-0.88%
|
4/27/2012
|
$38.53
|
PP = $37.24
|
|
MB = $39.10
|
Most Recent Note - 5/24/2012 11:58:22 AM
G - Holding its ground today following a considerable gain on 5/22/12 with heavy volume on news it will be bought by SAP in a $4.3 billion deal. The stock quickly got extended from its prior base after a quiet consolidation above chart support at its 50 DMA line and prior highs.
>>> The latest Featured Stock Update with an annotated graph appeared on 4/30/2012. Click here.
View all notes |
Alert me of new notes |
CANSLIM.net Company Profile |
SEC |
Zacks Reports |
StockTalk |
News |
Chart |
Request a new note
C
A N
S L
I M
|
CERN
-
NASDAQ
Cerner Corp
COMPUTER SOFTWARE and SERVICES - Healthcare Information Service
|
$79.37
|
-0.47
-0.59% |
$79.99
|
970,833
81.47% of 50 DAV
50 DAV is 1,191,600
|
$84.10
-5.62%
|
4/27/2012
|
$77.23
|
PP = $78.63
|
|
MB = $82.56
|
Most Recent Note - 5/21/2012 4:37:40 PM
Y - Color code is changed to yellow after above average volume behind today's gain was a sign of prompt support near its 50 DMA line. Its prior loss had negated its recent technical breakout. Market weakness (M criteria) is an overriding concern that argues against new buying efforts until a new confirmed rally with a follow-through day by at least one of the major averages.
>>> The latest Featured Stock Update with an annotated graph appeared on 5/1/2012. Click here.
View all notes |
Alert me of new notes |
CANSLIM.net Company Profile |
SEC |
Zacks Reports |
StockTalk |
News |
Chart |
Request a new note
C
A N
S L
I M
|
CMCSA
-
NASDAQ
Comcast Corp Cl A
MEDIA - CATV Systems
|
$28.93
|
+0.14
0.49% |
$29.17
|
12,747,547
100.37% of 50 DAV
50 DAV is 12,700,400
|
$30.88
-6.30%
|
5/2/2012
|
$30.04
|
PP = $30.51
|
|
MB = $32.04
|
Most Recent Note - 5/21/2012 4:39:56 PM
G - Posted a gain today with lighter volume. Color code was changed to green after slumping under its 50 DMA line, and last week it also undercut the prior low ($28.54 on 4/10/12) triggering a more worrisome technical sell signal.
>>> The latest Featured Stock Update with an annotated graph appeared on 5/7/2012. Click here.
View all notes |
Alert me of new notes |
CANSLIM.net Company Profile |
SEC |
Zacks Reports |
StockTalk |
News |
Chart |
Request a new note
C
A N
S L
I M
|
Symbol/Exchange
Company Name
Industry Group |
PRICE |
CHANGE
(%Change) |
Day High |
Volume
(% DAV)
(% 50 day avg vol) |
52 Wk Hi
% From Hi |
Featured
Date |
Price
Featured |
Pivot Featured |
|
Max Buy |
COO
-
NYSE
Cooper Companies Inc
HEALTH SERVICES - Medical Instruments and Supplies
|
$85.74
|
-0.02
-0.02% |
$87.61
|
469,291
114.27% of 50 DAV
50 DAV is 410,700
|
$89.31
-4.00%
|
3/9/2012
|
$83.05
|
PP = $81.02
|
|
MB = $85.07
|
Most Recent Note - 5/21/2012 12:27:30 PM
G - Trading up today following a streak of 6 consecutive losses. Consolidating above prior highs in the $83-84 area and its 50 DMA line, important near-term support. A subsequent violation may trigger a worrisome sell signal.
>>> The latest Featured Stock Update with an annotated graph appeared on 5/18/2012. Click here.
View all notes |
Alert me of new notes |
CANSLIM.net Company Profile |
SEC |
Zacks Reports |
StockTalk |
News |
Chart |
Request a new note
C
A N
S L
I M
|
DG
-
NYSE
Dollar General Corp
RETAIL - Discount, Variety Stores
|
$47.65
|
+0.75
1.60% |
$48.09
|
2,806,391
103.78% of 50 DAV
50 DAV is 2,704,200
|
$48.76
-2.28%
|
5/7/2012
|
$48.51
|
PP = $47.69
|
|
MB = $50.07
|
Most Recent Note - 5/22/2012 4:36:05 PM
G - Down today average volume, encountering resistance at its 50 DMA line. Recent violation of that important short-term average triggered a technical sell signal and its color code was changed to green. It has encountered recent distributional pressure while market conditions (M criteria) turned for the worse.
>>> The latest Featured Stock Update with an annotated graph appeared on 5/9/2012. Click here.
View all notes |
Alert me of new notes |
CANSLIM.net Company Profile |
SEC |
Zacks Reports |
StockTalk |
News |
Chart |
Request a new note
C
A N
S L
I M
|
EXPE
-
NASDAQ
Expedia Inc
INTERNET - Internet Information Providers
|
$45.25
|
-0.36
-0.79% |
$45.84
|
4,615,308
102.98% of 50 DAV
50 DAV is 4,481,900
|
$46.07
-1.78%
|
4/27/2012
|
$41.80
|
PP = $35.57
|
|
MB = $37.35
|
Most Recent Note - 5/23/2012 6:43:13 PM
G - Hit a new 52-week high today with 2 times average volume behind a considerable gain. Technically, it rallied from an advanced "3-weeks tight" base with no resistance remaining due to overhead supply, however no new pivot point has being cited. Until the market confirms a new rally with a solid follow through day from at least one of the major averages (M criteria) the fact-based investment system argues against new buying efforts in any stocks.
>>> The latest Featured Stock Update with an annotated graph appeared on 5/3/2012. Click here.
View all notes |
Alert me of new notes |
CANSLIM.net Company Profile |
SEC |
Zacks Reports |
StockTalk |
News |
Chart |
Request a new note
C
A N
S L
I M
|
GNC
-
NYSE
G N C Holdings Inc
RETAIL - Drug Stores
|
$39.75
|
+1.30
3.38% |
$39.98
|
2,356,666
111.59% of 50 DAV
50 DAV is 2,111,900
|
$41.95
-5.24%
|
1/19/2012
|
$28.99
|
PP = $29.60
|
|
MB = $31.08
|
Most Recent Note - 5/21/2012 4:59:01 PM
G - Found support near prior highs and its 50 DMA line while consolidating. Reported earnings +82% on +23% sales revenues for the quarter ended March 31, 2012 versus the year ago period.
>>> The latest Featured Stock Update with an annotated graph appeared on 4/26/2012. Click here.
View all notes |
Alert me of new notes |
CANSLIM.net Company Profile |
SEC |
Zacks Reports |
StockTalk |
News |
Chart |
Request a new note
C
A N
S L
I M
|
MG
-
NYSE
Mistras Group Inc
DIVERSIFIED SERVICES - Bulding and Faci;ity Management Services
|
$23.78
|
-0.20
-0.83% |
$23.90
|
68,183
68.59% of 50 DAV
50 DAV is 99,400
|
$26.24
-9.38%
|
3/22/2012
|
$24.96
|
PP = $26.34
|
|
MB = $27.66
|
Most Recent Note - 5/21/2012 5:00:15 PM
G - Still consolidating in a tight trading range near its 50 DMA line. For more than a month it has been holding its ground above its 200 DMA line. Previously noted - "A volume-driven gain above its recent chart high ($25.49 on 3/21/12) may help trigger a proper technical buy signal after a new base formation, however no new (lower) pivot point is currently being cited, and it may continue encountering stubborn resistance."
>>> The latest Featured Stock Update with an annotated graph appeared on 4/2/2012. Click here.
View all notes |
Alert me of new notes |
CANSLIM.net Company Profile |
SEC |
Zacks Reports |
StockTalk |
News |
Chart |
Request a new note
C
A N
S L
I M
|
Symbol/Exchange
Company Name
Industry Group |
PRICE |
CHANGE
(%Change) |
Day High |
Volume
(% DAV)
(% 50 day avg vol) |
52 Wk Hi
% From Hi |
Featured
Date |
Price
Featured |
Pivot Featured |
|
Max Buy |
NTES
-
NASDAQ
Netease Inc Adr
INTERNET - Internet Information Providers
|
$57.92
|
-1.78
-2.98% |
$61.00
|
548,942
74.18% of 50 DAV
50 DAV is 740,000
|
$63.07
-8.17%
|
3/19/2012
|
$56.18
|
PP = $55.10
|
|
MB = $57.86
|
Most Recent Note - 5/24/2012 6:29:06 PM
G - Closed below its 50 DMA line today with a loss on light volume. Recent lows near the $55 area define important chart support to watch where a violation may trigger a worrisome technical sell signal. See the latest FSU analysis for more details and a new annotated graph.
>>> The latest Featured Stock Update with an annotated graph appeared on 5/24/2012. Click here.
View all notes |
Alert me of new notes |
CANSLIM.net Company Profile |
SEC |
Zacks Reports |
StockTalk |
News |
Chart |
Request a new note
C
A N
S L
I M
|
SWI
-
NYSE
Solarwinds Inc
COMPUTER SOFTWARE and SERVICES - Application Software
|
$47.72
|
-0.16
-0.33% |
$48.42
|
1,254,700
111.76% of 50 DAV
50 DAV is 1,122,700
|
$48.00
-0.58%
|
4/26/2012
|
$45.15
|
PP = $42.32
|
|
MB = $44.44
|
Most Recent Note - 5/23/2012 4:26:37 PM
G - Rallied to a new all-time high today with a considerable gain on below average volume. It did not form a sound new base of sufficient length, and the market (M criteria) is currently in need of a follow-through day to confirm a new rally.
>>> The latest Featured Stock Update with an annotated graph appeared on 5/21/2012. Click here.
View all notes |
Alert me of new notes |
CANSLIM.net Company Profile |
SEC |
Zacks Reports |
StockTalk |
News |
Chart |
Request a new note
C
A N
S L
I M
|
SXCI
-
NASDAQ
S X C Health Solutions
COMPUTER SOFTWARE and SERVICES - Healthcare Information Service
|
$89.83
|
-0.61
-0.67% |
$91.32
|
579,218
52.62% of 50 DAV
50 DAV is 1,100,700
|
$100.50
-10.62%
|
2/23/2012
|
$68.24
|
PP = $66.05
|
|
MB = $69.35
|
Most Recent Note - 5/22/2012 4:32:09 PM
G - Reversed early gains today and closed near the session low with a small loss on higher (near average) volume. Still holding its ground in a tight range after pricing a new Public Offering last week. Consolidating in a tight range since it posted huge volume-driven gains on 4/18 and 4/19 while rallying on M&A news.
>>> The latest Featured Stock Update with an annotated graph appeared on 5/17/2012. Click here.
View all notes |
Alert me of new notes |
CANSLIM.net Company Profile |
SEC |
Zacks Reports |
StockTalk |
News |
Chart |
Request a new note
C
A N
S L
I M
|
TDG
-
NYSE
Transdigm Group Inc
AEROSPACE/DEFENSE - Aerospace/Defense Products and; Services
|
$124.95
|
-0.38
-0.30% |
$126.00
|
448,195
92.93% of 50 DAV
50 DAV is 482,300
|
$132.69
-5.83%
|
2/29/2012
|
$120.10
|
PP = $118.93
|
|
MB = $124.88
|
Most Recent Note - 5/23/2012 6:41:55 PM
G - Held its ground today after 2 solid gains backed by above average volume, a sign of prompt support at its 50 DMA line and near prior highs. Poor market conditions (M criteria) argue against making any new buying efforts until a new confirmed rally by at least one of the major averages with a solid follow-through day. See the latest FSU analysis for more details and a new annotated graph.
>>> The latest Featured Stock Update with an annotated graph appeared on 5/23/2012. Click here.
View all notes |
Alert me of new notes |
CANSLIM.net Company Profile |
SEC |
Zacks Reports |
StockTalk |
News |
Chart |
Request a new note
C
A N
S L
I M
|
TNGO
-
NASDAQ
Tangoe Inc
COMPUTER SOFTWARE and SERVICES - Technical and System Software
|
$21.00
|
-0.41
-1.91% |
$21.66
|
169,956
25.65% of 50 DAV
50 DAV is 662,500
|
$23.05
-8.89%
|
3/27/2012
|
$19.35
|
PP = $20.00
|
|
MB = $21.00
|
Most Recent Note - 5/21/2012 4:45:48 PM
G - Volume totals have been cooling while consolidating above prior highs in the $20 area and above important support at its 50 DMA line. Broader market conditions (M criteria) argue against new buying efforts until a new confirmed rally with follow-through day.
>>> The latest Featured Stock Update with an annotated graph appeared on 4/3/2012. Click here.
View all notes |
Alert me of new notes |
CANSLIM.net Company Profile |
SEC |
Zacks Reports |
StockTalk |
News |
Chart |
Request a new note
C
A N
S L
I M
|
Symbol/Exchange
Company Name
Industry Group |
PRICE |
CHANGE
(%Change) |
Day High |
Volume
(% DAV)
(% 50 day avg vol) |
52 Wk Hi
% From Hi |
Featured
Date |
Price
Featured |
Pivot Featured |
|
Max Buy |
TSCO
-
NASDAQ
Tractor Supply Co
SPECIALTY RETAIL - Specialty Retail, Other
|
$99.30
|
+1.32
1.35% |
$99.50
|
766,855
85.37% of 50 DAV
50 DAV is 898,300
|
$101.20
-1.88%
|
5/1/2012
|
$98.38
|
PP = $101.30
|
|
MB = $106.37
|
Most Recent Note - 5/22/2012 4:29:33 PM
G - Promptly rebounded above its 50 DMA line today with a gain backed near average volume. It did not trigger a new (or add-on) technical buy signal in recent weeks. Market conditions (M criteria) argue against new buying efforts until a new confirmed rally with a solid follow-through day by at least one of the major averages.
>>> The latest Featured Stock Update with an annotated graph appeared on 4/17/2012. Click here.
View all notes |
Alert me of new notes |
CANSLIM.net Company Profile |
SEC |
Zacks Reports |
StockTalk |
News |
Chart |
Request a new note
C
A N
S L
I M
|
UA
-
NYSE
Under Armour Inc Cl A
CONSUMER NON-DURABLES - Textile - Apparel Clothing
|
$97.29
|
+2.41
2.54% |
$98.06
|
1,131,799
122.12% of 50 DAV
50 DAV is 926,800
|
$102.86
-5.42%
|
2/15/2012
|
$85.77
|
PP = $84.86
|
|
MB = $89.10
|
Most Recent Note - 5/21/2012 4:48:25 PM
G - Posted a gain and finished near the session high today but volume was lighter than average. Concerns were recently raised by weaker fundamentals, its first quarterly earnings increase below the +25% minimum guideline in more than 2 years.
>>> The latest Featured Stock Update with an annotated graph appeared on 4/4/2012. Click here.
View all notes |
Alert me of new notes |
CANSLIM.net Company Profile |
SEC |
Zacks Reports |
StockTalk |
News |
Chart |
Request a new note
C
A N
S L
I M
|
V
-
NYSE
Visa Inc Cl A
DIVERSIFIED SERVICES - Business/Management Services
|
$119.77
|
+0.60
0.50% |
$121.00
|
3,187,352
87.94% of 50 DAV
50 DAV is 3,624,300
|
$125.35
-4.45%
|
3/12/2012
|
$116.53
|
PP = $119.46
|
|
MB = $125.43
|
Most Recent Note - 5/21/2012 4:51:13 PM
G - Up today with lighter volume, rebounding toward it 50 DMA line which has acted as a resistance level after the technical violation on 5/03/12. The longer it lingers below its 50 DMA line the worse its outlook becomes.
>>> The latest Featured Stock Update with an annotated graph appeared on 5/16/2012. Click here.
View all notes |
Alert me of new notes |
CANSLIM.net Company Profile |
SEC |
Zacks Reports |
StockTalk |
News |
Chart |
Request a new note
C
A N
S L
I M
|
VSI
-
NYSE
Vitamin Shoppe Inc
SPECIALTY RETAIL - Specialty Retail, Other
|
$51.13
|
+1.33
2.67% |
$51.36
|
370,694
78.67% of 50 DAV
50 DAV is 471,200
|
$55.29
-7.52%
|
4/25/2012
|
$47.77
|
PP = $48.46
|
|
MB = $50.88
|
Most Recent Note - 5/21/2012 4:52:57 PM
G - Gain today was backed by lighter than average volume as it found some support near its old highs and halted a streak of 5 consecutive losses since a negative reversal at its 52-week high. It has slumped below its "max buy" level, however broader market weakness (M criteria) is an overriding concern which argues against any new buying efforts until a new rally is confirmed with a solid follow-through day by at least one of the major averages.
>>> The latest Featured Stock Update with an annotated graph appeared on 4/25/2012. Click here.
View all notes |
Alert me of new notes |
CANSLIM.net Company Profile |
SEC |
Zacks Reports |
StockTalk |
News |
Chart |
Request a new note
C
A N
S L
I M
|
WFM
-
NASDAQ
Whole Foods Market Inc
RETAIL - Grocery Stores
|
$86.42
|
+0.04
0.05% |
$86.42
|
1,235,062
76.13% of 50 DAV
50 DAV is 1,622,400
|
$91.50
-5.55%
|
5/3/2012
|
$90.28
|
PP = $86.45
|
|
MB = $90.77
|
Most Recent Note - 5/21/2012 4:55:02 PM
G - Gain today with slightly higher above average volume was a sign of prompt support as it rebounded above its 50 DMA line following a streak of 5 consecutive losses which completely negated the latest breakout. It stalled following its considerable "breakaway gap" on 5/03/12, meanwhile the broader market (M criteria) fell into the latest correction.
>>> The latest Featured Stock Update with an annotated graph appeared on 5/11/2012. Click here.
View all notes |
Alert me of new notes |
CANSLIM.net Company Profile |
SEC |
Zacks Reports |
StockTalk |
News |
Chart |
Request a new note
C
A N
S L
I M
|
Symbol/Exchange
Company Name
Industry Group |
PRICE |
CHANGE
(%Change) |
Day High |
Volume
(% DAV)
(% 50 day avg vol) |
52 Wk Hi
% From Hi |
Featured
Date |
Price
Featured |
Pivot Featured |
|
Max Buy |
|
|
|
THESE ARE NOT BUY RECOMMENDATIONS!
Comments contained in the body of this report are technical
opinions only. The material herein has been obtained
from sources believed to be reliable and accurate, however,
its accuracy and completeness cannot be guaranteed.
This site is not an investment advisor, hence it does
not endorse or recommend any securities or other investments.
Any recommendation contained in this report may not
be suitable for all investors and it is not to be deemed
an offer or solicitation on our part with respect to
the purchase or sale of any securities. All trademarks,
service marks and trade names appearing in this report
are the property of their respective owners, and are
likewise used for identification purposes only.
This report is a service available
only to active Paid Premium Members.
You may opt-out of receiving report notifications
at any time. Questions or comments may be submitted
by writing to Premium Membership Services 665 S.E. 10 Street, Suite 201 Deerfield Beach, FL 33441-5634 or by calling 1-800-965-8307
or 954-785-1121.
|
|
|

